Dynamics and Selection of Giant Spirals in Rayleigh-Bénard Convection
Abstract
For Rayleigh-Bénard convection of a fluid with Prandtl number , we report experimental and theoretical results on a pattern selection mechanism for cell-filling, giant, rotating spirals. We show that the pattern selection in a certain limit can be explained quantitatively by a phase-diffusion mechanism. This mechanism for pattern selection is very different from that for spirals in excitable media.
pacs:
47.54.+r, 47.52.+j, 47.20.Lz, 47.27.TeSpiral patterns are found in many pattern-forming systems[4]. Famous examples include cardiac arrhythmias of the heart [5], the aggregation of starving slime mold amoebae [6], and the Belousov-Zhabotinsky chemical reaction [7]. Many of these systems can be classified as excitable media in which the core of the spiral, like a pacemaker, selects the temporal and spatial evolution of the outward travelling spiral waves [7]. In this Letter we present a detailed experimental study of a driven, dissipative system in which the formation of spirals can be attributed to a qualitatively different mechanism acting far away from the spiral’s core. In particular, we show for Rayleigh-Bénard convection (RBC) of a small Prandtl number fluid that the rotation of giant, multi-armed spirals can be captured using concepts based on nonlinear phase equations [8, 9, 10, 11, 12, 16]. These concepts should be universal and preliminary evidence indicates that similar reasoning may also apply to the spiral pattern formation in vibrating granular layers [13] and in gas discharges [14].
As stated earlier [15], the rigid rotation of a giant, finite spiral of radius necessitates that the spiral waves which propagate from the spiral’s core are annihilated at by a circular motion of the outer defect. Thus, the pattern simply consists of stationary, concentric rolls for . This balancing mechanism has been placed on a more precise theoretical framework by Cross and Tu [10, 11] (CTC). They argue that the rotation of a spiral requires the reconciliation of two competing selection principles acting far away from the spiral’s core: (1) wavelength selection by climb of the outer defect and (2) the emission of radially travelling waves due to target selection. These arguments have been successfully tested within generalized Swift-Hohenberg (SH) models for axisymmetric spirals [10, 11, 12, 16] and have also been extended to multi-armed spirals [12]. However, the generalized SH-model used in these studies contains ad hoc parameters, and its stability regime deviates substantially from that for RBC [17]. As Cross [11] has pointed out in his concluding remarks, serious conceptual uncertainties remain as well.
In this Letter, we present the first quantitative experimental and theoretical analysis of giant rotating spirals in RBC. For axisymmetric, multi-armed spirals in large aspect-ratio cells we find good quantitative agreement between experimental measurements and theoretical predictions. However, for the frequent case of non-axisymmetric spirals our measurements are in conflict with the proposed target selection mechanism and, as a consequence, CTC’s “Invasive Chaos” idea as a tentative explanation of Spiral Defect Chaos (SDC) [18] requires refinement.
Rayleigh-Bénard convection occurs in a horizontal fluid layer of height heated from below when the temperature difference exceeds a critical value . For , a pattern of convection rolls with wavenumber develops [17]. Recent large aspect-ratio experiments using pressurized gases revealed interesting nonrelaxational pattern evolution. For moderate Bodenschatz et al. [15] found giant rotating spirals similar to those described here, while Morris et al. [18] found the spatiotemporal chaotic state of spiral defect chaos (SDC).
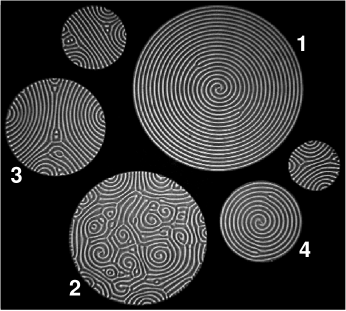
As shown in Fig. 1, our experiment consisted of six circular convection cells filled with pressurized gas. The convective pattern was visualized with the shadowgraph technique [19]. The experimental setup including parameters is described in detail in Ref. [20]. In most experimental runs reported here we increased quasi-statically starting from below onset of convection (). Upon crossing onset, a small amplitude axisymmetric target patterns developed in all cells due to weak static sidewall forcing. (We achieved this by a step in the cells’ sidewalls [20]). Above the initially axisymmetric target moved off-center, compressing the pattern on one side while dilating it on the other. The appearance of this instability is consistent with theoretical predictions [9]. Upon further increases in the target moved farther off-center until the wavenumber in the compressed region increased beyond the skewed-varicose (SV) instability [17] and a defect pair would nucleate to decrease the wavenumber. One of the defects then moved to the center while the other glided radially outward before coming to rest at a distance from the geometrical center. The pattern then relaxed to an on-center, one-armed rotating spiral of radius . (While this instability was observed for in the largest cell, it was slightly postponed in the smaller cells). Above we observed a behavior reminiscent of the target instability in which the spiral’s core would move off-center. For we observed stable, rotating, off-center spirals (see Fig. 3 below) which with each increase in would move further off-center. Eventually, the wavenumber in the compressed region increased beyond the SV-instability and defect pairs nucleated. The pattern then developed into a three- or four-armed spiral, into the so-called PanAm pattern, or into Spiral Defect Chaos. Examples of the latter two are shown in Fig. 1 in cell 3 and cell 2, respectively. We note that stability properties of spirals had not been addressed experimentally nor theoretically prior to our investigations.
For a few additional runs, we jumped the control parameter from below the onset of convection () to above (). As the jump was increased, we observed targets, one-armed spirals, multi-armed spirals, PanAm patterns, and SDC. Interestingly, we observed two-armed spirals only when we employed this procedure. Otherwise, the general trend with observed using the two methods was similar. We note that when was quasi-statically decreased starting from SDC or PanAm patterns, we observed PanAm patterns, not targets, even close to onset. This shows that the static sidewall forcing was very weak.
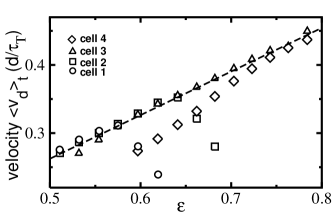
Let us initially focus on the one-armed spiral. Fig. 2 shows the average velocities of the outer defects for an experimental run with one-armed spirals in cells 1–4. (The velocities are normalized in terms of , where is the vertical thermal diffusion timescale.) Note that the spirals had a variety of different sizes . We measured by tracking the path of the outer defect with a Fourier demodulation technique [21, 22]. For on-center spirals the averaged defect velocities of spirals in cells 1–3 obeyed the same linear relationship . For values of with off-center spirals, changed abruptly. (The spiral in cell 4 showed deviations from this behavior, possibly due to its small size.) We also measured the rotation frequency of the spirals and found that the data are well-described by . This dependence on spiral size differs markedly from the size-independence of observed for spirals in excitable media [7].
The first part of CTC’s argument is that the behavior of the outer defect of a spiral can be considered as a dislocation climbing in a (slightly curved) roll pattern with a radial wavenumber in analogy to the simpler case of a dislocation climbing with the velocity in a straight roll pattern with background wavenumber . This latter case was considered theoretically in the framework of the Swift-Hohenberg model [8]. Based on the phase diffusion equation which captures the behavior far from the defect, the defect velocity was found to obey the relation [25]:
| (1) |
where is the zero-velocity wavenumber.
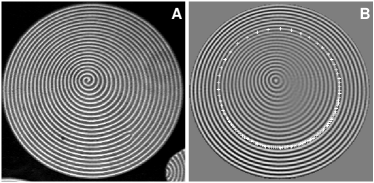
In order to compare with this theoretical prediction one first needs a sensible definition of a background wavenumber . Crucial to this was the observation that the time-average of an -armed spiral (when performed over a duration equal to a multiple of the rotation period) yielded a target pattern. This is exemplified in Fig. 3(B) for the one-armed off-center spiral shown in Fig. 3(A). As shown below, choosing the radial wavenumber of the target pattern as the background wavenumber in Eq. (1) appeared to work quite well.
The occurrence of a target pattern after averaging over a rotating spiral can be rationalized by the following approximate calculation. A one-armed, finite spiral can be described satisfactorily by a modified Archimedean spiral, i.e., , where is the wavenumber of the underlying target without defects, is the amplitude, and is the radial distance from the spiral’s center. The phases and are polar angles centered about the spiral’s core at and the outer defect position , respectively. It is not difficult to show that the time-average of such a rigidly rotating spiral gives , where is the first Bessel function of the first kind. We note that the corresponding average of an Archimedean spiral () would vanish.
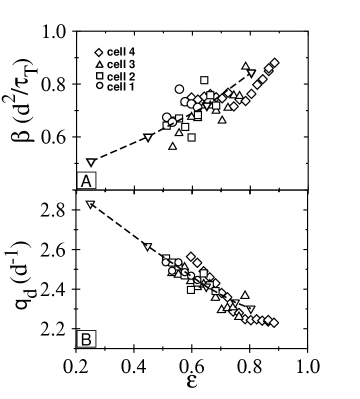
Using the above definition of the background wavenumber , we tested Eq. (1) using experimental velocities obtained from off-center, one-armed spirals over a wide range of values of . The slower defect motion in the dilated regions and the faster motion in the compressed regions seen in Fig. 3B is consistent with Eq. (1). For a quantitative test we measured at the defect positions by fitting small regions to concentric roll patterns [22]. (The method of Ref. [26] produced similar values.) We then plotted versus for each value of and found that the data were well-described by a linear relationship, allowing us to determine the parameters and using a least-squares fitting procedure [27]. These data are shown in Fig. 4. Using simulations of the three-dimensional Boussinesq equations [28], we also measured defect velocities as a function of background wavenumber for defects moving in straight roll patterns. Again, we found a linear relationship between and and determined and . As shown in Fig. 4, the numerically determined values for and are in excellent agreement with the experiment. Using the simulations, we also analyzed off-center, one-armed spirals [29] and found excellent agreement between experiment and theory [30].
The second part of CTC’s argument — selection by circular traveling waves — relies on the fact that away from the core of the spiral the wavefronts deviate only slightly from circular and are thus well-approximated as targets. It has been shown that targets prefer a specific wavenumber [9], and that a target with a wavenumber differing from will attempt to adjust its wavenumber by emitting circular waves of frequency . Using the nonlinear Cross-Newell phase-diffusion equation [9], one finds
| (2) |
where , is the parallel diffusion constant, and is the distance from the center of the target. The numerical value of the parameter can be calculated from the growth rate of a longitudinal modulation with wavenumber of a pattern with wavenumber as [9].
Using geometrical arguments, CTC showed that a one-armed spiral requires:
| (3) |
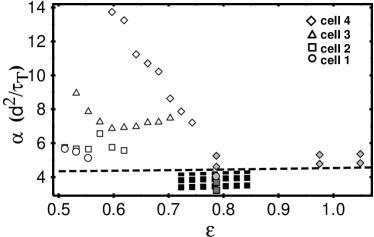
where, again, is the velocity of the defect at radius . We used Eq. (3) and Eq. (2) and the generalization to multi-armed spirals [12] to determine . From the investigations above and a similar analysis for -armed, on-center spirals, we measured the average defect velocity . For each cell we determined by extrapolating the azimuthal average of at the defect positions from on-center targets at lower to the larger where we observed the -armed, on-center spirals. We found that [22]. The data for was in good agreement with the numerical predictions by Buell and Catton [31]. The remaining unknown background wavenumber was measured from the underlying target, again azimuthally averaged over the defect positions. With this information we determined for one-, two-, three-, and four-armed on-center spirals. The data are summarized in Fig. 5. It shows that for the larger cells and the multi-armed spirals agrees well with the theoretical value numerically determined from the growth rate of the Eckhaus instability using a Galerkin code (dashed line). The discrepancies become significant for one-armed spirals in the smaller cells 3 and 4.
For the frequently occurring off-center spirals we found that the rotating spirals had regions where the local wavenumber was larger than that of the stationary target. This observation indicates that a “local” interpretation of Eq. (2) (negative ) is not reasonable. Rotating spirals are important structure elements of SDC [18, 26]. Mostly they are one-armed and often strongly off-center. In this case the target selection becomes unreliable and as a consequence CTC’s “Invasive Chaos” idea as an explanation of SDC has to be reconsidered.
In summary, our analysis presents the first quantitative test of Eq. (1) [8] and Eq. (2) [10, 11, 12] in a real physical system. Giant multi-armed spirals are exceptionally well-suited for the study of dislocation dynamics in RBC; one can follow the defect trajectories for very long times and, in addition, the background wavenumber is naturally defined by the time average of the spiral.
This work was supported by the National Science Foundation (DMR-9320124, ASC-9503963 ,and DMR-9705410), by NATO (CRG-950243), and by the Cornell Theory Center. B.B.P acknowledges support from the Department of Education and W.P. thanks the Cornell Matrial Science Center for its hospitality.
REFERENCES
- [1] Presently at Center for Nonlinear Dynamics, the University of Texas at Austin.
- [2] Presently at Center for Nonlinear Studies, Los Alamos National Laboratory.
- [3] E-mail: eb22@cornell.edu.
- [4] M. C. Cross and P. C. Hohenberg, Rev. Mod. Phys. 65, 851 (1993) and references therein.
- [5] L. Glass, Phys. Today 49, 40 (1996) and references therein.
- [6] K. J. Lee, E. C. Cox, and R. E. Goldstein, Phys. Rev. Lett. 76, 1174 (1996) and references therein.
- [7] A. Belmonte and J. M. Flesselles, Phys. Rev. Lett. 77, 1174 (1996) and references therein.
- [8] G. Tesauro and M. C. Cross, Phys. Rev. A 34, 1363 (1986).
- [9] A. C. Newell, T. Passot, and M. Souli, J. Fluid Mech. 220, 187 (1990) and references therein.
- [10] M. C. Cross and Y. Tu, Phys. Rev. Lett. 75, 834 (1995).
- [11] M. C. Cross, Physica D 97, 65 (1996).
- [12] X. J. Li, H. W. Xi, and J. D. Gunton, Phys. Rev. E 54, R3105 (1996).
- [13] J. R. deBruyn et al., to appear in Phys. Rev. Lett. 81 (1998).
- [14] Yu. A. Astrov, I. Müller, E. Ammelt, and H.-G. Purwins, Phys. Rev. Lett. 80, 5341 (1998) and H.-G. Purwins private communication.
- [15] E. Bodenschatz, J. R. deBruyn, G. Ahlers, and D. S. Cannell, Phys. Rev. Lett. 67, 3078 (1991).
- [16] L. S. Tsimring, Physica A 249, 125 (1998).
- [17] R. M. Clever and F. H. Busse, J. Fluid Mech. 65, 625 (1974) and F. H. Busse and R. M. Clever, J. Fluid Mech. 91, 319 (1979).
- [18] S. W. Morris, E. Bodenschatz, D. S. Cannell, and G. Ahlers, Phys. Rev. Lett. 71, 2026 (1993).
- [19] J. R. deBruyn et al., Rev. Sci. Instrum. 67, 2043 (1996).
- [20] B. B. Plapp and E. Bodenschatz, Phys. Scripta T67, 111 (1996).
- [21] G. Goren, I. Procaccia, S. Rasenat, and V. Steinberg, Phys. Rev. Lett. 63, 1237 (1989).
- [22] B. B. Plapp, Ph.D. Thesis, Cornell Univ. (1997).
- [23] The radius of the outer defect was for cell 1: for ; cell 2: for ; cell 3: for ; cell 4: for .
- [24] A. Pocheau and V. Croquette, J. Phys. (Paris) 45, 35 (1984).
- [25] Eq. (1) is valid for a non-potential system. Pocheau and Croquette [24] measured the defect dynamics in an experimental straight roll pattern for and found that their results agreed with the prediction for a potential system where (see [8]).
- [26] D. A. Egolf, I. V. Melnikov, and E. Bodenschatz, Phys. Rev. Lett. 80, 3228 (1998).
- [27] The linear fit was appropriate for the most off-center spirals, but for spirals whose variation in wavenumber was small, the linear portion of the versus plot was chosen for the fit (for details see Ref. [22]).
- [28] W. Pesch, Chaos 6, 348 (1996).
- [29] B. Dressel, Diploma Thesis, Univ. Bayreuth (1998).
- [30] We note that a weak logarithmic correction to Eq. (1) was predicted by Tusaro and Cross [8]; however, our data did not allow us to verify this small correction.
- [31] J. C. Buell and I. Catton, Phys. Fluids 29, 23 (1986).