[
Continuum-type stability balloon in oscillated granular layers
Abstract
The stability of convection rolls in a fluid heated from below is limited by secondary instabilities, including the skew-varicose and crossroll instabilities. We observe a stability boundary defined by the same instabilities in stripe patterns in a vertically oscillated granular layer. Molecular dynamics simulations show that the mechanism of the skew-varicose instability in granular patterns is similar to that in convection. These results suggest that pattern formation in granular media can be described by continuum models analogous to those used in fluid systems.
pacs:
47.54.+r,83.10.Pp,83.70.Fn,81.05.Rn]
A system comprised of a large number of discrete grains behaves like a fluid under some conditions and like a solid under others, but can also display behavior unique to the granular state [2]. Despite substantial recent interest in both the statics and dynamics of granular systems, there is no unifying theoretical description of granular materials, and it has been argued that a general local, continuum description of granular media, analogous to hydrodynamics, is unlikely to exist [2, 3, 4]. In this Letter we report on a study of the stability of stripe patterns that form when a horizontal layer of granular material is oscillated vertically [5, 6, 7]. In both experiments and simulations, we observe behavior strikingly similar to that seen in fluid dynamical systems [8]. Our results suggest that a continuum description of pattern formation in granular media is possible.
Recent experiments on pattern formation in oscillated granular layers [5, 6, 7] have demonstrated the existence of stripe, square and hexagonal patterns [5, 6], as well as localized structures called oscillons [7], as the frequency and amplitude of the vibration and the layer thickness are varied. At onset, the patterns are subharmonic, that is, they oscillate with a frequency equal to half the driving frequency. The patterns are similar in spatial structure to those observed in fluid dynamical systems, most notably parallel convection rolls in a thin layer of fluid heated from below (Rayleigh-Bénard convection) [8, 9] and standing surface waves in a vertically oscillated liquid layer (the Faraday instability) [8, 10]. Molecular dynamics simulations [11, 12] have reproduced the various granular patterns at values of the control parameters equal to those used in the experiments [12]. Some aspects of the granular patterns have been described using various models for the dynamics [13], amplitude equations [14], and iterative maps [15]. However, a rigorously derived theoretical description of pattern formation in oscillated granular media does not yet exist, and the extent to which the well-developed understanding of patterns in fluid systems [8] can be applied to granular material has not been established.
Our experimental apparatus is similar to that used in Refs. [5, 6]. Bronze spheres 150-180 m in diameter are contained in a cylindrical cell 14.7 cm in diameter. The cell sidewall and top lid are made of Plexiglas. The aluminum bottom plate is flat out to a radius of 5.0 cm, then slopes upwards to the sidewall at an angle of 2∘. As do fluid convection rolls, the stripes prefer to form perpendicular to the cell wall; the “beach” reduces the effect of the sidewall on their orientation. The cell is evacuated, and an electromagnetic shaker, driven sinusoidally, oscillates the cell vertically at a frequency . , the amplitude of the acceleration relative to the gravitational acceleration , is determined using an accelerometer mounted on the bottom of the cell. The pattern is illuminated with a ring of LEDs encircling the cell and strobed at . Images of the patterns are recorded using a digital video camera mounted above the cell.
Experiments were performed on layers of thickness (scaled by the mean particle diameter) in the range , in a frequency range over which stripe patterns formed. The layer was flat for , at which point stripes appeared via a subcritical bifurcation. Typically, was increased suddenly from below onset to a value in the stripe regime. We observed time-dependent patterns which were predominantly stripe-like but with curvature, and which contained point defects, grain boundaries, spiral defects[6], and sidewall foci. Stripes persisted as was increased, until the system (for most conditions) underwent a subcritical transition to hexagons [5]. Below this transition we observed two secondary instabilities of the stripes — the skew-varicose and crossroll instabilities [8, 9] — which limited the wavenumber range over which stripes were stable at a given frequency. Similar phenomena occured in cells without a beach.
Figure 1 shows the localized skew-varicose instability observed when the local wave number of the pattern becomes too large. An initially straight pattern of stripes develops a distortion. Eventually one or more stripes pinch off and dislocation defects form, which then propagate away by a combination of climbing and gliding. Since one or more stripes are destroyed by this process, it leads to a decrease in the local wave number. Analogous behavior has been observed in Rayleigh-Bénard convection [16, 17] and the Faraday instability [18].
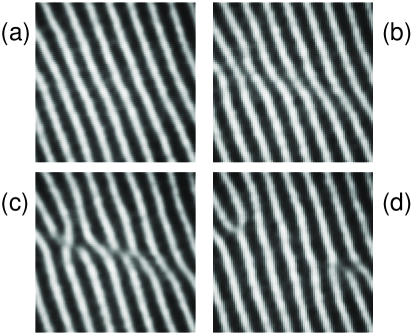
Figure 2 shows an example of a crossroll instability, which is again analogous to that seen in fluid convection [16, 19]. Crossrolls are observed to occur via two processes, and, for most conditions, occur when the local wave number becomes too small. Squares and/or perpendicular stripes can develop locally, or, as in Fig. 2, a region of stripes can be invaded by a region of perpendicularly oriented stripes.
To determine the wave number at which the stripe pattern becomes unstable to these instabilities, we used the method of Ref. [20] to determine at each point in a small region of the pattern in which the instability occurs. was averaged over the region of interest for a time series of images bracketing the instability. The mean wave number is plotted in Fig. 3 for the skew-varicose event of Fig. 1. increases up to the onset of the instability, then suddenly changes when a stripe is pinched off and defects form. The standard deviation of increases as the pattern gradually becomes distorted and is relatively large immediately following the instability. After the defects have traveled away, a stripe pattern with a smaller wave number remains and is again low. In Fourier-space the skew-varicose instability is signalled by the local appearance of Fourier power at an oblique angle — typically 15∘ to 25∘ — to the wave vector of the original stripe pattern.
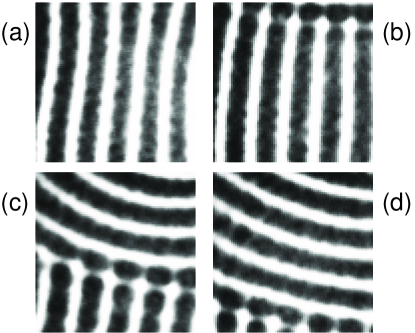

Figure 4 shows analogous data for the crossroll event of Fig. 2. In this case decreases prior to the onset of the instability. When the crossrolls invade, the local pattern is disrupted and increases. At the end of the time interval shown, the region contains a pattern of straight stripes perpendicular to and with larger than the original stripes. In Fourier space, the development of crossrolls is accompanied by the appearance of power at 90∘ to the original wave vector.

By analyzing a number of similar events over a range of , , and , we can construct a stability diagram for the stripe pattern analogous to the Busse balloon [9] for Rayleigh-Bénard convection. We take the maximum value of before a stripe pinches off as the wave number corresponding to the skew-varicose instability, and the minimum value of before the appearance of crossrolls as that for the crossroll instability.
Figure 5 is the resulting stability diagram for and Hz. It indicates that there is a limited range of over which the stripe pattern is stable. The stability range is bounded at high by the skew-varicose instability and at low by the crossroll instability. Similar stability boundaries, but with slightly different shapes, were measured at a number of different values of and . However, for the depth in Fig. 5, the boundary is different at high frequencies: At Hz, the stripes are unstable to crossrolls on both the high and low sides of the stability boundary, and at the same depth and Hz, squares rather than hexagons limit the range of existence of stripes at high . These stability boundaries are very similar to those for Rayleigh-Bénard convection rolls: For low Prandtl number fluids [21], the skew-varicose instability forms the high- limit of the stability balloon, while crossrolls are observed on the low- side [9, 16, 17]. For higher Prandtl number, the crossroll instability occurs at both high and low [9, 19].

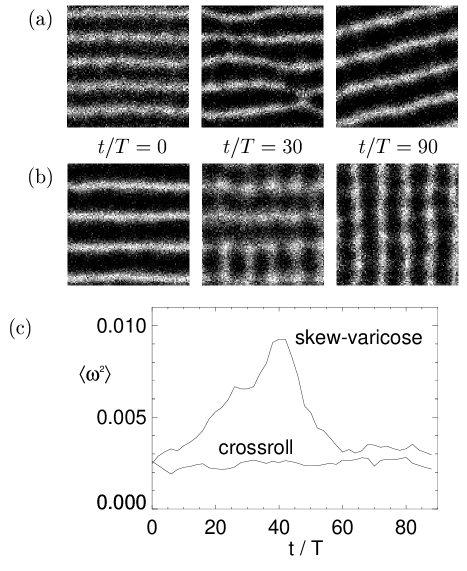
We have also observed skew-varicose and crossroll instabilities in event-driven molecular dynamics simulations which have been previously validated against experiment [12]. We simulated the motions of 60000 particles in a square cell of side 100 particle diameters, with periodic boundary conditions in both horizontal directions. A pattern of straight stripes with either too large or too small to be stable at the frequency of the simulation was used as the initial condition. Time sequences of the resulting instabilities are shown in Fig. 6. As in the experiments, the skew-varicose instability leads to a decrease in while the crossroll instability leads to an increase in .
Patterns of rolls in fluid convection are well described by partial differential equations for the amplitude (near onset) and the phase of the pattern [8]. The crossroll instability exists in an amplitude equation description that allows for the existence of two perpendicular modes. The skew-varicose instability, however, depends on the existence of a large scale vertical vorticity (or mean flow), which couples to roll curvature [22]. To determine whether an analogous vertical vorticity exists for skew-varicose instabilities in the granular layer, the particle velocities from the simulations were averaged spatially over depth and temporally over one oscillation of the pattern. The resulting two-dimensional velocity field was then low-pass filtered to remove spatial frequencies due to the pattern itself. Finally, we calculated the squared vorticity, , and averaged it over the entire cell. The result is shown in Fig. 6(c). The vertical vorticity increases as the skew-varicose instability develops, then sharply decreases after a stripe pinches off. In contrast, there is no change in for the crossroll instability.
We have shown that the range of stability of stripe patterns which form in an oscillated granular layer is limited by the skew-varicose and crossroll instabilities, and that the stability boundary of stripe patterns in granular layers is similar to that of straight rolls in a convecting fluid. Our simulations produce the same instabilities, and indicate that vertical vorticity plays a role in the skew-varicose instability, as it does in fluid systems. These results demonstrate a clear correspondence between patterns in oscillated granular media and hydrodynamic systems, and suggest that, despite the unique physical properties of the oscillated granular layer, a continuum description of this system should be possible.
We are grateful to W. D. McCormick and B. B. Plapp for helpful discussions. This research was supported by the Department of Energy Office of Basic Energy Sciences and the Texas Advanced Research Program.
REFERENCES
- [1] Permanent address: Department of Physics and Physical Oceanography, Memorial University of Newfoundland, St. John’s, Newfoundland, Canada A1B 3X7. Email address: jdebruyn@kelvin.physics.mun.ca
- [2] H. M. Jaeger, S. R. Nagel, and R. B. Behringer, Rev. Mod. Phys. 68, 1259 (1996); L. P. Kadanoff, unpublished.
- [3] Y. Du, H. Li, and L. P. Kadanoff, Phys. Rev. Lett. 74, 1268 (1995).
- [4] P. K. Haff, J. Fluid Mech. 134, 401 (1983).
- [5] F. Melo, P. B. Umbanhowar, and H. L. Swinney, Phys. Rev. Lett. 75, 3838 (1995).
- [6] P. B. Umbanhowar, F. Melo, and H. L. Swinney, Physica A, in press.
- [7] P. B. Umbanhowar, F. Melo, and H. L. Swinney, Nature (U. K.) 382, 793 (1996).
- [8] M. C. Cross and P. C. Hohenberg, Rev. Mod. Phys. 65, 851 (1993).
- [9] F. H. Busse, Rep. Prog. Phys. 41, 1929 (1978); F. H. Busse, in Hydrodynamic Instabilities and the Transition to Turbulence, edited by H.L. Swinney and J.P. Gollub (Springer, Berlin, 1981), p. 97.
- [10] A. Kudrolli and J. P. Gollub, Physica D97, 133 (1996).
- [11] S. Luding, E. Clément, J. Rajchenbach, and J. Duran, Europhys. Lett. 36, 247 (1996); L. Labous and E. Clément, unpublished; K. M. Aoki and T. Akiyama, Phys. Rev. Lett. 77, 4166 (1996); C. Bizon et al., ibid. 79, 4713, (1997); K. M. Aoki and T. Akiyama, ibid. 79, 4714 (1997).
- [12] C. Bizon, M. D. Shattuck, J. B. Swift, W. D. McCormick, and H. L. Swinney, Phys. Rev. Lett. 80, 57 (1998).
- [13] T. Shinbrot, Nature (U. K.) 389, 574 (1997); E. Cerda, F. Melo, and S. Rica, Phys. Rev. Lett. 79, 4570 (1997); D. H. Rothman, unpublished; J. Eggers and H. Riecke, unpublished.
- [14] L. S. Tsimring and I. S. Aranson, Phys. Rev. Lett. 79, 213 (1997); H. Sakaguchi and H. R. Brand, J. Phys. II, 7, 1325 (1997).
- [15] S. C. Venkataramani and E. Ott, unpublished.
- [16] A. Pocheau, V. Croquette, and P. LeGal, Phys. Rev. Lett. 55, 1094 (1985); B. B. Plapp, Ph. D. thesis, Cornell University, 1997 (unpublished).
- [17] Y. Hu, R. Ecke, and G. Ahlers, Phys. Rev. E 48, 4399 (1993).
- [18] W. S. Edwards and S. Fauve, J. Fluid Mech. 278, 123 (1994).
- [19] F. H. Busse and J. A. Whitehead, J. Fluid Mech. 47, 305 (1971).
- [20] D. Egolf, I. Melnikov, and E. Bodenschatz, to be published. This is an efficient way to determine for stripe-like patterns, but does not give correct results for square patterns or at defects.
- [21] The Prandtl number of a fluid is the ratio of its viscosity to its thermal diffusivity.
- [22] M. C. Cross, Phys. Rev. A 27, 490 (1983).