Onset of Surface-Tension-Driven Bénard Convection
Abstract
Experiments with shadowgraph visualization reveal a subcritical transition to a hexagonal convection pattern in thin liquid layers that have a free upper surface and are heated from below. The measured critical Marangoni number (84) and observation of hysteresis () agree with theory. In some experiments, imperfect bifurcation is observed and is attributed to deterministic forcing caused in part by the lateral boundaries in the experiment.
pacs:
PACS numbers: 47.54.+r, 47.20.Dr, 47.20.Ky, 68.15.+eThe onset of motion in heated fluid layers with a free upper surface has eluded complete understanding ever since Bénard’s investigation [3] of these flows established thermal convection as a paradigm for pattern formation in nonequilibrium systems [4]. Rayleigh’s analysis [5] of this problem assumed that buoyancy effects, which are always present in layers heated from below, caused convection, but the threshold that Rayleigh predicted did not agree with Bénard’s observations. Forty years elapsed before it was recognized that the instability observed in Bénard’s studies was caused not by buoyancy but by surface tension gradients [6], as characterized by the Marangoni number (see Fig. 1). Linear theory [7] yields onset at =. Weakly nonlinear theory [8, 9] predicts a subcritical (hysteretic) transition to a hexagonal pattern. Only a single experimental investigation [10] has systematically examined the onset of convection for layers sufficiently thin such that surface tension forces dominate over buoyancy. That experiment revealed a primary transition to a concentric roll pattern at values of that decreased as the fluid layers became thinner; for the thinnest layers studied, rolls emerged at an order of magnitude smaller than from theory.
In this Letter we present evidence for a well-defined primary transition in surface-tension-driven Bénard (Marangoni) convection experiments designed so that surface tension forces dominate over buoyancy to a greater extent than in previous investigations. We observe a hysteretic bifurcation to a defect-free array of hexagonal cells; this bifurcation is modeled by an amplitude equation, which permits comparison to both linear and weakly nonlinear stability theory. We also observe hexagons to arise from an imperfect bifurcation where the hysteresis disappears; this bifurcation is described qualitatively with the addition of a deterministic forcing term to the amplitude equation. In our experiments, surface tension effects are 40 times larger than buoyancy effects, i.e., 40, where the Rayleigh number is defined as / with liquid expansion coefficient and gravitational acceleration . A necessary condition for the flow to be surface-tension-dominated is 1 [11]; previous experiments attained 11 [10].
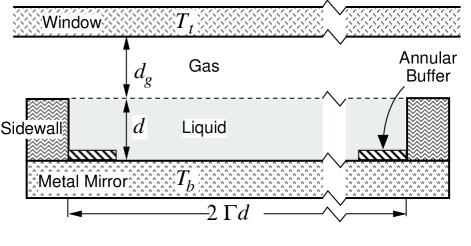
The experiments are performed on a purified silicone oil layer (=0.04190.0005 cm) that is bounded from below by 1-cm-thick gold-coated aluminum mirror (Fig. 1) [12]. A uniform air layer (=0.04550.0008 cm) lies between the oil layer and a 1-mm-thick sapphire window. The oil is confined by a Teflon sidewall ring of inner diameter 4.530.01 cm. Because nonuniform wetting can cause large relative changes in the liquid layer thickness near the sidewall, a polyethersulfone annular buffer of thickness 50 m suppresses convection adjacent to the sidewall [13]. The inner diameter of the buffer determines the radius to height ratio =45.60.1 of the convecting region. The oil and the air layer depths each vary by less than 1 over the central 70 of the convecting region, as measured both mechanically and interferometrically. Use of a purified [14] silicone oil (96.7 hexacosamethyldodecasiloxane) avoids both condensation [14] and cross-diffusive effects [15] that can affect pattern formation. A temperature gradient is imposed by water-cooling the window to a temperature =13.3200.005∘C and by computer-controlled-heating the mirror to a temperature that fluctuates less than 0.0005∘C. For sufficiently small , the surface tension () at the liquid-gas interface is uniform; however, with sufficiently large, instability causes surface tension variations that drive flow in the bulk. The shadowgraph technique is used to detect onset and to visualize patterns. Images are digitized and background subtracted to improve the signal-to-noise ratio. The time scale in the experiment is set by the vertical diffusion time, =/=1.9 s.
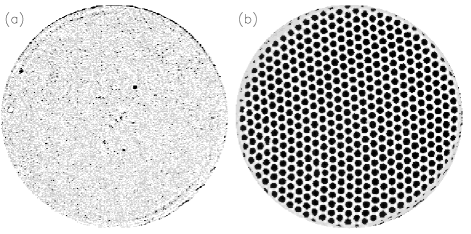
Figure 2 demonstrates that the conductive state undergoes an abrupt transition to hexagons as is increased slowly (d/dt= in units of ). Just prior to onset, weak circular convection rolls arise near the boundary [upper left and lower right in Fig. 2(a)]; we believe these rolls are driven by static forcing due to the slight mismatch of thermal conductivity between the annular buffer and the liquid. Convection cells first appear within a portion of the boundary rolls after an increase of in –1. ( is determined from the experiments, as will be described.) Additional hexagons then nucleate from the initial cells and propagate as a traveling front, invading the apparatus until the entire flow domain is filled with the hexagonal pattern [Fig. 2(b)]. The resulting pattern is nearly free from defects since the lattice is grown from a single “seed crystal” at the boundary. The front propagates across the apparatus in approximately 900, a time short compared to the horizontal diffusion time 4.
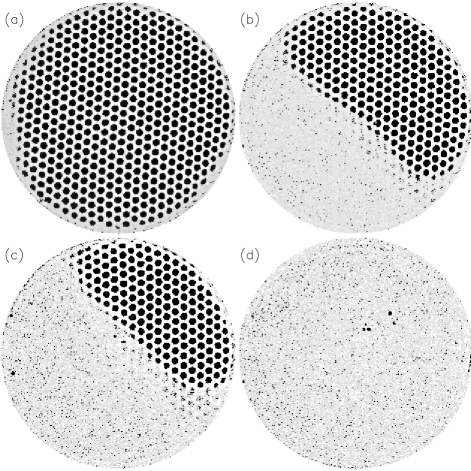
On decreasing quasistatically, hexagons persist at parameter values below that for the first appearance of cells (Fig. 3). The transition to the conductive state occurs gradually; the control parameter typically must be decremented through a range of before the hexagonal convection pattern disappears. The front between hexagonal and conductive states can remain stationary indefinitely (or at least for times long compared to the horizontal diffusion time) for states like Fig. 3(b) or (c) if is held constant.
Near onset, the hexagonal pattern arises from the interaction of three plane wave (roll) solutions whose wavevectors have a magnitude equal to the critical wavenumber and differ in angle by 2/3 [16]. The evolution of the pattern can then be described by a Landau equation for the amplitude
| (1) |
with 0 and a constant that can account for deterministic forcing. In some cases, the coefficients in Eq. (1) can be computed from the full fluid equations [17]. The existence of hexagons requires 0; thus, the bifurcation from the conductive state must be subcritical. The solutions for hexagonal convection and for conduction are both linearly stable over a range of parameter: with =– (the conductive state is linearly unstable for 0).
Equation (1) is a variational model that exhibits relaxational time dependence governed by a potential function [18], which we first consider for =0. Over the parameter range where both conduction and convection are stable, each state corresponds to a minimum of the potential; one state represents the global minimum while the other state, the metastable phase, represents a local minimum. The potential varies as changes; at a parameter value (the Maxwell point) both states have equal values of the potential. As passes through , the states exchange the roles of global stability/metastability. For Eq. (1), the conductive state is globally stable for = and metastable for .

To compare the experimental observations to the model, we compute two-dimensional spatial power spectra from shadowgraph images. The spectra are azimuthally averaged and normalized to the variance of the image intensity. The mean position of the fundamental spectral peak yields the wavenumber 1.900.02 (nondimensionalized by ); linear stability analysis predicts a critical wavenumber of 1.99 [7]. The wavenumber is independent of for the range investigated. The amplitude in Fig. 4 is the square root of the power contained in the spectral peak at the fundamental wavenumber.
Figure 4 demonstrates that the experimental observations illustrated in Figs. 2 and 3 are consistent with Eq. (1). Hexagonal convection amplitudes for increasing and decreasing near the bifurcation are fit by a parabola, as suggested by (1) with =0; from this fit we estimate = with a precision of 0.5 in . The uncertainty in the accuracy is 11 in , primarily due to the uncertainty in the thermal properties for the silicone oil. From Fig. 4, we also estimate =–3.2 and =–2.8 [19]. For increasing , the conductive state shown in Fig. 2(a) is deep within the metastable regime when the initial onset occurs. The weak convection roll at the boundary provides a sufficient perturbation to push the system over the potential barrier, and the front between the two states propagates to spread the globally stable state (hexagons) across the entire apparatus. With decreasing , hexagonal convection can become metastable; however, the range of parameter values where hexagons are metastable is nearly an order of magnitude smaller than the region of metastability for conduction. This suggests that the transition back to conduction will be more sensitive to small spatial variations in due to nonuniformities in the depths of both liquid and gas layers. Thus, for values of near the metastable region of hexagons, the front will move in stages to spread the conductive state across the apparatus, as shown in Figs. 3(b) and 3(c).
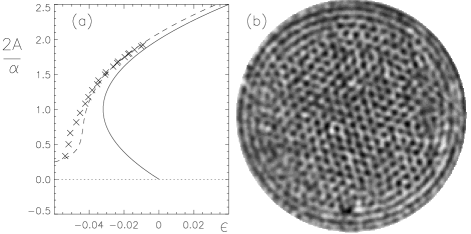
In some cases, convection appears without hysteresis. This situation arises, for example, in experiments where is repeatedly increased and decreased, causing conduction and convection to alternate. As the number of cycles increases, hysteresis is observed at smaller values of and for a smaller range of . The convective onset occurs continuously [Fig. 5(a)] after a sufficient number of cycles; this number varies from 3 to 15 between different experimental runs. Our observations indicate that deterministic forcing, which increases slowly (on a time scale much longer than the horizontal diffusion time), causes an imperfect bifurcation [20]. Equation (1) models imperfect bifurcation with 0; for =/27, hysteresis disappears at the onset of hexagons. In this regime, Eq. (1) qualitatively describes the amplitudes measured from our experiments [Fig. 5(a)]; the difference between the model and the data suggests that a more complex form for [e.g., is necessary for quantitative agreement.
The physical origin of the forcing that causes imperfect bifurcation has not been determined definitively; however, the observation of low amplitude rolls parallel to the lateral boundary [Fig. 5(b)] suggests sidewall boundaries are affecting the flow. Similar structures arise in buoyancy-driven convection with intentional thermal forcing at the sidewall [13], although forcing for surface-tension-driven flow is probably more complex because some deformation of the free surface at the boundary is unavoidably present due to nonuniform contact line pinning at the sidewall. The low amplitude flows become increasingly cellular away from the boundaries and toward the center of the apparatus; moreover, with increasing above onset, the rolls at the sidewall are supplanted by hexagonal cells as the amplitudes arising from imperfect bifurcation approach the amplitudes observed during hysteretic onset [Fig. 5(a)].
Our experimental studies of onset confirm the predictions of theory and suggest an explanation for the puzzling disagreement between previous experiments and theory for the century-old problem of surface-tension-driven Bénard convection. Our determination of =84 is in reasonable agreement with from linear theory [21], and our observation of subcritical bifurcation is in accord with weakly nonlinear theory. Our finding of 3.2 hysteresis sets a standard for comparison to nonlinear theories, whose estimates of hysteresis range from 0.2 [9] to 2.3 [8]. Observation of imperfect bifurcation demonstrates the sensitivity of the primary instability in Marangoni convection to perturbations; the appearance of rolls before hexagons at in previous experiments [10] may well be due to this sensitivity.
We are grateful to M. Bestehorn, S. H. Davis, R. E. Kelly, and E. L. Koschmieder for helpful discussions. This work is supported by a NASA Microgravity Science and Applications Division Grant No. NAG3-1382. One of us (S.J.V.H.) acknowledges support from the NASA Graduate Student Researchers Fellowship Program.
REFERENCES
- [1] Electronic mail: schatz@chaos.ph.utexas.edu
- [2] Electronic mail: swinney@chaos.ph.utexas.edu
- [3] H. Bénard, Rev. Gén. Sci. Pure Appl. 11, 1261 (1900).
- [4] M. C. Cross and P. C. Hohenberg, Rev. Mod. Phys. 65, 851 (1993).
- [5] Lord Rayleigh, Phil. Mag. 32, 529 (1916).
- [6] M. J. Block, Nature 178, 650 (1956).
- [7] J. R. A. Pearson, J. Fluid Mech. 4, 489 (1958).
- [8] J. Scanlon and L. Segal, J. Fluid Mech. 30, 149 (1967).
- [9] A. Cloot and G. Lebon, J. Fluid Mech. 145, 447 (1984).
- [10] E. L Koschmieder and M. I. Biggerstaff, J. Fluid Mech. 167, 49 (1986).
- [11] S. H. Davis and G. M. Homsy, J. Fluid Mech. 98, 527 (1980).
- [12] Physical properties for the liquid and the gas (= g/cm3, = cS, = dyn/cm∘C, =1.25 erg/cms∘C, =1.1∘C-1, =8.6 cm2/s, and =2.55 erg/cms∘C) are obtained from the literature; see, for example, R. R. McGregor, Silicones and Their Uses (McGraw-Hill, New York, 1956) and references therein; CRC Handbook of Chemistry and Physics, 59th ed. (CRC Press, West Palm Beach, 1978); H. J. Palmer and J. C. Berg, J. Fluid Mech. 47, 779 (1971).
- [13] G. Ahlers, C. W. Meyer and D. S. Cannell, J. Stat. Phys. 54, 1121 (1989).
- [14] M. F. Schatz and K. Howden, submitted to Exp. Fluids (1995).
- [15] E. Moses and V. Steinberg, Phys. Rev. Lett. 57, 2018 (1986).
- [16] S. Ciliberto, P. Coullet, J. Lega, E. Pampaloni, and C. Pérez-García, Phys. Rev. Lett. 65, 2370 (1990).
- [17] S. H. Davis, Annu. Rev. Fluid Mech. 19, 403 (1987); M. Bestehorn, Phys. Rev. E 48, 3622 (1993).
- [18] B. A. Malomed, A. A. Nepomnyashchy, and M. I. Tribelshy, Phys. Rev. A 42, 7244 (1990).
- [19] is typically an order of magnitude smaller for the onset of hexagons in buoyancy-driven convection; see, for example, E. Bodenschatz, J. R. de Bruyn, G. Ahlers and D. S. Cannell, Phys. Rev. Lett. 67, 3078 (1991).
- [20] G. Iooss and D. D. Joseph, Elementary Stability and Bifurcation Theory (Springer-Verlag, Berlin, 1990).
- [21] Linear theory that accounts for the small effects of both buoyancy (=39) and heat transfer (=0.2–see Fig. 1) predicts =86.9; see D. A. Nield, J. Fluid Mech. 19, 341 (1964).