Long-Wavelength Instability in Surface-Tension-Driven Bénard Convection
Abstract
Laboratory studies reveal a deformational instability that leads to a drained region (dry spot) in an initially flat liquid layer (with a free upper surface) heated uniformly from below. This long-wavelength instability supplants hexagonal convection cells as the primary instability in viscous liquid layers that are sufficiently thin or are in microgravity. The instability occurs at a temperature gradient 34% smaller than predicted by linear stability theory. Numerical simulations show a drained region qualitatively similar to that seen in the experiment.
pacs:
PACS numbers: 47.20.Dr, 47.20.Ky, 47.54.+r, 68.15.+eBénard’s observation in 1900 [4] of hexagonal convection patterns launched the modern study of convection, pattern formation, and instabilities; yet understanding of the surface-tension-driven regime in which Bénard performed his experiments is still far from complete. Block [5] and Pearson [6] first showed how temperature-induced surface tension gradients (thermocapillarity) caused the instability observed in Bénard’s experiments. Pearson’s linear stability analysis with a nondeformable liquid-gas interface yielded an instability at wavenumber = 1.99 (scaled by the mean liquid depth ) and Marangoni number , where (see Fig. 1) expresses the competition between the destabilization by thermocapillarity and the stabilization by diffusion.
A deformable free surface allows a second type of primary instability in which a perturbation creates a nonuniform liquid depth and temperature profile [7, 8]. Thermocapillarity causes cool, elevated regions to pull liquid from warm, depressed regions (see Fig. 1). The instability appears with a long wavelength since surface tension stabilizes short wavelengths. Linear stability analyses that allow for deformation reveal this instability (see Fig. 2) at zero wavenumber () and [8, 9], where the Galileo number, ( is the acceleration of gravity), gives the relative strengths of the stabilizing mechanisms of diffusion and gravity and thus determines which instability will form. For sufficiently thin, viscous liquid layers or small (e.g., microgravity), , so the long-wavelength mode should become the primary instability (see Fig. 2). This long-wavelength instability has not been experimentally investigated.
In this Letter we describe experimental observations of the onset of the long-wavelength instability and compare these observations to linear stability theory. The instability leads to a large-scale drained region with diameter 100. The qualitative features of the instability are compared to nonlinear theory based on a long- wavelength evolution equation. We also explore the competition between the long-wavelength and hexagonal instabilities and study the physical mechanism that selects which pattern will appear. For a range of liquid depths, both patterns coexist.
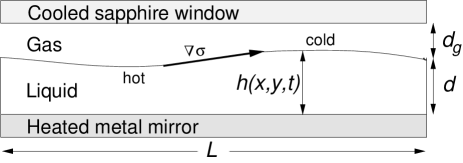

We study a thin layer of silicone oil that lies on a heated, gold-plated aluminum mirror and is bounded above by an air layer (see Fig. 1). A single-crystal sapphire window (0.3-cm-thick) above the air is cooled by a temperature-controlled chloroform bath. The temperature drop across the liquid layer is calculated assuming conductive heat transport [10] and is typically 0.5–5 ∘C. We use a polydimethylsiloxane silicone oil [11] with a viscosity of 10.2 cS at 50 ∘C. The circular cell (3.81 cm inner diameter) has aluminum sidewalls whose upper surface is made non-wetting with a coating of Scotchgard. The experiments are performed with 0.005 cm 0.025 cm and 0.023 0.080 cm (typically = 0.035 cm); the corresponding fundamental wavevectors are in the range 0.008 = 2 0.040 ( 1). The liquid layers are sufficiently thin that buoyancy is negligible [12]. The gap between the sapphire window and the mirror is uniform to 1%, as verified interferometrically. The liquid surface is initially flat and parallel to the mirror to 1% in the central 90% of the cell, with a boundary region near the sidewalls due to contact line pinning. This initial depth variation is accentuated by thermocapillarity as is increased; measurements of depth variation show a 10% surface deformation (in the central 90% of the cell) at 3% below onset. For visualization, we use interferometry, shadowgraph and infrared imaging (256 256 InSb staring array, sensitive in the range 3-5 m).
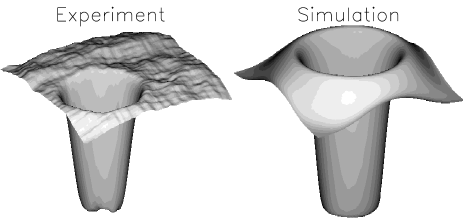
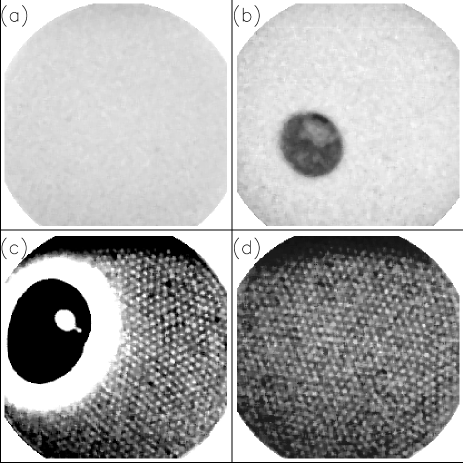
Above a critical , the liquid layer becomes unstable to a long-wavelength draining mode that eventually forms a dry spot [see Fig. 3(a)]. The drained region takes several hours (of order a horizontal diffusion time, ) to form. The dry spot is not completely dry since an adsorbed layer 1 m remains [13]. The size of the drained region is typically one quarter to one third the diameter of the entire cell.
Our measurements for the onset of instability are compared to the prediction of linear stability theory [9, 14, 15] in Fig. 4. The results are given in terms of the dynamic Bond number, , which is the relevant control parameter for the long-wavelength instability; is a measure of the balance between gravity’s stabilizing influence and thermocapillarity’s destabilizing effect. Figure 4 shows that the measured critical values of are independent of liquid depth and viscosity, as predicted by theory. However, in the experiment is 34% smaller than predicted. We do not believe this discrepancy is due to systematic errors in the characterization of our experiment (e.g., geometry, fluid properties) since experiments in the same convection cell using thicker liquid layers find onset of hexagons in agreement with another experiment [16] and linear stability theory [6].

The long-wavelength and the hexagonal modes become simultaneously unstable at a critical liquid depth . Near this critical depth, both modes of instability compete and influence the formation of the pattern. The two modes are not mutually exclusive, but there is a fundamental imbalance in their relationship: the presence of the hexagons suppresses the long-wavelength mode, while the presence of long-wavelength deformation may induce the formation of hexagons. Linear theory predicts = 0.023 0.001 cm; we observe the exchange of primary instabilities at = 0.025 0.001 cm. For this depth, hexagons are the primary instability [see Fig. 5(d)]; the hexagons smooth the large-scale temperature variations that would allow formation of the long-wavelength mode as a secondary instability when exceeds . For , the long-wavelength mode is the primary instability [see Fig. 5(b)]. The fluid expelled from the forming dry spot increases the local height and thus the local Marangoni number [] in the newly formed elevated region; for 0.017 cm , hexagons form in the elevated region since the local in this region exceeds (80) for the onset of hexagons [see Fig. 5(c)]. For 0.017 cm, hexagons do not form at the onset of the long-wavelength mode, but can form in the elevated region for sufficiently above onset. Similar mode competition phenomena have been studied theoretically for solutocapillary convection [17]. When , increasing above increases the area of the dry spot; no qualitatively new structures are observed. At fixed , the dry spot is stable.
To understand the long-wavelength instability more fully, we study a long-wavelength evolution equation derived by Davis[18, 19] for an insulating upper boundary and later considered by other authors [20, 21] for more general upper boundary conditions. The evolution equation for the local liquid depth (scaled by ) with an insulating upper boundary is
where the domain of both and is [0,2), time is scaled by , is the dynamic Bond number as before, and the static Bond number is . The first term in curly brackets describes the effect of thermocapillarity; the second, gravity; and the third, surface tension. A linear stability analysis of this equation agrees with the linear stability analysis of the full fluid equations referenced earlier. Numerically integrating the evolution equation in time using a pseudo-spectral code with periodic boundary conditions (which automatically satisfy the incompressibility condition), we find that when the system is unstable, an initially infinitesimal perturbation grows until it forms a dry spot, as shown in Fig. 3(b) ( = 1200 in the simulation, 700 in the experiment). Dry spots in the simulation do not saturate (unlike the observed spots), since the assumptions leading to the evolution equation are violated once the dry spot has formed; in this regime, the simulation quickly loses spectral convergence and breaks down. The shape of the dry spot near onset is independent of parameter values except for , which governs the size of the drained region. For large , sharp structures can form; for small , rounding by surface tension prevents the formation of sharp structures.
We find no stable, intermediate solution of the evolution equation between no deformation and a drained region. Our weakly nonlinear analysis of the evolution equation predicts a subcritical instability for all parameter values. We have performed one- and two-dimensional simulations as well as an analysis of the evolution equation to look for any turnover in the backwards unstable (subcritical) branch of the bifurcation. For an insulating upper boundary, we have shown analytically that no stable deformed solutions exist, in agreement with previous authors [21]. The unstable branch continues backwards until , at which point it disappears since the unstable solution past that point is unphysical (); nowhere does the backwards unstable curve turn over in a saddle-node bifurcation. Simulations using more general upper thermal boundary conditions [14] also find no stable deformed solutions.
In conclusion, we have observed the formation of a large-scale dry spot due to a long-wavelength deformational instability. The formation of such dry spots could be a serious problem in the planned use of liquid layers (even as thick as one centimeter) in microgravity environments, where fluid motion is driven primarily by surface tension gradients (buoyancy effects are negligible).
The structure of the dry spot agrees qualitatively with numerical simulations. Linear stability theory correctly predicts the functional dependence of the onset on experimental parameters, but the onset in the experiment occurs at (or ) 34% smaller than predicted by linear theory. This discrepancy in the onset may be due to the difference in lateral boundaries between theory and experiment. For example, all theory to date has assumed periodic boundary conditions, which become suspect when the wavelength of the mode under consideration is of order the system size. The long-wavelength evolution equation is not valid near a boundary and it is not clear what boundary conditions other than periodic might be used for the evolution equation. Future numerical simulations employing realistic, finite horizontal boundaries may answer this question.
We thank S. H. Davis, R. E. Kelly, and E. L. Koschmieder for useful discussions. This research is supported by the NASA Microgravity Science and Applications Division (Grant No. NAG3-1382). S.J.V.H. is supported by the NASA Graduate Student Researchers Program.
REFERENCES
- [1] Electronic mail: svanhook@chaos.ph.utexas.edu
- [2] Electronic mail: schatz@chaos.ph.utexas.edu
- [3] Electronic mail: swinney@chaos.ph.utexas.edu
- [4] H. Bénard, Rev. Gén. Sci. Pure Appl. 11, 1261 (1900).
- [5] M. J. Block, Nature 178, 650 (1956).
- [6] J. R. A. Pearson, J. Fluid Mech. 4, 489 (1958).
- [7] L. E. Scriven and C. V. Sternling, J. Fluid Mech. 19, 321 (1964).
- [8] K. A. Smith, J. Fluid Mech. 24, 401 (1966).
- [9] M. Takashima, J. Phys. Soc. Japan 50, 2745 (1981). D. A. Goussis and R. E. Kelly, Int. J. Heat Mass Trans. 33, 2237 (1990). C. Pérez-García and G. Carneiro, Phys. Fluids A 3, 292 (1991).
- [10] E. L. Koschmieder and M. I. Biggerstaff, J. Fluid Mech. 167, 49 (1986).
- [11] We use a silicone oil that has been distilled once to remove low vapor pressure components, which can condense on the cool, upper plate [see M. F. Schatz and K. Howden, Exp. Fluids (to appear)]. Infrared images are made using a mixture of 90% silicone oil and 10% 20 cS (at 50 ∘C) infrared-absorbing (4.61 m) polymethylhydrosiloxane silicone oil.
- [12] Surface tension is the dominant driving force when , where the Rayleigh number is and is the volume coefficient of expansion. [See S. H. Davis and G. M. Homsy, J. Fluid Mech. 98, 527 (1980).] Buoyancy is negligible in our experiments since .
- [13] J. P. Burelbach, S. G. Bankoff and S. H. Davis, Phys. Fluids A 2, 322 (1990).
- [14] This assumes an insulating upper boundary. The more general case is , where the Biot number characterizes the thermal properties of the liquid-gas interface. In the long-wavelength limit, , where and are the thermal conductivities of the liquid and gas, respectively [see L. Hadji, J. Safar and M. Schell, J. Non-Equilib. Thermodyn. 16, 343 (1991)]. ranges from 0.01 to 0.08 in our experiments. Values in Fig. 4 include the correction factor [that is, they are ]. The pattern and the topology of the bifurcation diagram are independent of .
- [15] These results are for an infinite system. A finite system has a lowest order mode of = 2, which becomes unstable at a slightly higher (6%) value of the control parameter. We do not include this correction in Fig. 4.
- [16] M. F. Schatz, S. J. VanHook, W. D. McCormick, J. B. Swift and H. L. Swinney, submitted to Phys. Rev. Lett.
- [17] A. A. Golovin, A. A. Nepomnyashchy and L. M. Pismen, Phys. Fluids 6, 34 (1994).
- [18] S. H. Davis, in Waves on Fluid Interfaces, edited by R. E. Meyer (Academic Press, New York, NY, 1983), p. 291.
- [19] S. H. Davis, Annu. Rev. Fluid Mech. 19, 403 (1987).
- [20] B. K. Kopbosynov and V. V. Pukhnachev, Fluid Mech. Sov. Res. 15, 95 (1986).
- [21] A. Oron and P. Rosenau, J. Phys. II (France) 2, 131 (1992).