D-35392 Giessen, Germany
On the current status of OZI violation in and reactions††thanks: Supported by Forschungszentrum Jülich
Abstract
The available data on and production from and collisions are reanalyzed with respect to an OZI rule violation on the basis of transition matrix elements. The data are found to be compatible with a constant ratio , which however, deviates substantially from the SU(3) prediction based on the present knowledge of the mixing angle.
pacs:
12.10.KtUnification of couplings and 12.40.VvVector-meson dominance and 13.75.CsNucleon-nucleon interactions and 13.75.GxPion-baryon interactions1 Introduction
Assuming the ideal SU(3) octet-singlet mixing Okubo, Zweig and Iizuka proposed Okubo ; Zweig ; Iizuka that the production of a -meson from an initial non-strange state is strongly suppressed in comparison to -meson production. Indeed, because of SU(3) breaking the octet and singlet states are mixed and for an ideal mixing angle the -meson is a pure state. In case of production from , or reactions the OZI rule states that the contribution from the diagram with a pair disconnected from the initial should ideally vanish. The experimental deviation from the ideal mixing angle =3.70 PDG can be used Lipkin to estimate the ratio of the cross sections with a and in the final state. This deviation of the experimental ratio from zero is denoted as OZI rule violation. A large ratio might indicate an intrinsic content of the nucleon since in that case the -meson production is due to a direct strangeness transfer from the initial to the final state and thus OZI allowed.
The OZI violation problem has lead to a large experimental activity involving different hadronic reactions. Here we perform a systematical data analysis for and reactions and discuss their theoretical interpretation in context with the most recent data point from the DISTO Collaboration Balestra .
2 and production in reactions
Without involving any theoretical assumption about the production mechanism the data LB on the total and cross sections may be analyzed in terms of the corresponding transition amplitudes. The amplitude for a two-body reaction with stable particles in the final state is related to the total cross section as Feynman
| (1) |
where , while , , denote the nucleon, pion and vector meson masses, respectively, and is the squared invariant collision energy. Moreover, we compare the transition amplitudes for and production at the same excess energy . As was discussed in Ref. Hanhart , Eq. (1) can be used for the evaluation of the amplitudes for the production of unstable ( and ) mesons at excess energies , where denotes the width of the vector meson spectral function due to its vacuum decay.
Furthermore, due to the experimental set up the data from Ref. Karami should not be considered as total cross sections, but as differential cross sections integrated over a given range of the final neutron momentum Hanhart . Indeed, the cross sections given in Ref. Karami for different intervals of neutron momenta in the center-of-mass system can be related to the transition amplitude as
| (2) |
where and are the proton and neutron masses, respectively, and is given as a function of . Eq. (2) agrees with that in Ref. Hanhart in the non-relativistic limit. Furthermore, in the calculations we use the set of the neutron momentum intervals as in Ref. Karami .
Figs. 1,2 show the transition amplitudes for the and reactions evaluated from the experimental data LB ; Karami . Note, that the transition amplitude evaluated from the data of Ref. Karami (full dots at small ) by Eq. (2) does not depend on energy within the errorbars and agrees well with that extracted from the other data LB .
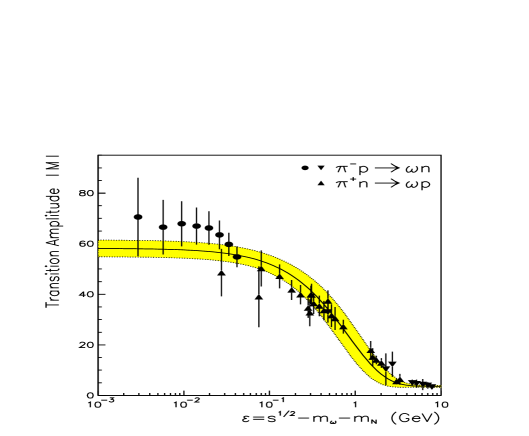
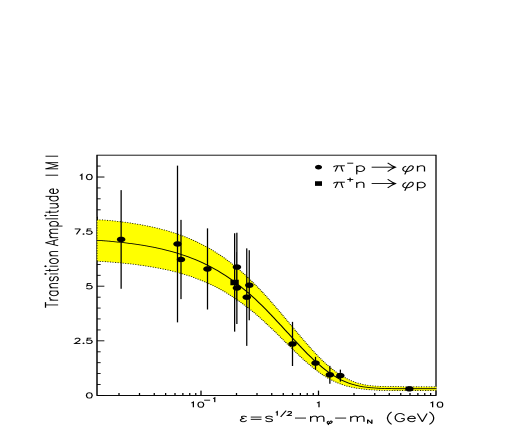
Since the data are not available for a comparison at exactly the same excess energies we fit the transition amplitudes by the function
| (3) |
with the parameters given in Table 1. The solid lines in Figs. 1, 2 show the approximation (3) while the dashed areas indicate the uncertainty of the parameterization. Note, that the approximation is compatible with an almost constant transition amplitude for 100 MeV and reasonably reproduces the experimental results up to 10 GeV.
| Reaction | |||
|---|---|---|---|
| 3.6 | 54.6 | 1.21 | |
| 0.31 | 6.96 | 1.83 | |
| - | 37.7 | 0.27 |
The resulting ratio of the to transition amplitudes is shown in Fig. 3a) by the solid line as a function of the excess energy . It is important to note that the ratio is almost constant within the given uncertainties up to 10 GeV, where the data are available.
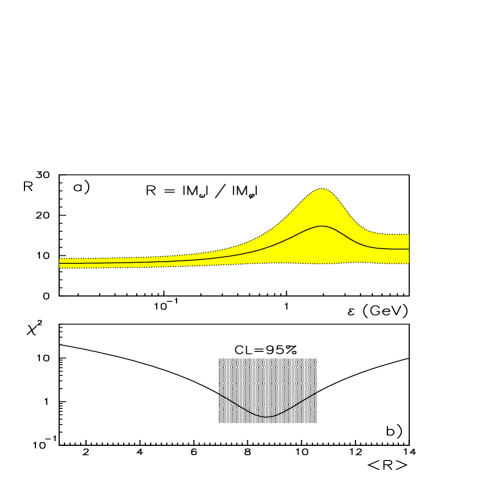
Since the ratio is always discussed as a constant, that is compared to the SU(3) predictions, we calculate the average value of in the range GeV. Fig. 3b) shows the reduced as a function of the constant , which approaches a minimum at
| (4) |
with the dispersion given for a 95% confidence level.
Furthermore, a visual way to control our estimate for is to compare the experimental data directly by multiplying the amplitude by the factor as shown in Fig. 4. We note that four experimental points for the reaction around 1 GeV deviate by a factor of 1.8 from the hypothesis applied. New experimental data with high accuracy are obviously necessary for a final conclusion about the ratio of the and reaction amplitudes.

3 and production in reactions
In our normalization the total cross section for the production of an unstable meson with total width is given as
| (5) | |||||
where is the minimal mass of the unstable particle and describes the final state interaction (FSI) between the nucleons Watson ; Migdal ; GellMann ; Taylor .
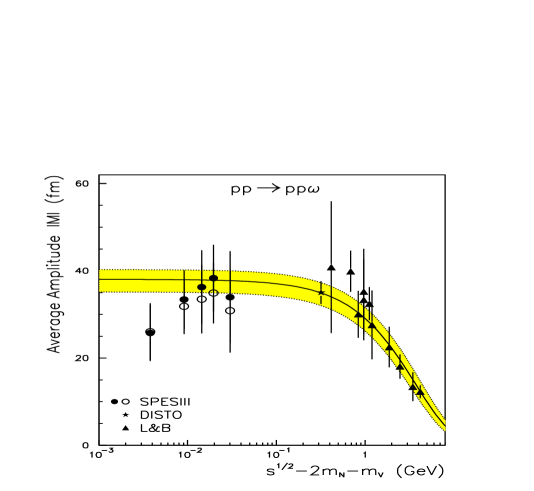
Fig. 5 shows the average production amplitude for the reaction evaluated by Eq. (5) from the data LB ; Hibou using the FSI models from Refs.DKT ; SC1 111A comparison between the different models for the final state interaction is presented in Refs.SC1 ; SC2 . We note that the uncertainty in the evaluation of the production amplitude due to the different models of the FSI corrections is substantially smaller than the dispersion of the experimental results.
The reaction amplitude evaluated from the data LB ; Hibou is approximated by the function (3) with parameters given in Tab. 1 and is shown in Fig.5 by the solid line. The dashed area in Fig.5 indicates again the uncertainty of the approximation which was calculated with the error correlation matrix.
Recently the DISTO Collaboration reported an experimental result Balestra on the ratio of the and total cross section at a beam energy of 2.85 GeV. For the further analysis we need the -meson production cross section explicitly, which can be obtained by normalization to the available data on -meson production LB ; Hibou . Our extrapolation for the production amplitude at 2.85 GeV is shown in Fig.5 by the star and provides
| (6) |
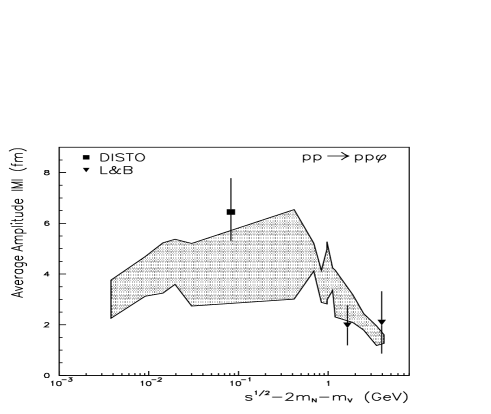
Now the DISTO data point Balestra for the total cross section can be used for the evaluation of the reaction amplitude. Fig. 6 shows the experimental results for the average production amplitude as a function of the excess energy. Since there are only three experimental points we cannot perform a statistical analysis of the / ratio similar to the analysis. Note that the data are available only for 80 MeV, where the FSI enhancement as well as the correction due to the final -meson width almost play no role.
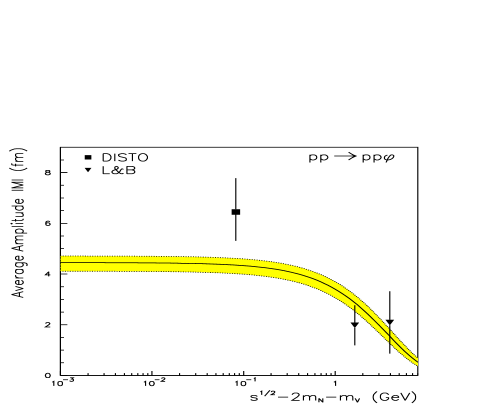
Now, to compare the data one might take the ratio of the and amplitudes as a constant. The two experimental points at high energy give a ratio 8.5. Fig. 6 shows the production amplitude together with the experimental results divided by the factor 8.5. To illustrate the -dependence the data are simply connected by upper and lower lines through their error bars. Fig.7, furthermore, shows the data for the production amplitude using the fit (3) for the amplitude again divided by the factor 8.5. Here the DISTO data point sticks out from the error band to some extent. However, it is not clear if one might take the / ratio as independent on . As we already demonstrated for the and reactions, the / ratio substantially depends on the excess energy for 300 MeV. In this sense, the DISTO result does not strictly contradict the data available at high energy.
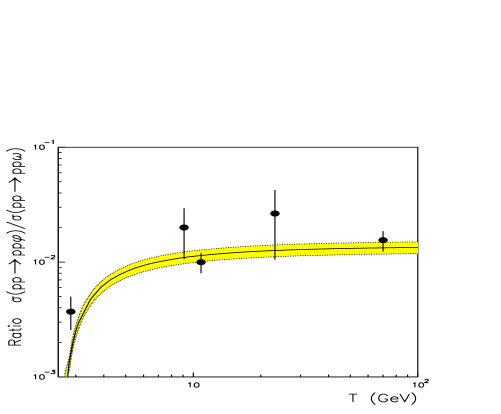
Furthermore, since additional experimental results Arenton ; Golovkin are available for the ratio of the / total or differential cross sections above 8 GeV bombarding energy, we also show this ratio calculated with Eq.(5) in Fig.8 as a function of the incident proton energy.
We have performed a fit to the available data on the ratio of the and cross sections with a constant ratio of the / production amplitude and obtained the value of 8.51.0. Here the error is due to the parent standard deviation. The confidence level of the fit is below 50%. Again the DISTO result is not consistent with the constant ratio /=8.5. We mention that the DISTO result on -meson production can be fixed by /=5.72 with the amplitude taken from the approximation (3).
4 Theoretical interpretations
In general Ellis the experimental results on the ratio are compared to a constant as given by Lipkin Lipkin ,
| (7) |
where PDG is the deviation from the ideal mixing angle. It is important to note, that Eq. (7) provides the ratio for hadronic reactions which can be expressed by the diagrams shown in Fig. 9 that contain the and vertices.

Furthermore, the ratio of the to coupling constant can be evaluated from the relevant partial decay width Sakurai1 ; GellMann1 . The coupling constant can be measured (as first proposed by Sakurai Sakurai1 ) by the decay via
| (8) | |||||
Taking into account the energy dependence of the -meson width and experimental numbers from the PDG PDG we obtain as shown in Table 2.
| Vertex | Source | Constant |
|---|---|---|
The separate decay is not energetically allowed and to determine the coupling constant Gell-Mann and Zachariasen GellMann1 proposed to study the radiative decays and . In their approach (see also the review of Meißner Meissner ) this process is dominated by the vertex with the intermediate vector meson coupled to the photon via vector dominance. The coupling constant can be measured by GellMann1 ; Kaymakcalan ,
| (9) |
where is the fine structure constant. Furthermore, a direct measurement of is possible by means of the vector meson decay into leptons Nambu
| (10) |
where and are the masses of the vector meson and lepton, respectively. In a similar way can be measured via the decay. The relevant coupling constants obtained with the latest PDG fit to experimental data are listed in Table 2.
On the other hand, Gell-Mann, Sharp and Wagner GellMann2 proposed to determine through the decay assuming that the first converts into followed by . The relation between the and coupling constants is given in Ref. Lichard . A more elaborate analysis of the decay includes the four-point contact term due to the direct coupling between the -meson and three pions Meissner ; Klingl1 ; Kaymakcalan , however, the contribution from this anomalous coupling to is only about 10%. The analysis from Refs. Klingl1 ; Klingl2 provides .
Note that the mixing angle can also be determined by the ratio of the and radiative decay widths by applying vector dominance (9), which gives = 12.90.4. An alternative model Meissner ; Klingl1 ; Meissner2 proposed a direct coupling, instead of the vector dominance, where the ratio of to yields . Both models predicts values close to the mixing angle , determined from the mass splitting in the vector-meson nonet, but depend on the vector dominance or direct coupling assumption. The direct decay is a more standard way, although it leads to a rather large uncertainty in the determination of the coupling.
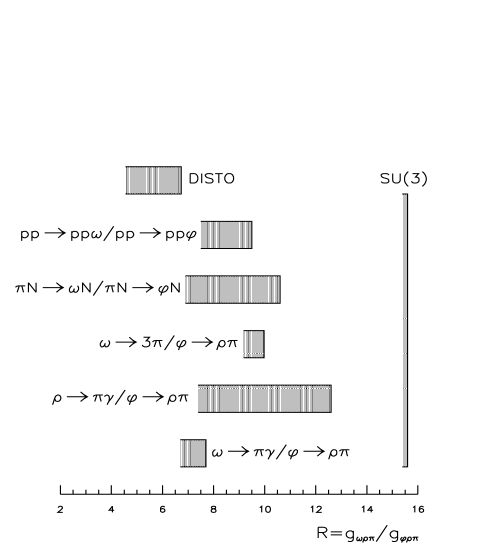
To provide a graphical overview, Fig. 10 illustrates the ratio of the and coupling constants evaluated from the partial decay width. We also show the ratio given by the and data assuming that this ratio is energy independent. The DISTO result is shown separately and – as discussed above – is not consistent with the other data for reactions. However, within the present uncertainties the experimental results – as evaluated from all different sources – appear to be compatible; they all disagree with the SU(3) estimate based on the as given by the PDG PDG .
We note, furthermore, that any production mechanism different from those in Fig. 9 will invalidate the overall scaling based on the function Nakayama2 ; Nakayama1 . For instance, as found in Refs. Locher ; Buzatu1 ; Mull ; Buzatu2 ; Gortchakov ; Anisovich ; Markushin , two-step processes with intermediate , states may contribute substantially to production in antiproton-proton annihilation. Certainly, such OZI allowed processes could have also an effect on -meson production in and reactions, but their actual contribution so far is unknown here. In view of Fig. 3a we speculate that their contribution should be rather low for excess energies 300 MeV.
5 Summary
We have analyzed the experimental data available for and -meson production from and reactions and have evaluated the ratio of the reaction amplitudes. Indeed the experimental / ratio substantially deviates from the SU(3) estimate , which is based on the mixing angle of =390.
However, it is important to recall that this SU(3) estimate is given by the ratio of the to and to coupling constants and is related only to the reaction mechanisms involving the relevant and vertex. Obviously, any other production mechanism Locher ; Buzatu1 ; Mull ; Buzatu2 ; Gortchakov ; Anisovich ; Markushin as well as different form factors in the and vertices will lead to a deviation of the experimental ratios from the simple scaling .
On the other side, by fitting the experimental ratio with a constant, our comparison of the and data with the ratio of the and coupling constant (as evaluated from the measured partial decay) shows an overall compatibility. The full analysis indicates that – within the experimental uncertainties – the data on the partial decays as well as on and reactions provide an average ratio , which is close to the DISTO data point, however, disagrees with the SU(3) estimate based on the mixing angle of =390.
Acknowledgements.
We appreciate valuable discussions with W. Kühn and J. Ritman as well as comments and suggestions from C. Hanhart and J. Haidenbauer.References
- (1) S. Okubo, Phys. Lett. 5, (1963) 165.
- (2) G. Zweig, CERN report TH-401 (1964).
- (3) J. Iizuka, Prog. Theor. Phys. Suppl. 38, (1966) 21
- (4) Particle Data Group, Eur. Phys. J. C 3, (1998) 1.
- (5) H.J. Lipkin, Phys. Lett. B 60, (1976) 371.
- (6) F. Balestra et al., Phys. Rev. Lett. 81, (1998) 4572.
- (7) Landolt-Börnstein, New Series I/12 (Springer, 1998).
- (8) R.P Feynman, Theory of Fundamental Processes ( W.A. Benjamin Inc., New York, 1962).
- (9) C. Hanhart, A. Kudryavtsev, nucl-th/9812022
- (10) H. Karami et al., Nucl. Phys. B 154, (1979) 503.
- (11) K.M. Watson, Phys. Rev. 88, (1952) 1163.
- (12) A.B. Migdal, JETP 1, (1955) 2.
- (13) M. Gell-Mann and K.M. Watson, Ann. Rev. Nucl. Sci. 4, (1954) 219.
- (14) J.R. Taylor, Scattering Theory (Willey, New York, 1972).
- (15) F. Hibou et al., nucl-ex/9903003.
- (16) B.L. Druzhinin, A. Kudryavtsev, and V.E. Tarasov, Z. Phys., A 359, (1997) 205.
- (17) A. Sibirtsev and W. Cassing, nucl-th/9904046.
- (18) A. Sibirtsev and W. Cassing, Eur. Phys. J. A 2, (1998) 333.
- (19) M.W. Arenton et al., Phys. Rev. D 25, (1982) 2241.
- (20) S.V. Golovkin et al., Z. Phys. A 359, (1997) 435.
- (21) J. Ellis et al., Phys. Lett. B 353, (1995) 319.
- (22) J.J. Sakurai, Phys. Rev. Lett. 9, (1962) 472.
- (23) M. Gell-Mann and F. Zachariasen, Phys. Rev. 124, (1961) 953.
- (24) Ulf-G. Meißner, Phys. Rep. 161, (1988) 213.
- (25) Ö. Kaymakcalan, S. Rajeev and J. Schechter, Phys. Rev. D 30, (1984) 594.
- (26) Y. Nambu and J.J. Sakurai, Phys. Rev. Lett. 8, (1962) 79.
- (27) M. Gell-Mann, D. Sharp and W.G. Wagner, Phys. Rev. Lett. 8, (1962) 261.
- (28) P. Lichard, Phys. Rev. D 49, (1994) 5812.
- (29) F. Klingl, N. Kaiser and W. Weise, Z. Phys. A 356, (1996) 193.
- (30) F. Klingl, private communication.
- (31) P. Jain et al., Phys. Rev. D 37, (1998) 3252.
- (32) K. Nakayama et al., nucl-th/9904040.
- (33) K. Nakayama et al., Phys. Rev. C 57, (1998) 1580.
- (34) M.P. Locher, Y. Lu and B.S. Zou, Z. Phys. A 347, (1994) 281.
- (35) D. Buzatu and F.M. Lev, Phys. Lett. B 329, (1994) 143.
- (36) V. Mull, K. Holinde and J. Speth, Phys. Lett. B 334, (1994) 295.
- (37) D. Buzatu and F.M. Lev, Phys. Rev. C 51, (1995) 2893.
- (38) O. Gortchakov, M.P. Locher, V.E. Markushin and S. von Rotz, Z. Phys. A 353, (1996) 447.
- (39) A.V. Anisovich and E. Klempt, Z. Phys. A 354, (1996) 197.
- (40) V.E. Markushin and M.P. Locher, Eur. Phys. J. A 1, (1998) 91.