JYFL 98–11;
TPR–98–20
Sensitivity of electromagnetic spectra to equation
of state and initial energy density in the Pb+Pb collisions at
SPS
Abstract
We study Pb+Pb collisions at 158 GeV/ using a hydrodynamical
approach. We test different equations of state (EoSs) and different
initial conditions and show that there are more than one initial state
for each EoS which reproduce the observed hadronic spectra. We also
find that different equations of state favour different freeze-out
temperature. Simultaneously we calculate the thermal dilepton and
photon spectra for each EoS and initial state. We compare the dilepton
mass spectrum to data measured by the CERES collaboration and find
that the differences in spectra obtained using different EoSs and
initial states are not resolvable within the current experimental
resolution. However, at invariant masses over 2 GeV the difference
in the yield due to various initial states is close to an order of
magnitude. We also study the rapidity distribution of lepton pairs
and find that for masses around 800 MeV the shape of the distribution
depends strongly on the EoS.
PACS number(s): 25.75.-q, 12.38.Mh, 12.40.Ee, 47.75.+f
, and
1 Introduction
One aim in the field of relativistic heavy ion collisions is to study the dynamics of the collisions and try to give reliable estimates about the achieved energy density with the intention to relate this density to the phase transition density of the quark-gluon plasma. The dynamics of these collisions can only be studied by models which are tested by comparing to the various experimental data. There is a big effort from the experimental groups to measure as many observables as possible, like single hadron spectra, correlation functions, photon spectra and dilepton spectra.
The subset of hadronic spectra gives a reliable estimate only of the final state at decoupling. Concluding the final state from the spectra of one particle species only is not possible because there is an ambiguity between the freeze-out temperature and the collective flow velocity [1]. There are methods to overcome this ambiguity by analyzing transverse momentum spectra of particles with very different masses [2], study the coalescence of various small nuclei and anti-nuclei [3] or do an HBT analysis [4, 5]. All these methods help to determine more precisely the final state of a heavy ion collision but they do not tell anything about the dynamics producing the final state.
Dynamical models like hydrodynamics or event generators are first of all tested against the final state. However, reproducing the final state does not mean that the dynamics before the final state is reasonable. Electromagnetic probes are emitted during the whole hot and dense stage of a heavy ion collision. Therefore they are observables which may help to distinguish between different evolution scenarios which reproduce the final state. The main goal of our study is to use electromagnetic spectra to test different hydrodynamical scenarios which reproduce the final hadronic state in a physically motivated but still approximative way. Similar studies [6, 7, 8, 9, 10, 11, 12, 13, 14, 15, 16, 17, 18, 19, 20] have already been performed, but mostly for S+Au collisions. Here we concentrate on Pb+Pb(Au) collisions and study the effects of the uncertainty in the initial energy density.
In hydrodynamical models the differences in equation of state (EoS) can be compensated by the choice of the initial conditions. There are also several different initial conditions for each EoS which lead to comparable results concerning single hadron spectra. Here we first construct two such initial conditions for three different EoSs and then investigate the power of single photon spectra, low mass dielectrons, and intermediate mass dimuons to differentiate between these different cases.
2 Equation of state
A necessary ingredient for the hydrodynamic calculation is the equation of state. The sensitivity of electromagnetic emission to the EoS arises in two different ways. First, the properties of the quanta of the matter affect the rate at given temperature and second, the expansion timescale and temperature profile depend on the EoS. Typically an EoS with less degrees of freedom leads to higher temperatures but also to faster cooling than in the case of large number of degrees of freedom. To see these differences we investigate three EoSs with different phase transition temperatures. In the case of EoS H we assume the matter to remain in the form of hadrons without plasma formation even at highest densities. In the case of EoS D a first order phase transition occurs at MeV at zero net baryon number density and in case A the phase transition temperature is MeV.
In [18] we have given a detailed description of how a bag model type equation of state is calculated from given input parameters. In our case these input parameters are the hadron and parton degrees of freedom, the bag constant , and a mean field repulsion characterized by the coupling of the baryons to the net baryon number density . Unlike in our previous papers [18, 21, 22] we now include all the hadrons up to 2 GeV mass listed in Particle Data Book [23] for constructing the hadronic part of the EoS while the QGP part is unchanged. We then obtain the values (EoS A) and 200 MeV (EoS D) with the mean field parameter MeV and and 264 MeV, respectively. In case of EoS H we have MeV.
3 Initial conditions


At low energies a hydrodynamical description of the whole collision, including also the initial compression and heating of the nuclear matter is feasible. At the SPS energy range nuclear transparency is already present and the physical picture of compressing fluids does not apply. On the other hand the main entropy production phase becomes of order 1–2 fm/, considerably less than the total time interval of secondary interactions, 10 fm/. It is then reasonable to consider the production and the expansion separately. The simplest approach, which we adopt, is to assume that the initially produced particles quickly form a thermal system and to parametrize it in terms of densities and fluid velocity.
We have presented our model for parametrizing the initial state in terms of local nuclear thickness in refs. [21, 22]. Our parametrization gives energy and baryon number distributions in rapidity space, which leaves us the freedom to change the initial spatial distributions by changing the initial velocity profile. A velocity profile where rapidity has a linear -dependence [21, 22] leads to spatial energy distribution which is peaked in the middle of the system (fig. 1, solid line). To make the energy distribution less peaked we change the velocity profile to have a smaller slope at small and deeper slope at larger (fig. 1, dashed line). This way we shift initial thermal energy to initial kinetic energy. The volume of the fireball inside the freeze-out surface stays unchanged which ensures that the states can not evolve to each other but are genuinely different. To reproduce the hadronic data the use of the new velocity profile requires less stopping compared to the former linear profile in .
| IS 1 | IS 2 | |||||
| EoS A | EoS D | EoS H | EoS A | EoS D | EoS H | |
| (GeV/fm3) | 10.2 | 10.3 | 10.3 | 5.0 | 5.3 | 5.3 |
| (fm-3) | 1.1 | 1.0 | 1.0 | 0.59 | 0.59 | 0.59 |
| (MeV) | 255 | 258 | 234 | 214 | 220 | 213 |
From now on we refer to these different initial states as IS 1 and IS 2 meaning a state with a peaked energy distribution and a state with a wide energy distribution respectively (see fig. 1). The velocity profiles are the same for all EoSs but the energy density and baryon number distributions vary slightly to fit the data. However the shapes of the distributions are as depicted in fig. 1 for all the EoSs. Resulting average densities and temperature in the central region of the fireball are listed in table 1.
4 Emission rates
The spectra of dileptons and photons are calculated using thermal emission rates for the different phases. In QGP we use the lowest order rates both for the lepton pairs [24] and photons [25]. For photons the screening of the quark mass singularity through the resummation of hard thermal loops in the quark propagator is included [25]. For lepton pairs with masses greater than the temperature, next to leading order corrections are not very significant. At small masses they become large [26, 27] but the rate is then much below those from other sources.
In the hadron gas many different processes contribute. These have been considered by Gale and Lichard [28] for interactions among vector and pseudoscalar mesons and the authors have provided us with their numerical result. Since the vector mesons are included in the form factors in the cross sections, e.g. the pole in the annihilation to lepton pairs, their decays during the thermal stage are not counted separately. At intermediate masses the process is also important. Gale and Li [29] calculated the production rates in the hadron gas including this process. The rates due to process were calculated in three different ways. Those calculated assuming that the electromagnetic form factor is represented by the only give the best fit to the data [29]. Therefore we use those rates, provided kindly by C. Gale, at masses above 1 GeV. The use of the largest production rates presented in [29] would enhance the thermal dilepton production in our calculations at largest by a factor 1.5 at 1.5 GeV mass. Below 1.2 GeV and above 2.5 GeV masses the difference is negligible.
The photon emission in the hadron gas was calculated in ref. [30] using a pseudoscalar-vector Lagrangian to describe the interactions among the mesons. A useful parametrization of the rates is given in ref. [31]. An important contribution from the channel involving the formation and decay of the axial vector meson [32] is also included. As for the lepton pairs, rates from processes involving baryons are not included.
Given the local emission rates we can calculate the total emission in a nucleus-nucleus collision by folding the rates with the flow. E.g. for lepton pairs we have
| (1) |
where is the energy of the pair in the local rest frame of the fluid element with four-velocity . The emission rate per unit volume and time is and is the fraction of plasma phase at space-time point . In the QGP , in the hadron gas and in the mixed phase .
5 Results
5.1 Hadron spectra
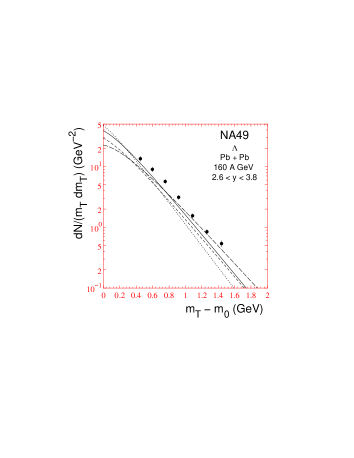
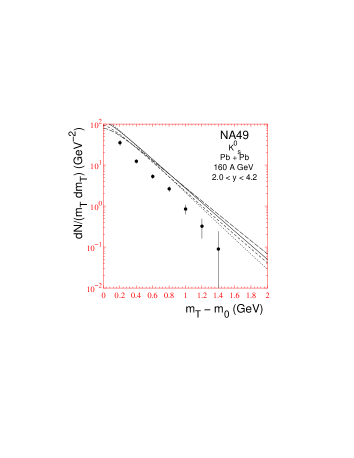
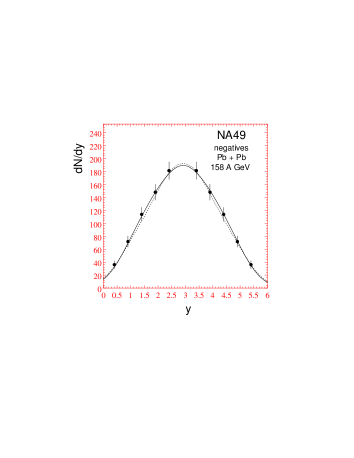
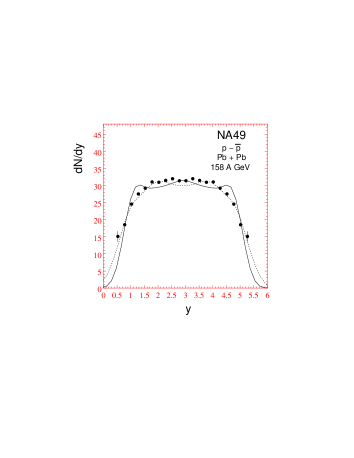
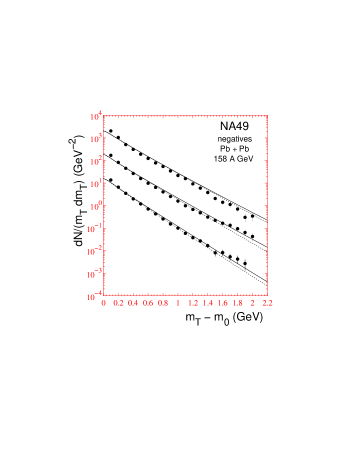
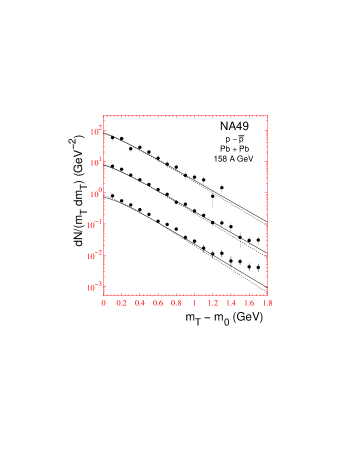
Hadron spectra have already been studied in more detail by several groups [5, 16, 22, 33, 34] within the local hydrodynamical model. In ref. [22] we have discussed the hadron spectra for collisions measured at CERN. As new features we consider here the effects of freeze-out and phase transition temperatures on the spectra of negative particles and net protons. We also study whether different initial conditions may lead to an adequate description of hadronic spectra. Particle spectra are calculated using the prescription of Cooper and Frye [35] including the same hadrons as in the construction of the equation of state. In Cooper’s and Frye’s prescription an important notion is the freeze-out surface separating the regions where particles behave as hadron gas and as free particles. Freeze-out takes place where the mean free path of particles is of the same order than the size of the fireball. For the collisions of light nuclei this criterion leads to a freeze-out temperature of MeV [36]. However, it has been suggested recently that a freeze-out temperature of MeV would be more appropriate for a Pb+Pb collision [2, 4, 37]. Instead of having the freeze-out to take place at constant temperature, we define the freeze-out on a space-time surface of constant energy density. As a freeze-out energy density we use GeV/fm3 and GeV/fm3 which result in an average freeze-out temperature of MeV and MeV, respectively.
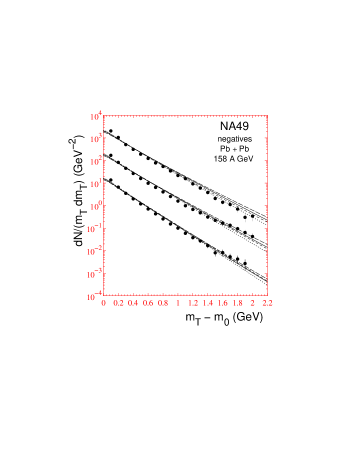
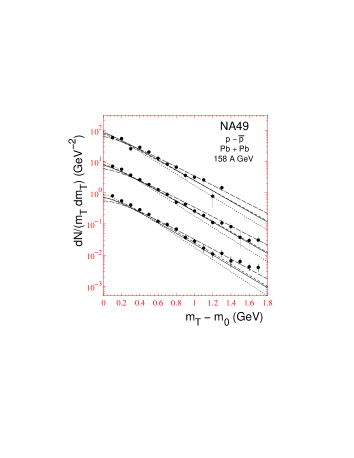
The effect of the freeze-out temperature on transverse momentum spectra can be seen in fig. 2 where we show the spectra of negative particles, net protons, lambdas and neutral kaons using decoupling temperatures MeV and MeV. The spectra are obtained using EoSs A and D and initial state IS 1. The effect of the freeze-out temperature is similar when initial state IS 2 is used. Lower freeze-out temperature leads to stronger flow but for light particles this effect is counterbalanced by the decrease in temperature. Therefore the spectra of negative particles, mostly pions, are almost unaffected by the change in freeze-out temperature. The difference in slope constant , defined in the same way as for the data in [38], is about 10 MeV for all EoSs and both initial conditions. On the other hand heavier protons gain more from the increased flow velocity than they lose with decreasing temperature. The lower freeze-out temperature leads to 30–45 MeV larger slope constants than MeV (see table 2). Comparing with data the 120 MeV freeze-out temperature produces better fits than MeV when EoS A is used. However, EoS D is stiffer than EoS A, which leads to larger flow velocity. Therefore the spectra obtained using EoS D and MeV are very close to those obtained using EoS A and MeV whereas the combination of EoS D and MeV produces slightly too large flow.
The particle abundances in heavy ion collisions and thus the normalization of the spectra are an interesting field of research of its own. The thermal model applied to particle ratios and abundances gives usually reasonable results but much higher temperatures of order 160–180 MeV [40, 41]. The difference to the 120–140 MeV freeze-out temperature used here may be explained by a separation of the chemical freeze-out where particle ratios are frozen from the kinetic freeze-out where the shape of the spectra is determined. For technical reasons it is very hard to separate these decoupling scales in a hydrodynamical simulation. Therefore we assume chemical equilibrium down to the kinetic freeze-out. The price we pay is that the normalizations of other particles than pions and nucleons may come out wrong. As an example we show the and K -spectra in fig. 2 for the sake of comparison. While the slope comes out approximately right, the normalization is off as been expected. The slopes of the kaon and lambda spectra depend on the EoS and freeze-out energy density in the same way than for pion and net proton spectra: the combination of EoS D and MeV on one hand and EoS A and MeV on the other produces slopes which are closest to the experimental ones.
| NA 49 [38] | ||||
|---|---|---|---|---|
| MeV | 315 | 318 | 310 | |
| EoS D | MeV | 273 | 275 | 268 |
| MeV | 280 | 277 | 274 | |
| EoS A | MeV | 247 | 243 | 239 |
As an example of the effect of the initial conditions to the spectra we show in fig. 3 the resulting rapidity and spectra of negative particles and net protons for initial states IS 1 and IS 2. In both cases the equation of state is EoS D and freeze-out temperature MeV. For the negative particles the calculations are in good agreement with the data, which tells that two different initial conditions can result in almost similar flow of energy density across the freeze-out surface. However, the hydrodynamical evolution does not smooth away all differences of the initial conditions since the rapidity spectrum of net protons still shows some signs of different initial stopping of baryons and flow in these two cases. As one may expect the larger initial energy density and thus greater pressure leads to stronger transverse flow, but the effect is small. The difference in slope parameter is 10–15 MeV for net protons and about 10 MeV for negative particles.
Also when EoSs A and H are used, the spectra obtained using initial states IS 1 and IS 2 are very close to each other. The differences in the slope parameter are similar to those described in the case of EoS D. When EoS H without phase transition to quark-gluon plasma is used, the resulting spectra differ only slightly from those obtained using EoS D. The slope parameters of the net proton spectra are 10–15 MeV larger for EoS H than for EoS D. For negative particles the differences in the slope parameters are below 5 MeV. The initial state and hadron spectra are almost identical for EoS D and H because in both cases the hydrodynamical evolution is dominated by the hadronic part of the EoS. Plasma and mixed phase last too short a time and occupy too small a volume to affect the flow considerably.
Independently of initial state the best fit is obtained combining EoS A with MeV and either EoS D or EoS H with MeV. We conclude that the initial state of a hydrodynamic description is not unambiguous even for a given EoS. Different initial conditions can lead to an acceptable description of the data if the densities and the velocity profile are correlated carefully.
5.2 Photons
Unlike hadrons, photons are emitted during the whole lifetime of the fireball and may thus carry information from the hot and dense stage of the collision. Since we found in the previous section that using different freeze-out temperature for different EoSs gave the best fit to the data, we use from now on EoS A with MeV and EoSs D and H with MeV. In fig. 4 we show direct photon spectra for three different EoSs and for initial states IS 1 (upper three lines) and IS 2 (lower three lines scaled down by ). In the case of EoS A and IS 1 the contribution from the plasma phase dominates at GeV/ resulting in a distinctive concave shape of the spectrum. When EoS D with higher phase transition temperature is used together with IS 1, the contribution from the hadron gas dominates up to GeV/ and the shape of the spectra turns concave at larger transverse momenta. Our results are very similar to those presented in [15], especially for EoS A, whereas the photon yield presented in [16, 19] is in the case of a phase transition much smaller at large values of than our result. This is due to the smaller initial temperature and the use of boost invariant hydrodynamics in [16, 19], which leads to weaker transverse flow than our approach.

For the initial state IS 2 the photon emission at GeV/ is very close to that obtained using IS 1, but the difference increases rapidly with . At larger values of the emission is dominated by the early, hot stage of the evolution. Therefore decreasing initial temperature cuts the emission accordingly. This can be seen very clearly when EoS A is used. Even if the lifetime of the plasma phase is almost equal in both cases, the drop in initial temperature causes one order of magnitude change in photon yield when GeV/ and the clearly concave shape has almost vanished. For EoS D and H the effect is smaller. At high values of transverse momenta the photon yield is changed by a factor of 6 or 4 respectively. Thus the effect of initial densities on photon emission at high values of depends on the EoS.
Because the photon emission rate in the hadron gas is larger than in the plasma, the photon yield is the larger the higher the phase transition temperature is. However, due to lower freeze-out temperature used with EoS A, the differences between the total yields are smaller than expected from the dependence on the phase transition temperature. When IS1 is used EoS D increases the photon yield by a factor of 1.2–1.8 and EoS H by a factor of 1.6–4 compared to EoS A. As mentioned, the use of IS 2 cuts high- photon production especially for EoS A and therefore the differences between EoSs are larger. When IS 2 is used, the photon spectra differ by factors of 1.2–2.3 (EoS D compared to EoS A) or 1.4–5.5 (EoS H compared to EoS A), the difference increasing with . For IS 1 the difference between EoSs is largest at GeV/.
5.3 Lepton pairs
5.3.1 Mass spectrum
We compare our results with the data measured by the CERES collaboration [42, 43]. These measurements are made for Pb+Au collision at 158 GeV energy, which should be comparable with our results for Pb+Pb collision at the same energy.
In the CERES measurements the dielectron background from the decays of final mesons is not subtracted and the measured dilepton yield consists of two parts. Instead of using the background estimated by the CERES collaboration [42], we calculate this background from our hydrodynamical simulation (see ref. [18]) using thermal yields for decaying mesons. However, our model assumes chemical equilibrium but the observed ratio [44] is equivalent with the chemical equilibrium value only around the temperature MeV [41]. Since thermal models [40, 41] show that the system is not in complete chemical equilibrium at the time of kinetic freeze-out we do not take this as an indication of a lower freeze-out temperature but as an indication of strangeness non-equilibrium instead (see section 5.1). To achieve consistency with the data we suppress the -yield by a factor of 0.6 when we use the freeze-out temperature MeV. Like for photons we show here results obtained using EoS A with MeV, and EoSs D and H with MeV. We have also checked that the number of -mesons obtained in our model is consistent with the experimental results [45].
In fig. 5a we show the background, the yield from thermal emission and the combined total mass spectrum folded with the CERES cuts and resolution. The thermal emission is calculated with EoS A and IS 1. Note that we compare our results with data from [43] for which the charged particle multiplicity is . Our calculation is tuned to reproduce the results of the NA49 experiment which uses a centrality trigger different from the trigger of the CERES experiment. Hence we get an average multiplicity of . The CERES collaboration has reported dependence on the multiplicity both in the shape and the magnitude of the spectrum scaled with multiplicity. Therefore we think our results should be compared with the high multiplicity data set rather than with data presented in [42].

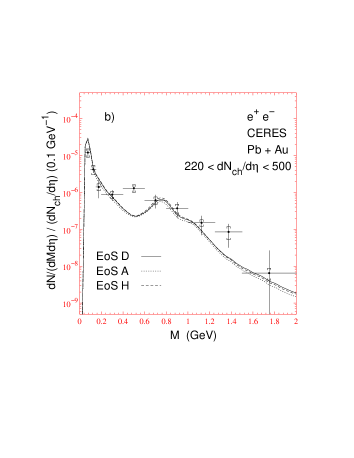
Our background overshoots the data at the mass of 75 MeV. This is due to our pion spectra being too flat at low values of transverse momenta as seen in fig. 2 for negative particles, mostly pions. Because our overall normalization is correct, we get too many pions in the CERES acceptance region.
Our calculation fails to reproduce the observed excess of electron pairs [43] around MeV as also the other hydrodynamical models do without in-medium changes of particle properties [12, 17, 46]. At 500 MeV the thermal emission is of the same order of magnitude than the background but the total yield is below the data by a factor 5–6, which requires an enhancement factor of 10 if the thermal emission is the origin of the excess. Possible explanation of the enhancement in this mass region have been studied extensively by other groups and are reviewed in [47]. For our studies here, it is important that possible in-medium modifications of -meson parameters which might cause this enhancement should not, however, suppress dielectron emission around free mass where the data are reproduced. A study of medium modified rates is done in a later work [20].
The dilepton results are similar for all EoSs, see fig. 5b. Despite the longest lifetime the yield obtained using EoS A is smallest at all values of invariant mass, but the differences are small. The differences are largest around the free -meson mass and at masses GeV where the spectra differ by a factor 1.2–1.3.
At masses below 1.5 GeV the effect of initial densities is even smaller. For EoS H the change in total yield is smallest, below a factor 1.1 at all values of invariant mass. For EoS A and D the difference is below 5% at GeV and increases slowly at larger values of mass. At GeV the initial state IS 1 produces 20% more electron pairs than the initial state IS 2. These differences are smaller than the present experimental errors.

The NA50 collaboration has measured dimuon emission in the intermediate mass region ( GeV) [48], but since the NA50 acceptance cuts are difficult to implement [49], we present the thermal spectra at masses GeV without any kinematic cuts and compare them with Drell-Yan pairs in fig. 6. The Drell-Yan yield is calculated in next to leading order using the parton distribution set CTEQ-3M from PDFLIB [50]. In the analysis of NA50 the data are roughly a factor 2 above the sum of Drell-Yan pairs and pairs from charm decays. Depending on the equation of state and the initial condition we found a thermal contribution of the same order as the Drell-Yan pairs or even larger explaining semi-quantitatively the found enhancement. A more detailed quantitative comparison with the NA50 data in [8, 12, 51] shows the important contribution from secondary interactions in this mass region.
For , the emission is dominated by the early, hot stage of the evolution. The thermal contribution is therefore sensitive to the initial densities. This can be seen in fig. 6 where the thermal emission for EoS A is shown for initial state IS 1 (dashed line) and IS 2 (dashed dotted line). The dotted line depicts the spectrum with EoS D and IS 1. When EoS D is used, thermal emission has qualitatively similar dependence on the initial state with the yield of 3 GeV electron pairs differing by a factor 3.5. We may thus conclude that in the intermediate mass region the thermal lepton pair production can differentiate between different initial conditions and that this contribution can be an important part of the observed excess in this mass region. However, in [51] the missing dimuons are generated by hadronic channels only dominated by the contribution, while our calculation has important contributions from the QGP. Therefore we consider the question of the relevant degrees of freedom for the thermal production of intermediate mass dimuons to be still open.
5.3.2 Rapidity spectrum
We have found that the rapidity spectrum of dileptons may be an observable which shows a qualitative dependence on the phase transition temperature. In fig. 8 we show the rapidity distribution of electron pairs with invariant mass MeV for three different EoSs and initial state IS 1. The shape of the distribution shows a clear dependence on . When EoS H is used the distribution is peaked at mid-rapidity, EoS D produces a plateau and the use of EoS A results in a spectrum with two peaks. The difference in shape is most prominent at MeV and vanishes at larger and lower values of pair mass where the spectra are single-peaked for all EoSs.


Characteristic of EoS A is the long lifetime of the fast flowing part of the fireball compared to its center. This is a result of a small pressure gradient in the mixed phase which does not blow the fireball apart. Due to the long lasting mixed phase the fast flowing part stays hot and produces a large contribution at 770 MeV invariant mass which gives the spectrum its double peaked shape. On the other hand at smaller masses the thermal distribution is wider. Therefore even fast-flowing parts of the fireball contribute significantly to mid-rapidity leptons and the resulting spectrum is single-peaked but wide. At larger masses the emission is dominated by the hot central region at the early stages of the evolution. The resulting spectrum is single-peaked and narrow (see fig. 8).
For EoS D, the lifetimes of the central and the fast flowing parts of the fireball differ less because the mixed phase is reached earlier and its lifetime is shorter than for EoS A. Compared to the contribution from the central fireball the contribution from the fast-flowing part is therefore reduced. At MeV the spectrum has a plateau at mid-rapidities but at lower and higher masses the plateau vanishes. At masses above 1.5 GeV the shape is very close to that obtained using EoS A indicating the dominance of the early emission and the closeness of initial states in both cases. The smaller emission from the fast flowing part can be seen at low masses too where the distribution is narrower than for EoS A.

The shape of the rapidity distribution is clearly affected by the initial state. In fig. 9 we show rapidity distributions of MeV electron pairs for the initial state IS 2. The distinctive double peaked structure for EoS A and IS 1 has changed into a wide plateau and EoS D produces an almost similar shape as EoS H. When EoS H is used both initial conditions result in rather similar flows and therefore the rapidity distribution stays almost unchanged. In the cases of EoSs A and D initial state IS 2 with weaker flow in the central region than for IS 1 leads to longer lifetime of the central fireball. On the other hand, compared to IS 1, the lifetime of the mixed phase in the fast flowing parts is shortened. As a result the double peak signal gets washed out and at masses below 770 MeV the distribution gets narrower. At masses above 1.5 GeV the most notable difference in lepton emission for IS 1 and IS 2 is the magnitude of the yield (see fig. 6). Also the shape of the distribution is wider for IS 2 because the lower initial temperature cuts lepton production in the early stages of the evolution, which contribute mainly to mid-rapidity leptons, but the small emission from the fast-flowing parts is almost similar for both initial conditions.
As mentioned the double peaked signal is strongest in the mass region MeV. In our figures we have shown the spectra at 770 MeV mass because the yield is largest at the free mass since no medium modifications are included in our production rates. We want to emphasize that the doubly peaked shape is not due to some structure in the production rates but it signals the existence of hot, sufficiently long living and fast moving parts of the fireball. The medium modifications of the rates can enhance or suppress this signal at different masses by changing the relative strength of the rate in the plasma and hadron gas in the mixed phase. Thus the region where the distribution is double peaked may extend also to lower masses, but the distribution will nevertheless be double peaked around MeV.
6 Conclusions
We have studied the dependence of hadron spectra on the freeze-out temperature and the equation of state and shown that different initial conditions of the hydrodynamical model can be used to reproduce the data. We have also considered the dependence of electromagnetic emission on the EoS and initial conditions when the evolution of the fireball is constrained to be consistent with the observed hadron spectra.
We began our paper by studying the combined effect of freeze-out temperature and EoS on hadronic spectra. A quantity of interest is the mean velocity of transverse flow, , which is not directly observable because the spectra depend on temperature and — as we want to emphasize — the flow pattern as well. Recently it was claimed that single particle spectra of different mass are able to narrow the thermal freeze-out conditions to MeV [2] because the dependence of spectra on and is different for particles of different mass. We found that this is not an unambiguous choice but the spectra can as well be reproduced using a higher MeV freeze-out temperature if the EoS is stiff enough. The difference arises for two reasons: First, we freeze-out at constant energy density causing the baryon rich areas to decouple at lower temperatures than the baryon poor areas, while in [2] a strictly constant freeze-out temperature is assumed. Second, in our hydrodynamical approach we get a transverse velocity profile which is not linear as the one used in [2]. For these reasons the average freeze-out temperature and the average transverse flow velocity can not be deduced unambiguously using hadronic spectra alone but more information is needed. HBT analysis [4, 5] is one way to reduce this ambiguity.
The hadron spectra leave some freedom in choosing the initial state of the hydrodynamic evolution. We were able to reproduce the hadron spectra using two clearly different initial conditions for each EoS, indicating that there is a variety of initial conditions for each EoS which lead to acceptable hadronic spectra and still correspond to the same thermalization timescale. In principle the difference in initial state affects electromagnetic observables but we found that at low values of transverse momenta the photon spectra and at low values of invariant mass the lepton pair spectra are almost identical for both initial conditions. On the other hand the differences increase with the values of and invariant mass. For photons with 5 GeV/ and for lepton pairs with 3 GeV the different initial conditions cause already almost an order of magnitude change in the yield. The lepton pair spectrum in this kinematic range is dominated by the Drell-Yan yield but there is a window where the thermal yield is larger than or equal to the Drell-Yan yield and the differences in thermal yield due to initial state are still of the order of two (see fig. 6). These differences may be large enough to provide a possibility to distinguish between different initial states. Since in the intermediate mass region the thermal dilepton emission is of the same order of magnitude as the yield of Drell-Yan pairs it can be an important contribution to the excess observed by the NA50 collaboration [48].
For photons the situation is more uncertain. In the region where differences in thermal yields are significant the total yield may be dominated by pre-equilibrium photons masking all the differences in the thermal yields completely. However, calculating the yield and distribution of pre-equilibrium photons is out of scope of this paper.
We also compared the calculated mass spectra of lepton pairs to data measured by the CERES collaboration. The differences in the spectra obtained using different EoSs or initial states were below the present experimental resolution. Our production rates do not include any in-medium effects and almost an order of magnitude enhancement is required to reproduce the observed excess around MeV invariant mass.
The effect of the EoS is most clearly seen in the shape of the rapidity spectrum of MeV lepton pairs which is very sensitive to the lifetime of the mixed phase. The lifetime of the mixed phase depends also on the initial state and the use of EoS D and IS 1 results in a very similar shape of the spectrum as the use of EoS A and IS 2. On the other hand these two cases can be distinguished by their dilepton mass spectrum in the intermediate mass region where their difference is close to an order of magnitude. We saw an interesting double peak structure of the dilepton rapidity spectra for a certain combination of equation of state, initial condition and invariant mass. It would be interesting to see how it compares to an experimental rapidity spectra.
References
- [1] E. Schnedermann, J. Sollfrank and U. Heinz, Phys. Rev. C 48, 2462 (1993).
- [2] B. Kämpfer, preprint FZR-149 (hep-ph/9612336).
- [3] R. Scheibl and U. Heinz, Phys. Rev. C in press (nucl-th/9809092).
- [4] U.A. Wiedemann, B. Tomášik and U. Heinz, Nucl. Phys. A638, 475c (1998).
- [5] B.R. Schlei, Heavy Ion Physics 5, 403 (1997); B.R. Schlei, D. Strottman, J.P. Sullivan and H.W. van Hecke nucl-th/9809070.
- [6] A. Dumitru, D.H. Rischke, T. Schönfeld, L. Winckelmann, H. Stöcker and W. Greiner, Phys. Rev. Lett. 70, 2860 (1993); A. Dumitru, U. Katscher, J.A. Maruhn, H. Stöcker, W. Greiner D.H. Rischke, Phys. Rev. C 51, 2166 (1995).
- [7] D.K. Srivastava and B. Sinha, Phys. Rev. Lett. 73, 2421 (1994).
- [8] E.V. Shuryak and L. Xiong, Phys. Lett. 333B, 316 (1994).
- [9] N. Arbex, U. Ornik, M. Plümer, A. Timmermann and R.M. Weiner, Phys. Lett. 354B, 307 (1995).
- [10] J.J. Neumann, D. Seibert and G. Fai, Phys. Rev. C 51, 1460 (1995); Phys. Rev. C 53, R14 (1996).
- [11] Y.A. Tarasov, Phys. Lett. 379B, 279 (1996).
- [12] D.K. Srivastava, B. Sinha and C. Gale, Phys. Rev. C 53, R567 (1996); D.K. Srivastava, B. Sinha, C. Gale, D. Pal and K. Haglin, Nucl. Phys. A610, 350c (1996).
- [13] J. Steele, H. Yamagishi and I. Zahed, Phys. Rev. D 56, 5605 (1996).
- [14] A.K. Chaudhuri, nucl-th/9705047.
- [15] T. Hirano, S. Muroya and M. Namiki, Prog. Theor. Phys. 98, 129 (1997); Prog. Theor. Phys. Suppl. 129, 101 (1997).
- [16] J. Cleymans, K. Redlich and D.K. Srivastava, Phys. Rev. C 55, 1431 (1997).
- [17] C.M. Hung and E.V. Shuryak, Phys. Rev. C 56, 453 (1997).
- [18] J. Sollfrank, P. Huovinen, M. Kataja, P.V. Ruuskanen, M. Prakash, and R. Venugopalan, Phys. Rev. C 55, 392 (1997).
- [19] S. Sarkar, P. Roy, J. Alam and B. Sinha, nucl-th/9812006.
- [20] P. Huovinen and M. Prakash, nucl-th/9812028.
- [21] J. Sollfrank, P. Huovinen and P.V. Ruuskanen, Heavy Ion Physics 5, 321 (1997).
- [22] J. Sollfrank, P. Huovinen and P.V. Ruuskanen, Eur. Phys. J. C 6, 525 (1999).
- [23] Particle Data Group, Phys. Rev. D 50, 1173 (1994).
- [24] J. Cleymans, J. Fingberg and K. Redlich, Phys. Rev. D 35, 2153 (1987).
- [25] C. Traxler, H. Vija and M. Thoma, Phys. Lett. 346B, 329 (1995).
- [26] E. Braaten, R.D. Pisarski and T. C. Yuan, Phys. Rev. Lett. 64, 2242 (1990).
- [27] T. Altherr and P.V. Ruuskanen, Nucl. Phys. B380, 377 (1992).
- [28] C. Gale and P. Lichard Phys. Rev. D 49, 3338 (1994).
- [29] G.Q. Li and C. Gale, Phys. Rev. C 58, 2914 (1998).
- [30] J. Kapusta, P. Lichard and D. Seibert, Phys. Rev. D 44, 2774 (1991).
- [31] H. Nadeau, J. Kapusta and P. Lichard, Phys. Rev. C 45, 3034 (1992); Phys. Rev. C 47, 2426 (1993).
- [32] L. Xiong, E. Shuryak and G.E. Brown, Phys. Rev. D 46, 3798 (1992).
- [33] U. Ornik, M. Plümer, B.R. Schlei, D. Strottman and R.M. Weiner, Phys. Rev. C 54, 1381 (1996); B.R. Schlei, U. Ornik, M. Plümer, D. Strottman and R.M. Weiner, Phys. Lett. 376B, 212 (1996).
- [34] A. Dumitru and D.H. Rischke, nucl-th/9806003.
- [35] F. Cooper and G. Frye, Phys. Rev. D 10, 186 (1974).
- [36] J.L. Goity and H. Leutwyler, Phys. Lett. 228B, 517 (1989); M. Prakash, M. Prakash, R. Venugopalan and G. Welke, Phys. Rep. 227, 323 (1993); E. Schnedermann and U. Heinz, Phys. Rev. C 50, 1675 (1994); H. Sorge, Phys. Lett. 373B, 16 (1996).
- [37] H. Appelshäuser et al. (NA49 collaboration), Eur. Phys. J. C 2, 661 (1998).
- [38] P.G. Jones et al. (NA49 collaboration), Nucl. Phys. A610, 188c (1996).
- [39] P. Jacobs et al. (NA49 collaboration), Proceedings of the Int. Conference on the Physics and Astrophysics of the Quark-Gluon Plasma, (Jaipur/India March 1997) edited by B.C. Sinha, D.K. Srivastava and Y.P. Viyogi, Narosa Publishing House, New Delhi(1998), p. 248.
- [40] P. Braun-Munzinger, J. Stachel, J.P. Wessels and N. Xu, Phys. Lett. 365B, 1 (1996).
- [41] F. Becattini, M. Gaździcki and J. Sollfrank, Eur. Phys. J. C 5, 143 (1998).
- [42] G. Agakichiev et al. (CERES Collaboration), Phys. Lett. 422B, 405 (1998).
- [43] I. Ravinovich et al. (CERES Collaboration), Nucl. Phys. A638, 159c (1998).
- [44] V. Friese et al. (NA49 Collaboration) J. Phys. G 23, 1837 (1997).
- [45] F. Geurts, Ph. D. Thesis, University of Utrecht, 1998, unpublished.
- [46] A. Drees, Nucl. Phys. A610, 536c (1996).
- [47] J. Wambach and R. Rapp, Nucl. Phys. A638, 171c (1998).
- [48] E. Scomparin et al. (NA50 Collaboration), Nucl. Phys. A610, 331c (1996).
- [49] C. Lourenço, private communication.
- [50] H. Plothow-Besch, Int. J. Mod. Phys. A10, 2901 (1995).
- [51] G.Q. Li and C. Gale, Phys. Rev. Lett. 81, 1572 (1998); Nucl. Phys. A638, 491c (1998).