and suppression by comovers in Pb+Pb collisions
Abstract
Measurements of and production at the CERN SPS are compared to predictions based on a hadronic model of charmonium suppression. Detailed information is presented to facilitate comparison to other analyses. Sensitivity of these conclusions to the model parameters is discussed.
1 INTRODUCTION
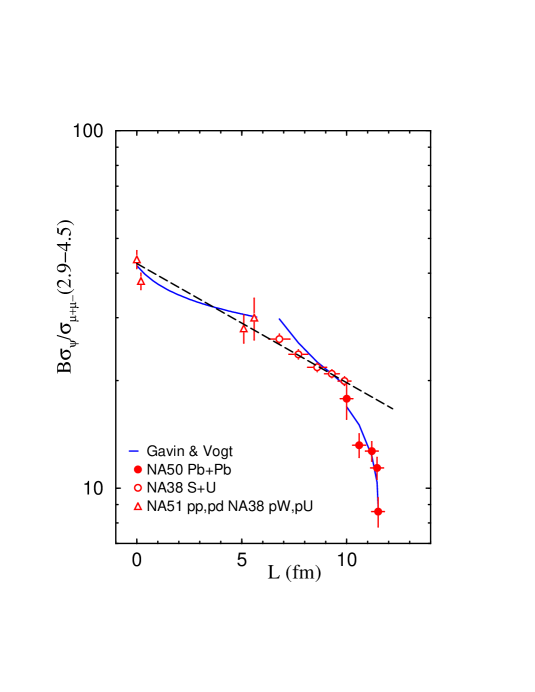
Has the quark–gluon plasma been discovered at the SPS? The NA50 collaboration reported a dramatic decrease in production in Pb+Pb collisions at 158 GeV per nucleon [1]. Specifically, M. Gonin presented at this meeting a striking ‘threshold effect’ in the –to–continuum ratio as a function of a calculated quantity, the mean path length of the through the nuclear medium, , see fig. 1. This apparent threshold has sparked considerable excitement as it may signal deconfinement in the heavy Pb+Pb system [2].
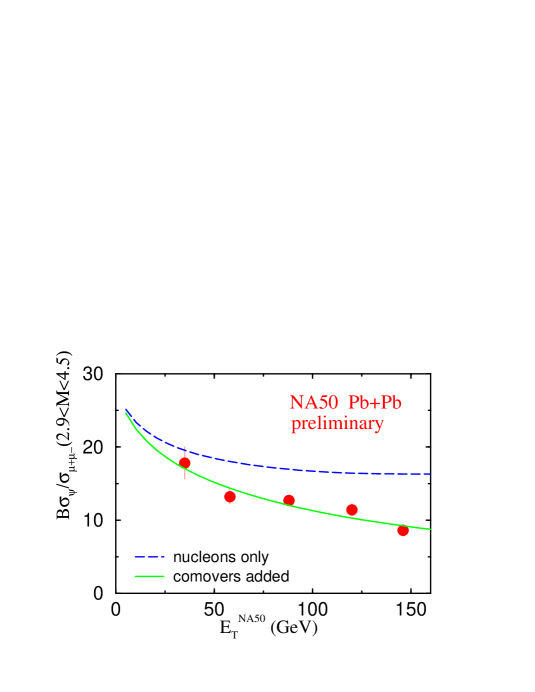
In this talk we report on work in ref. [3] comparing Pb results to predictions using a hadronic model of charmonium suppression. We first demonstrate that the behavior in the NA50 plot is not a threshold effect but, rather, reflects the approach to the geometrical limit of as the symmetric Pb+Pb collisions become increasingly central. When plotted as a function of the measured neutral transverse energy as in fig. 2, the data varies smoothly as in S+U measurements in fig. 4b below [6, 7, 8, 9]. The difference between S+U and Pb+Pb data lies strictly in the relative magnitude. To assess this magnitude, we compare and data to expectations based on the hadronic comover model [4, 5]. The curve in fig. 1 represents our calculation using parameters fixed earlier in Ref. [5]. Our result is essentially the same as the Pb+Pb prediction in [4].
Our primary intention in this work is to demonstrate that there is no evidence for a strong discontinuity between A, S+U and Pb+Pb data. Secondly, we show that our model predictions agree with the new Pb+Pb data. The consistency of our predictions can be judged by comparing our old A and S+U calculations with more recent NA38 and NA51 data. However, we must be cautious about taking model details too seriously. Regarding the first point, we quote Maurice Goldhaber: “ absence of evidence is not evidence of absence.” Moreover, we do not attempt to show that our comover interpretation of the data is unambiguous – this is certainly impossible at present. Finally, the significance of our present results must be weighted by the fact that all A and AB data are preliminary and at different beam energies. Whether the newer data is indeed ‘improved’ has yet to be established. One should be particularly cautious in taking literally the values of model parameters, such as the comover density.
2 NUCLEONS AND COMOVERS
The hadronic contribution to the suppression arises from scattering of the nascent with produced particles – the comovers – and nucleons [3, 4, 5]. To determine the suppression from nucleon absorption, we calculate the probability that a pair produced at a point in a nucleus survives scattering with nucleons to form a . The standard [5, 10] result is
| (1) |
where is the nuclear density, the impact parameter and the absorption cross section for –nucleon interactions. One can estimate , where is the path length traversed by the pair. On average, cannot exceed the nuclear radius , since the pair can be produced anywhere within the nucleus.
Suppression can also be caused by scattering with mesons that happen to travel along with the pair (see refs. in [4]). The density of such comovers scales roughly with . The corresponding survival probability is
| (2) |
where is the comover density and is the time in the rest frame. We write , where depends on the scattering frequency, the formation time of the comovers and the transverse size of the central region, , cf. eq. (8).
To understand the saturation of the Pb data with in fig. 1, we apply the schematic approximation of Ref. [10] for the moment to write
| (3) |
where the brackets imply an average over the collision geometry for fixed and . The path length and transverse size depend on the collision geometry. The path length grows with , but most stop at the geometric limit in central collisions. Explicit calculations show that nucleon absorption begins to saturate for , where is the smaller of the two nuclei, see fig. 6 below. On the other hand, particle production and, consequently, continue to grow after saturates due, e.g., to fluctuations in the number and hardness of collisions. Equation (2) falls exponentially in the ‘super–central’ regime, , because is essentially fixed.
Important for understanding the NA50 results is the fact that saturation occurs at larger values of the average impact parameter for Pb+Pb system compared to S+U, see fig. 6 below. This result reflects the striking geometric difference between symmetric and asymmetric nuclear collisions. Specifically, in the S+U system there is large region, , where varying changes the volume of the interaction region dramatically. In contrast, in Pb+Pb collisions and fm is large. We show below that typical values of corresponding to the region covered by NA50 data do not go far into the region where [The importance of being near zero for saturation to occur was overemphasised in SG’s oral presentation of this talk.]
3 SUPPRESSION
In fig. 1, we compare the Pb data to calculations of the –to–continuum ratio that incorporate nucleon and comover scattering. The contribution due to nucleon absorption indeed levels off for small values of , as expected from eq. (3). Comover scattering accounts for the remaining suppression.
These results are predictions obtained using the computer code of Ref. [4] with parameters determined in Ref. [5]. However, to confront the present NA50 analysis [1], we must perform the following updates:
-
•
Calculate the continuum dimuon yield in the new mass range GeV.
-
•
Adjust the scale to the pseudorapidity acceptance of the NA50 calorimeter, .
The agreement in fig. 1 depends strongly on these adjustments.
We now review the details of our calculations, highlighting the adjustments as we go. For collisions at a fixed , the –production cross section is
| (4) |
where is the product of the survival probabilities in the projectile , target and comover matter. The continuum cross section is
| (5) |
The magnitude of eqs. (4), (5) and their ratio is fixed by the elementary cross sections and . We calculate using the phenomenologically–successful color evaporation model [11]. The continuum in the mass range used by NA50, GeV, is described by the Drell–Yan process [12]. To confront NA50 and NA38 data in the appropriate kinematic regime, we compute these cross sections at leading order using GRV LO parton distributions with a charm –factor and a color evaporation coefficient from [11] and a Drell–Yan –factor . Using these cross sections to construct the normalized ratios in fig. 2 corresponds to the first update.
To obtain dependent cross sections from eqs. (4) and (5), we write
| (6) |
The probability that a collision at impact parameter produces transverse energy is related to the minimum–bias distribution by
| (7) |
We parametrize , where , , and is the number of participants (see, e.g., Ref. [4]). We take and to be phenomenological calorimeter–dependent constants.
We compare the minimum bias distributions for total hadronic calculated using eq. (7) for GeV and to NA35 S+S and NA49 Pb+Pb data [13]. The agreement in fig. 3a builds our confidence that eq. (7) applies to the heavy Pb+Pb system.

Figure 3b shows the distribution of neutral transverse energy calculated using eqs. (5) and (6) to simulate the NA50 dimuon trigger. We take GeV, , and pb as appropriate for the dimuon–mass range GeV. The distribution for S+U from NA38 was described [5] using GeV and – the change in corresponds roughly to the shift in particle production when the pseudorapidity coverage is changed from (NA38) to (NA50). Taking GeV is the second update listed earlier. Though not shown here, we comment that the calculations agree with the NA50 data at high , but differ somewhat at low due to the efficiency of the active target, which is lower for more peripheral collisions.
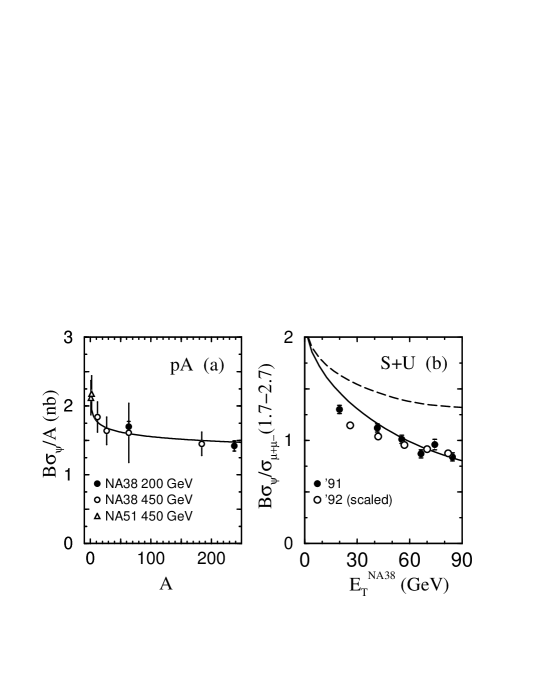
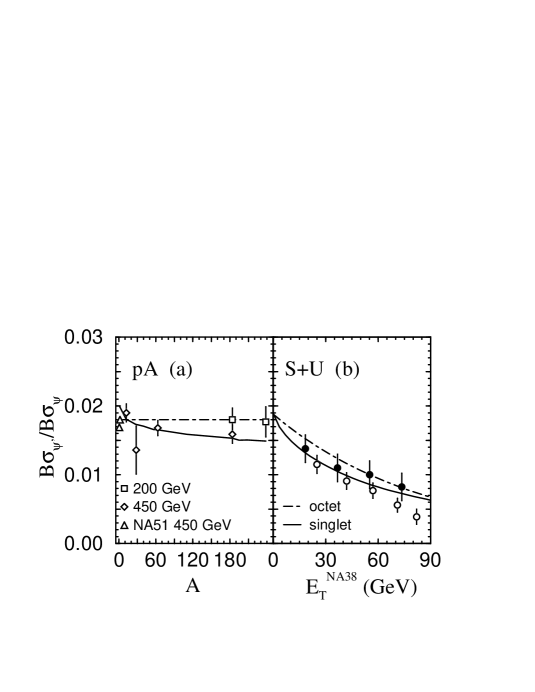
We now apply eqs. (1,2,4) and (5) to charmonium suppression in Pb+Pb collisions. To determine nucleon absorption, we used A data to fix mb in Ref. [5]. This choice is in accord with the latest NA38 and NA51 data, see fig. 4a.
To specify comover scattering [5], we assumed that the dominant contribution to dissociation comes from exothermic hadronic reactions such as . We further took the comovers to evolve from a formation time fm to a freezeout time following Bjorken scaling, where is roughly the average relative velocity. The survival probability, eq. (2), is then
| (8) |
where , and is the initial density of sufficiently massive and mesons. To account for the variation of density with , we take [4]. A value fm-3 was chosen to fit the central S+U datum. Since we fix the density in central collisions, this simple ansatz for may be inaccurate for peripheral collisions.
We expect the comover contribution to the suppression to increase in Pb+Pb relative to S+U for central collisions because both the initial density and lifetime of the system can increase. To be conservative, we assumed that Pb and S beams achieve the same mean initial density. Even so, the lifetime of the system essentially doubles in Pb+Pb because increases to 6.6 fm from 3.6 fm in S+U. The increase in the comover contribution evident in comparing figs. 2 and 4b is described by the seemingly innocuous logarithm in eq. (8), which increases by in the larger Pb system.
In Ref. [5], we pointed out that comovers were necessary to explain S+U data from the NA38 1991 run [6]. Data just released [1] from their 1992 run support this conclusion. The ’91 data were presented as a ratio to the dimuon continuum in the low mass range GeV, where charm decays are an important source of dileptons. On the other hand, the ’92 data [1, 9] are ratios to the Drell–Yan cross section in the range GeV. That cross section is extracted from the continuum by fixing the –factor in the high mass region [14]. To compare our result from Ref. [5] to these data, we scale the ’92 data by an empirical factor. This factor is larger than our calculated factor ; these values agree within the NA38 systematic errors. [NA50 similarly scaled the ’92 data to the high–mass continuum to produce fig. 1.] Because our fit is driven by the highest datum, we see from fig. 4b that a fit to the ’92 data would not appreciably change our result. Note that a uniform decrease of the ratio by 10% would increase the comover contribution needed to explain S+U collisions.
NA50 and NA38 have also measured the total –production cross section in Pb+Pb [1] and S+U reactions [7]. To compare to that data, we integrate eqs. (4, 6) to obtain the total nb in S+U at 200 GeV and 0.54 nb for Pb+Pb at 158 GeV in the NA50 spectrometer acceptance, and (to correct to the full angular range and , multiply these cross sections by ). The experimental results in this range are nb for S+U collisions [6] and nb for Pb+Pb reactions [1]. Interestingly, in the Pb system we find a Drell–Yan cross section pb while NA50 finds pb. Both the and Drell–Yan cross sections in Pb+Pb collisions are somewhat above the data, suggesting that the calculated rates at the level may be too large at 158 GeV. Such an error is consistent with ambiguities in current data near that low energy [11]. Note also that nuclear effects on the parton densities omitted in eqs. (4,5) can affect the total S and Pb cross sections at this level.
4 COMPARISON TO OTHER WORK
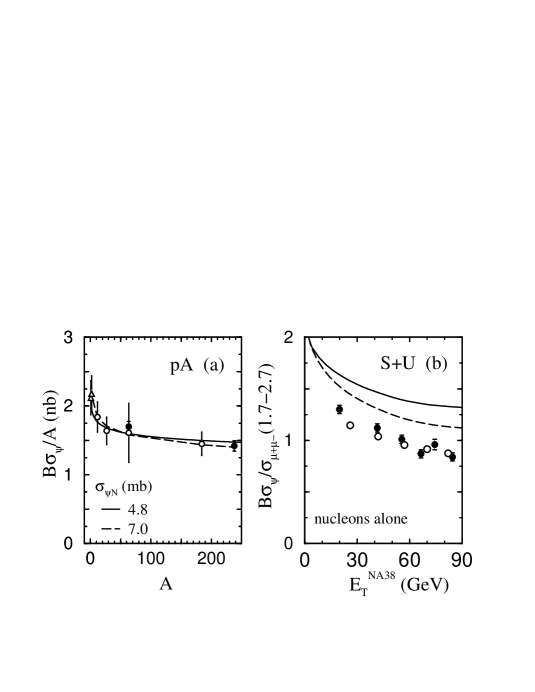
To compare more easily our results with those in Refs. [1, 2], we present the following technical points. Blaizot and Ollitrault [2] and Kharzeev in these proceedings have observed that one can describe the measured total cross sections in A and S+U in the absence of comovers if one takes mb. We also find this to be true – neglecting comovers and taking their value for the absorption cross section, we obtain nb in S+U at 200 GeV and 0.62 nb for Pb+Pb at 158 GeV. On the other hand, our calculated –dependent ratios do not agree with measurements, as shown in fig. 5 (see also [5]). The importance of comovers in high events follows from the correlation between , centrality and particle (comover) multiplicity. On the other hand, comovers only contribute to the total S+U cross section at the level, because the impact–parameter integrated cross section is dominated by large and the distinction between central and peripheral interactions is more striking for the asymmetric S+U system.
How well does our value 4.8 mb agree with the A data? We estimate the per degree of freedom to be 0.34 for mb and 1.3 for mb. Both values of are close to unity and indicate reasonable fits. Given the paucity of the data and the crudeness of the models, we consider the agreement to data to be equivalent. Observe that including the measured S+U total cross section in extracting from data as in [1] introduces an inappropriate bias.
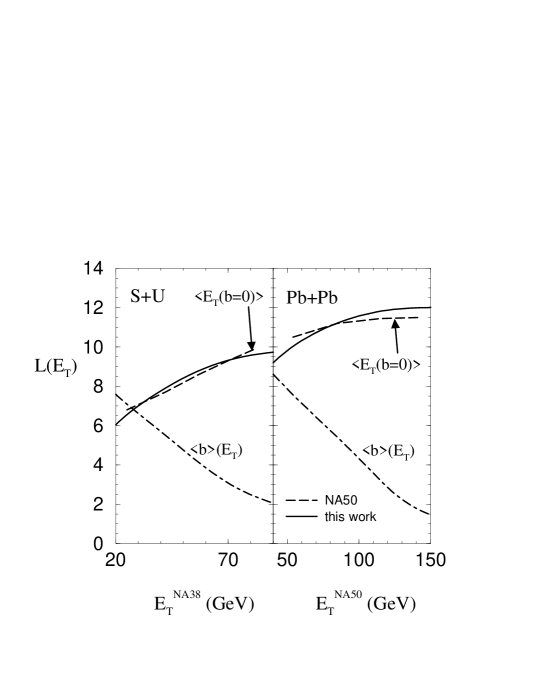
Where does the in NA50’s plot come from and how does it approach the geometric? To address these questions we estimate . Following [10] we neglect comovers and equate (3) to our result for the –to– continuum ratio from (1) and (4-6). We then expand in powers of and equate the terms proportional to to find
| (9) |
where
| (10) |
and . This quantity is strictly meaningful for values of the mean free path , as are the results of [10]. Following [1, 10], we overlook the fact that this is not true for realistic parameter values, and obtain the result in fig. 6. We see that both our and the average value of obtained from are in excellent accord with NA50 results in [1]. To compare to NA50, we calculate for fm-3 (a more realistic value is fm-3). More importantly, we see that saturation is nearly achieved in the symmetric Pb+Pb system even when the average is rather large.
5 SUPPRESSION

To apply eqs. (4-6) to calculate the –to– ratio as a function of , we must specify , , and . Following Ref. [11], we use data to fix (this determines ). The value of depends on whether the nascent is a color singlet hadron or color octet as it traverses the nucleus. In the singlet case, one expects the absorption cross sections to scale with the square of the charmonium radius. Taking this ansatz and assuming that the forms directly while radiative decays account for 40% of production, one expects for interactions with either nucleons or comovers [5]. For the octet case, we take and fix mb to fit the S+U data. In fig. 5a, we show that the singlet and octet extrapolations describe A data equally well.
Our predictions for Pb+Pb collisions are shown in fig. 6. In the octet model, the entire suppression of the –to– ratio is due to comover interactions. In view of the schematic nature of our approximation to in eq. (8), we regard the agreement with data of singlet and octet extrapolations as equivalent.
6 SUMMARY
In summary, the Pb data [1] cannot be described by nucleon absorption alone. This is seen in the NA50 plot, fig. 1, and confirmed by our results. The saturation with but not suggests an additional density–dependent suppression mechanism. Earlier studies pointed out that additional suppression was already needed to describe the S+U results [5]; recent data [1] support that conclusion (see, however, [2]). To study the S+U question further, experiments can search for saturation in super–central S+U reactions. More generally, while comover scattering explains the additional suppression, it is unlikely that that explanation is unique. SPS inverse–kinematics experiments () and AGS A studies near the threshold [15] can help pin down model uncertainties.
In the context of our hadronic scenario, the success of the and predictions imply comover densities perhaps exceeding fm-3 in Pb+Pb collisions. Similar densities are found in string and cascade models of heavy ion collisions. We must ask if such hadronic models are applicable at such densities — they must certainly be at the very edge of their applicability. Nevertheless, such models have proven very useful as predictive phenomenological tools. The ability to predict hadronic backgrounds that we have demonstrated is a prerequisite for using charmonium to search for new phenomena at RHIC and LHC.
We thank Claudie Gerschel and Michel Gonin for discussions of the NA38 and NA50 data and Miklos Gyulassy, Geppetto McLerran and Ezra Pisarski for insightful comments.
References
- [1] M. Gonin et al. (NA50), Proc. Quark Matter ’96, Heidelberg, Germany, P. Braun-Munzinger et al., eds. (1996).
- [2] J.-P. Blaizot and J.-Y. Ollitrault, (1996) hep-ph/9606289; D. Kharzeev and H. Satz, Proc. Quark Matter ’96, op cit.; A. Capella, private communication.
- [3] S. Gavin and R. Vogt, LBL-37980 (1996), hep-ph/9606560.
- [4] S. Gavin and R. Vogt, Nucl. Phys. B345 (1990) 104.
- [5] S. Gavin, H. Satz, R. L. Thews, and R. Vogt, Z. Phys. C61 (1994) 351; S. Gavin, Nucl. Phys. A566 (1994) 287c.
- [6] O. Drapier et al. (NA38) Nucl. Phys. A544 (1992) 209c.
- [7] C. Baglin et al. (NA38) Phys. Lett. B270 (1991) 105.
- [8] C. Baglin et al. (NA38) Phys. Lett. B345 (1995) 617; S. Ramos et al. Nucl. Phys. A590 (1995) 117c.
- [9] C. Lourenco (NA38/NA50), Europhysics Conf. on High Energy Physics - EPS-HEP, Brussels (1995).
- [10] C. Gerschel and J. Hüfner, Z. Phys. C56 (1992) 171.
- [11] R. Gavai et al., Int. J. Mod. Phys. A10 (1995) 3043.
- [12] S. Gavin et al., Int. J. Mod. Phys. A10 (1995) 2961.
- [13] S. Margetis et al. (NA49), Phys. Rev. Lett. 75 (1995) 3814.
- [14] M.C. Abreu et al., Nucl. Phys. A566 (1994) 77c.
- [15] K. Seth, Proc. Int. Conf. on Flavor and Spin in Hadronic Physics, Torino, eds. F. Balestra et al. (Editrice Compositori, Bologna, 1994).