Upper edge of the neutron star inner crust: the drip point and around
M. Baldo1, E.E. Saperstein2 and S.V. Tolokonnikov2
1INFN, Sezione di Catania, 64 Via S.-Sofia, I-95123
Catania,
Italy
2 Kurchatov Institute, 123182, Moscow, Russia
Abstract
A semi-microscopic self-consistent quantum approach developed recently to describe the inner crust structure of neutron stars within the Wigner-Seitz method and the explicit inclusion of neutron and proton pairing correlations is used for finding the neutron drip point which separates the outer and inner crusts. The equilibrium configurations of the crust are examined in vicinity of the drip point and in the upper part of the inner crust, for the density region corresponding to average Fermi momenta fm-1.
1 Introduction
The crust of a neutron star consists of matter with subnuclear densities, , where is the nuclear saturation density. The outer part of the crust is a crystal system consisting of mainly spherically symmetrical nuclei immersed in a virtually uniform sea of ultra-relativistic electrons which makes the system electro-neutral. At some critical density value, the so-called neutron drip point , the neutron chemical potential becomes positive. As a consequence, in the inner part of the crust a portion of neutrons begins to become delocalized and forms a superfluid neutron liquid surrounding the nuclear-like clusters. As it is well known, the neutron superfluidity is responsible for many properties of neutron stars [1].
The crust contains only about 1% of the neutron star mass, its thickness being only 10% of the neutron star radius. However, the understanding of the crust structure is of primary importance for explaining several important observational phenomena in neutron stars. Sudden changes of the pulsar rotation periods, the so-called glitches, should be mentioned here in the first place. The neutron superfluidity of the crust is also very important for the cooling process of the neutron star [1].
The drip point was originally calculated by Baym, Pethick, and Sutherland (BPS) [2] who developed a thermodynamic approach to describe the outer crust using a phenomenological nuclear equation of states based on an extrapolation of the nuclear mass data. Their prediction for the drip point was g/cm3 which corresponds to the average Fermi momentum fm-1. 111The average Fermi momentum is defined as , corresponding to homogeneous neutron matter at the same average density. We prefer to deal with this variable instead of because, through the inner crust, it changes much more slowly than the density itself, which makes smoother the graphical presentation of the results. A little later, Negele and Vautherin (NV) [3] developed a completely quantum approach to describe the inner crust of a neutron star based on the energy density functional method in combination with the spherical Wigner-Seitz (WS) approximation. Within this method, the crystal matter under consideration is approximated with the set of independent spherical cells, the neutron single-particle wave functions obeying some boundary condition. This method was applied in [3] to the self-consistent description of the structure of the inner crust in a wide density region. NV confirmed also the BPS prediction of the drip point value, the drip instability in their study occurring for the nucleus Kr. The first point just above the drip point (fm-1) considered in [3] corresponds to an equilibrium configuration with .
Recently S. B. Ruster et al. [4] carried out a systematic analysis of the outer crust structure in the vicinity of the drip point within the thermodynamic BPS method, but with a set of different models for the nuclear equation of state (various kinds of Skyrme forces, modern versions of the droplet model, relativistic nuclear mean field theory and so on). All the predictions for the neutron drip point turned out to be rather close to the BPS one, g/cm3. As to the drip values, , they are quite close to the NV ones.
In this paper, we try to study the drip point region within a semi-microscopic self-consistent quantum approach which was developed recently [5, 6, 7, 8] to describe the inner crust. This approach is generically close to the NV one but takes into account in a self-consistent way the effect of the neutron and proton pairing correlations. Within the NV approach, for a fixed average nuclear density , the energy functional of the system is minimized for the spherical WS cell of the radius . Each cell contains
| (1) |
nucleons. This number is shared between protons and neutrons. As far as the neutron star matter is uncharged, the cell should contain electrons. In addition, the -stability condition,
| (2) |
has to be fulfilled, where , and are the chemical potentials of electrons, neutrons and protons, respectively. They are defined as to include the corresponding bare masses. In the NV calculation, pairing effects were not taken into account because their contribution to the total energy of the system under consideration is quite small. Only 30 years after the classical paper [3], in 2004, there appeared a self-consistent calculation of the inner crust structure with the pairing effects taken into consideration [9]. It was carried out within the Hartree-Fock method with Skyrme forces plus the BCS approximation employing some schematic effective pairing forces. In [9], the main attention was paid to the comparison of the neutron pairing gap in the crust with that for the homogeneous neutron matter. However, the influence of the pairing effects on the equilibrium configuration () of the inner crust at different densities was not analyzed.
This effect was demonstrated in [5, 6] and analyzed systematically in [7, 8]. In the approach formulated in [7] the generalized energy functional method [10, 11] is used, which incorporates the pairing effects into the original Kohn-Sham [12] method. The interaction part of the generalized energy functional depends, on equal footing, on the normal densities , and the anomalous ones, , as well. The ansatz of [7] for the complete energy functional is a smooth matching of the phenomenological and the microscopic functionals at the nuclear cluster surface. For the normal component of the first one, we use the nuclear effective functional DF3 by S. A. Fayans et al. [11]. The anomalous term of the nuclear functional of [11] is modified a little in [7] to the form which is more adequate for describing the inner crust structure. The microscopic part of the energy functional which describes the neutron matter surrounding the nuclear cluster is calculated within the Brueckner approach with the Argonne force v18 [13]. The systematic analysis performed for a wide density region showed that, as a rule, the equilibrium configuration () changes noticeably due to pairing. The effect grows as the density increases, and for the equilibrium values at fm-1 reaches a factor of two. So strong pairing effect can be explained on the basis of the -equilibrium condition (2). In fact, the variations due to pairing of the chemical potentials, and , are, as a rule, much stronger than those of the total binding energy.
In [7, 8], the intermediate and bottom parts of the inner crust was examined in the density interval corresponding to the average Fermi momenta fm-1. In this paper, we use the same method for finding the drip point and for investigating the ground state configurations of the crust in vicinity of this density value. To make description of the inner crust more complete, we carried out also systematic calculations for the interval fm-1. In connection with validity of the WS approximation, it is worth to mention that recently a consistent band theory was developed for the inner star crust [14, 15, 16]. In [17], this more fundamental method is compared with the WS approximation for the upper region of the inner crust. It is concluded that the WS approximation is well suited for describing the ground state properties of the system under consideration, whereas the description of some dynamical aspects needs the consistent band theory. As far as we limit ourselves to the ground state properties, we can rely on the validity of the WS method for the density interval under consideration.
2 On the method
The method we developed is described in detail in Refs. [7, 18, 19]. Here we specify only some details to explain the version we use in this paper. The ansatz of [7] for the complete energy functional is a smooth matching of the phenomenological and the microscopic functionals at the cluster surface:
| (3) |
where the matching function is a two-parameter Fermi function:
| (4) |
Eq. (3) is applied both to the normal and to the anomalous components of the energy functional. The diffuseness parameter was taken equal to fm for any value of the average baryon density of the inner crust and for any configuration (). The matching radius is chosen anew in any new case in such a way that the equality
| (5) |
holds.
We use the nuclear DF3 functional for the phenomenological component of (3). For the microscopic part of the normal component of the total energy functional (3) we follow refs. [7] and take the equation of states of neutron matter calculated in [13] with the Argonne v18 potential on the basis of Brueckner theory, taking into account a small admixture of 3-body force. Its explicit form can be found in the cited articles.
The anomalous part of the energy functional used in [7] has the form:
| (6) |
where () is the density dependent effective pairing interaction.
The matching relation (3) for the anomalous part of the energy functional leads to the analogous relation for the effective pairing interaction:
| (7) |
The isotopic index is for brevity omitted. The phenomenological effective pairing interaction in [7] has a density dependent coordinate delta-function form, just as in [11]. The explicit form of the density dependence [11] was modified a little in [7] in accordance with (7). As to the microscopic effective pairing interaction, it was calculated in [7] within the BCS approximation with the same Argonne force v18 as the normal part of the energy functional. In this approach, the set of the gap values for all the Fermi momenta under consideration is the only input for finding the effective pairing interaction. In [19], a more realistic model for neutron pairing was used to take into account the many-body corrections to the BCS approximation which, as it is commonly known, suppress the neutron gap significantly. The density and momentum independent suppression factor was introduced,
| (8) |
to describe the many-body effects approximately. Two versions of this model were considered, with (P2 model) or (P3 model). In this notation, the BCS approximation has been named as the P1 model. In this paper, we limit ourselves with the intermediate case of the P2 model.
One more remark should be made before presenting the results. As it is known [3], the boundary conditions for the neutron single-particle wave functions inherent to the WS method are more or less arbitrary provided they guarantee the orthogonality and completeness of the function set. NV used the following one:
| (9) |
for odd , and
| (10) |
for even ones. In [18] two kinds of these conditions were examined which a priory look similar. The NV boundary condition was denoted as BC1. An alternative kind of the boundary conditions (BC2) was considered in [18] also, when Eq. (9) is valid for even whereas Eq. (10), for odd ones. The analysis of [18] for the BCS approximation (the P1 model) and the similar one of [19] for the P2 and P3 models have shown that predictions on the basis of BC1 versus BC2 are in general different. This results in uncertainties inherent to the WS method itself which grow at increasing . But in the upper part of the inner crust they turned out to be negligible [18]. Therefore in this paper we limit ourselves to the BC1 version of boundary conditions.
3 The drip point
The approach of [7] based on the WS method was developed initially for describing the inner crust. In this case, part of the neutrons becomes delocalized, therefore the neutron number per WS cell can be fractional. The same is true for the total nucleon number per cell found from (1). In this case, the -stability relation (2) always has a solution as far as two chemical potentials in this equation, and , are continuous regular functions of the cell radius .
The WS method could be used also to the outer crust, , with some small modifications. Now, all neutrons in the system are bound inside the nuclei, therefore should be integer. Then, the chemical potentials and are discrete functions of and both don’t depend practically on . Therefore, for an arbitrary density , Eq. (2) has no exact solution. However, it is not necessary in this case. Instead of Eq. (2), the -stability condition for the outer crust looks as a set of inequalities
| (11) |
where is the ground state energy of the corresponding nucleus. differs from the binding energy by the inclusion of the bare neutron and proton masses. In the limit of large values, when one can neglect the difference of in neighboring nuclei, the double inequality (11) yields the equality (2). Estimations show that in the bottom part of the outer crust, in the vicinity of the drip point, one can approximately use the same version of the WS method as that for the inner crust. In particular, one can suppose (and ) to be fractional, which leads to the possibility of solving Eq. (2) exactly. In this Section, we do use such an approximate scheme.
It is worth to mention that in the outer crust the phenomenological component of the energy functional (3) plays the main role. Indeed, as far as all neutron are now bound, the microscopic term of (3) is switched on only in the region where the neutron density falls. However, we can not a priory neglect this contribution. In the physical situation of the outer crust the complete functional (3) is practically equivalent to a modification of the surface components of the effective interaction appearing in the phenomenological functional of [11], but it is well known that predictions of the self-consistent calculations for atomic nuclei are highly sensitive to details of the effective interaction at the surface. Therefore, for finding the drip point we carried out two sets of calculations. In the first one we used only the phenomenological nuclear DF3 functional, in the second one, the complete semi-microscopic functional of (3).
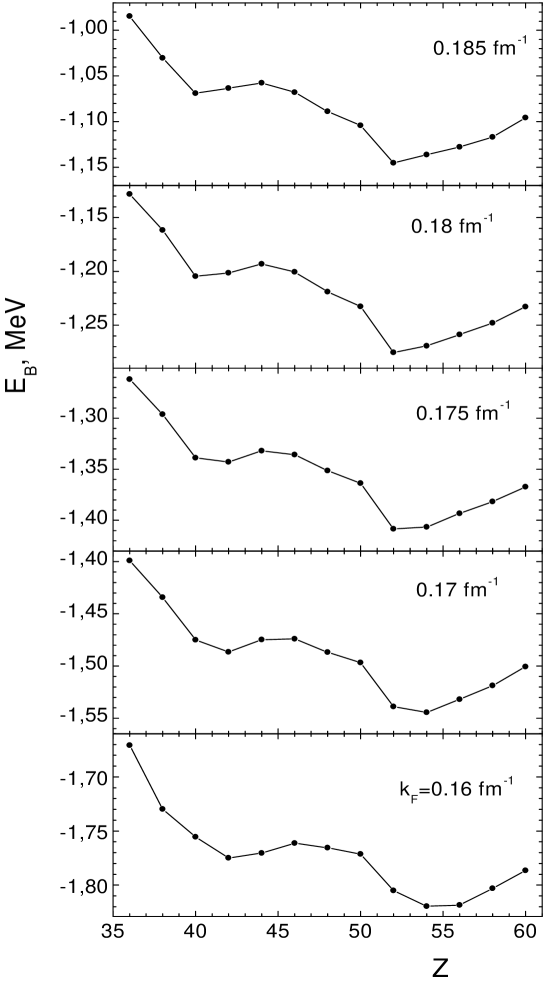
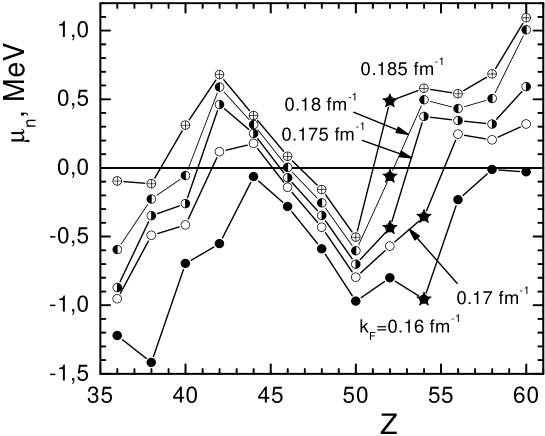
Let us first consider in more detail the version with the pure phenomenological DF3 functional. In Fig. 1, the binding energy per nucleon is displayed as a function on for different values of in vicinity of the critical point by BPS. As one can see, the minimum of the function is shifted from the NV value of (or of [4]) to . The corresponding curves for the dependence are displayed in Fig. 2. At each value of , the star indicates the point corresponding to the minimum of , i.e. to the equilibrium configuration. As one can see, the drip point corresponds to the critical value of the Fermi momentum which is a little above fm-1. A simple interpolation results in the value of fm-1. The latter corresponds to the density g/cm3. Thus, the difference from the BPS prediction (and that of [4]) for the drip point position in this case is not negligible. But the most essential deviation occurs for the ground state configuration () at the drip point and around. The main characteristics of the equilibrium WS cell for the case under consideration are presented in Table 1. As one can see, the drip point predicted with the DF3 functional corresponds to the drip nucleus with () values in vicinity of the magic numbers and . Fig. 2 shows that there is another ”drip region” with (corresponding neutron number values are in vicinity of the magic number ). However, as it is seen from Fig.1, this region corresponds to higher values of the binding energy.
| , fm-1 | , fm | , MeV | , MeV | ||
|---|---|---|---|---|---|
| 0.160 | 54 | 125 | 67.61 | -1.820 | -0.957 |
| 0.170 | 54 | 127 | 63.82 | -1.544 | -0.355 |
| 0.175 | 52 | 126 | 61.64 | -1.408 | -0.436 |
| 0.180 | 52 | 126 | 59.98 | -1.275 | -0.062 |
| 0.185 | 52 | 128 | 58.61 | -1.145 | 0.487 |
Then we repeated the calculations with the complete functional (3) including both the phenomenological DF3 and microscopic components. The results are given in Table 2. In this case, the drip point is shifted a little to fm-1 which corresponds to the density g/cm3. It is quite close to the value by BPS and it is within the interval given in [4]. As to the and values, they are practically the same as in Table 1.
| , fm-1 | , fm | , MeV | , MeV | ||
|---|---|---|---|---|---|
| 0.180 | 52 | 128 | 60.14 | -1.398 | -0.868 |
| 0.190 | 52 | 126 | 57.85 | -1.150 | -0.552 |
| 0.195 | 52 | 126 | 57.36 | -1.043 | 0.123 |
| 0.200 | 52 | 130 | 57.19 | -0.950 | 0.194 |
Thus, our results obtained within the self-consistent quantum approach, with both the phenomenological DF3 functional or the semi-microscopic one [7], agree approximately with predictions of [4] for the drip point position but deviate significantly for the drip values. Hardly the latter originates from the difference between the thermodynamic BPS approach used in [4] and the completely quantum method (á lá the NV one) used in this paper. Indeed, the drip NV values found within, in general, similar quantum approach are very close to those in [4]. The main origin of the difference is related, evidently, to the peculiarities of the DF3 functional. It should be stressed that this functional describes with high accuracy a lot of spherical nuclei, including long isotopic chains [11]. It is worth to mention also that recently Y.Yu and A.Bulgac [20] examined binding energies of a number of isotope and isotone chains (with the total number of nuclei exceeding 200) within the so-called SLDA (Superfluid LDA) method developed previously by A. Bulgac[21]. For the normal component of the energy density functional they used alternatively or the popular version of the Skyrme force, SLy4, or the density functional FaNDF0 by S.A. Fayans [22]. 222The DF3 functional of [11] is an advanced version of FaNDF0, but the difference is quite small. For both versions, the authors of [20] obtained very good description of the data, but the accuracy of the run with the FaNDF0 force turns out to be higher. That is why we think that our results for the drip point region for both sets of calculations are closer to the truth. Remind that we used the DF3 functional in the first one and the semi-microscopic functional of [7, 18, 19] in the second one. The latter functional contains the same DF3 functional as the phenomenological ingredient of (3).
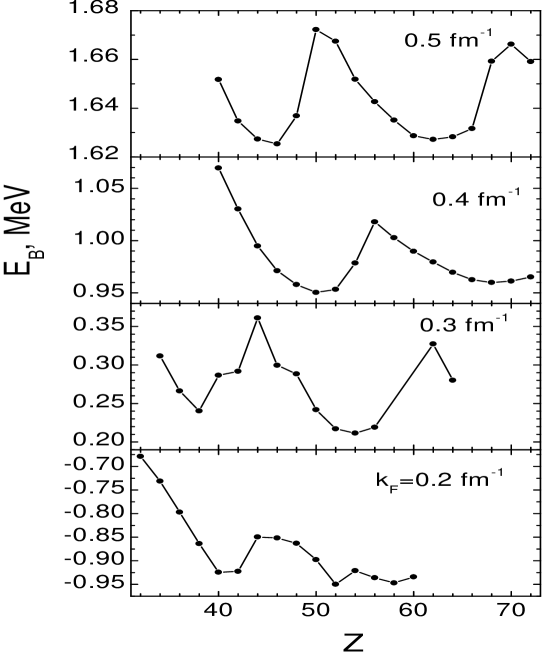
4 The upper part of the inner crust
Let us go now to densities above the drip point corresponding to the upper part of the inner crust. In this region, we have considered previously [18] only the case of fm-1 which is very close to the drip point. Now, we analyze systematically the region of fm-1. As it was mentioned above, we limit ourselves with the P2 model of[19] and with BC1 boundary condition of the WS method (i.e. that of [3]). Results are presented in Figs. 3 - 6 and in Tables 3 - 6. In Table 3, the equilibrium characteristics of the inner crust within the WS method are given. The ratio indicates the average concentration of protons for a density under consideration. For the sake of comparison, the corresponding NV values are also presented. It should be noted that calculations in [3] were performed at slightly different values of the density. We took the results of [3] for the closest values of the average Fermi momentum 0.202, 0.296, 0.361 and 0.480 fm-1, correspondingly. The difference between predictions of our approach and the NV ones for the and values turned out to be of the same order of magnitude as in the intermediate and bottom parts of the crust (fm-1) investigated in [8, 19]. In the latter case, we explained this difference mainly with the neutron pairing effects. For the upper layers of the inner crust their influence and all the role of the neutron surroundings is smaller, therefore the main reason of the difference is, evidently, the difference between the DF3 functional and the NV one, when the latter is applied to ordinary atomic nuclei.
| , fm-1 | [3] | [3] | , fm | , fm [3] | [3] | |||
|---|---|---|---|---|---|---|---|---|
| 0.2 | 52 | 40 | 212 | 180 | 57.2 | 53.6 | 0.245 | 0.222 |
| 0.3 | 54 | 40 | 562 | 320 | 52.8 | 44.3 | 0.096 | 0.125 |
| 0.4 | 50 | 40 | 830 | 500 | 45.1 | 42.2 | 0.060 | 0.080 |
| 0.5 | 46 | 40 | 1020 | 950 | 38.6 | 39.3 | 0.045 | 0.042 |
| , fm-1 | , MeV | , MeV | ||
|---|---|---|---|---|
| 0.2 | 52 | 212 | -0.950 | 0.194 |
| 0.3 | 54 | 562 | 0.211 | 1.018 |
| 0.4 | 50 | 830 | 0.950 | 1.804 |
| 0.5 | 46 | 1020 | 1.625 | 2.643 |
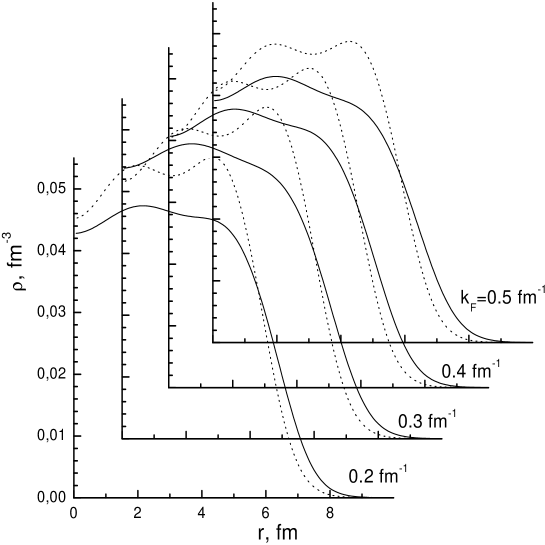
Table 4 contains the main energy characteristics of the inner crust in the region under consideration. Some average characteristics of nuclear clusters in the center of the WS cell are presented in Table 5. Here is the matching radius defined with Eq. (5). To avoid influence of quantum oscillations, the quantity in this relation was replaced by the average proton density over the interval fm. We include into the cluster all nucleons inside the sphere with the radius . 333It should be stressed that the dividing of the WS cell into the cluster and surrounding neutron matter is used here just for an illustration, and the calculation procedure outlined above doesn’t involve any explicit separation procedure. It contains practically all Z protons and
| (12) |
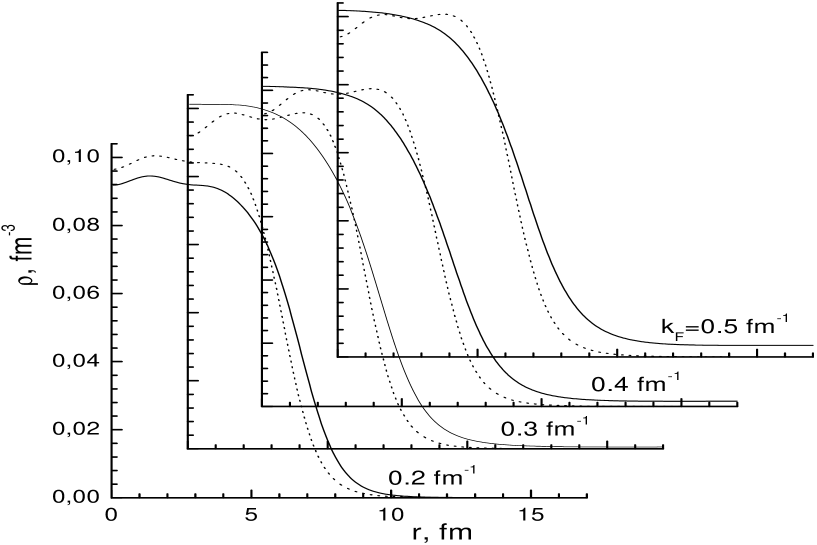
neutrons. The total particle number in the cluster is . The ratio is the average proton concentration inside the cluster and , the relative nucleon number inside the cluster. At last, the neutron and proton cluster radii and are defined as the points of the maximum gradient of the corresponding densities. These densities are displayed in Fig.4 (neutrons) and Fig. 5 (protons). For comparison, the similar densities for ordinary atomic nuclei with the same and were also calculated and displayed (with the dotted lines). One can see that, in the density region under consideration, the nuclear-type clusters in the center of the WS cell are quite similar to their nuclear counterparts. All such nuclei are bound with the exception of the one for the case of fm-1, Pd, which occurred a little above the corresponding neutron drip line (the neutron chemical potential is MeV). In the self-consistent calculation procedure for such unstable nucleus we put it in an external box. As far as the contribution of the positive energy states to the total neutron density for such a small value of is tiny, it could be neglected for a qualitative comparison. At higher values of fm-1 considered in [8, 19] all the nuclear counterparts of the nuclear clusters are already unbound significantly, which makes a similar comparison impossible. The main difference of the density distribution in the cluster from that in the nuclear counterpart is the bigger values of the radius and of the diffuseness parameter. This is true both for neutrons and for protons, for all values under consideration, the effect being lager for higher density values. At high values of analyzed in [8, 19] the quasi-nuclei in the centers of the WS cells have nothing in common with ordinary nuclei [8].
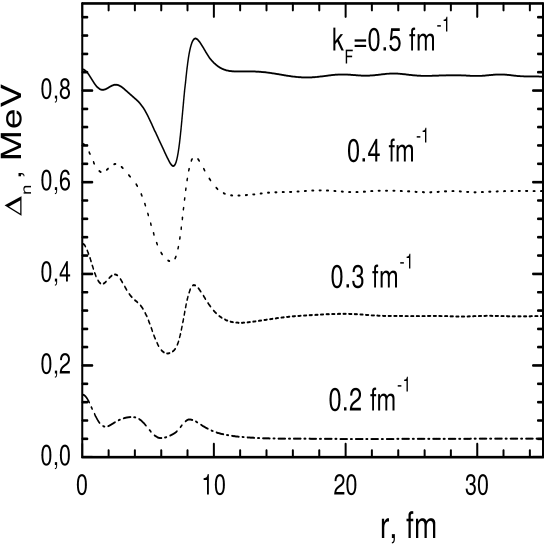
Let us go now to the analysis of the neutron gap function , which, as it was mentioned in the Introduction, is of primary importance for neutron star observable properties. The gap functions for different values of are displayed in Fig. 6. One can see that, although at each value of there is a non-regular behavior of at the central cluster surface, the absolute value of the gap inside the cluster is governed by that in the asymptotic region and it is essentially different for different . This feature of the function contradicts to a naive LDA picture. Within such a naive LDA, dealing with the combined phenomenological-microscopical energy functional of the (3) form, one could expect the gap function inside the cluster, where only the phenomenological component of the energy functional survives, close to that in ordinary atomic nuclei which is typically of the order of 1 MeV. Indeed, as we see in Fig. 4, the neutron density distribution inside the cluster is very close to that in the nuclear counterpart. The drastically different pattern in Fig. 6 demonstrates a strong inside-outside interplay in the gap equation, the so-called proximity effect.
Table 6 collects some important characteristics of the gap for all the density values under consideration. The notation of [19] is used. For sake of completeness, we repeat it shortly. The asymptotic value of the Fermi momentum is calculated in terms of the asymptotic value of the density averaged over the interval , fm. The analogous average is calculated for the asymptotic gap value . The central gap value is determined as the average of over the interval fm. The Fermi average gap is defined as the average value of the diagonal matrix element of the neutron gap at the Fermi surface. The averaging procedure involves 10 levels above and 10 levels below. Furthermore, means the infinite neutron matter gap value found within the P2 model (the BCS value divided by 2) for the density corresponding to the Fermi momentum . Finally is the same for the Fermi momentum . Let us remind that the latter corresponds to the average nucleon density under consideration. Obviously, the inequality holds because the WS cell contains a nuclear-like cluster in the center with the density which exceeds the average one. Since in the small region the value of increases with , the inequality is valid. The difference is especially large in the case of fm , which is nearby the neutron drip point. Indeed, in this case almost all the matter is concentrated in the central blob. The difference between the two neutron gaps decreases as increases.
As it was discussed in [19], the difference between the asymptotic value and the infinite neutron matter prediction is a measure of validity of the LDA for the gap calculation outside the central nuclear cluster. In the density region examined in [19], fm-1, the typical accuracy of the LDA in this point was about 10%. For and fm-1, it is of the same order, for and fm-1, the difference is larger, which is an evidence of a stronger proximity effect. The Fermi average value is usually very close to . This is because the region outside the nuclear cluster, in which the function is almost a constant, gives the main contribution to the matrix elements of nearby the Fermi surface.
| ,fm-1 | ,fm | ,fm | ,fm | ,fm | |||||
|---|---|---|---|---|---|---|---|---|---|
| 0.2 | 52 | 212 | 163 | 0.319 | 0.769 | 6.77 | 6.41 | 7.48 | 57.19 |
| 0.3 | 54 | 562 | 174 | 0.310 | 0.309 | 6.88 | 6.55 | 7.65 | 52.79 |
| 0.4 | 50 | 830 | 170 | 0.294 | 0.205 | 6.80 | 6.45 | 7.60 | 45.09 |
| 0.5 | 46 | 1020 | 166 | 0.277 | 0.163 | 6.77 | 6.41 | 7.57 | 38.64 |
| , fm-1 | , fm-1 | ||||||
|---|---|---|---|---|---|---|---|
| 0.2 | 52 | 0.116 | 0.083 | 0.044 | 0.043 | 0.063 | 0.198 |
| 0.3 | 54 | 0.267 | 0.373 | 0.309 | 0.308 | 0.365 | 0.440 |
| 0.4 | 50 | 0.376 | 0.634 | 0.587 | 0.581 | 0.647 | 0.711 |
| 0.5 | 46 | 0.479 | 0.808 | 0.832 | 0.830 | 0.945 | 0.982 |
5 Conclusion
Ground state properties of the upper part of the inner crust are examined within the semi-microscopic self-consistent quantum approach developed recently [5, 6, 7, 8]. The theory is developed within the WS scheme and adopts a specific effective density functional. The latter is constructed by matching at the nuclear cluster surface the phenomenological nuclear DF3 functional [11] to the microscopic one calculated for neutron matter within the Brueckner approach and the Argonne force v18. For the superfluid component of the latter, the model P2 of [19] is used which takes into account approximately the many-body corrections to the BCS approximation. In this approach, the drip point separating the inner crust from the outer one is determined mainly by the phenomenological component of the semi-microscopic functional. For the drip point region, we carried out two sets of calculations. In the first one, the calculations are performed with only the phenomenological DF3 functional, while in the second one the full semi-microscopic of Eq. (3) is employed.
The drip point density is found to be equal to g/cm3 in the first case and g/cm3 in the second. The first value is a slightly smaller than the one which is commonly adopted [4], while the second one practically coincides with it. More significant difference appears for the proton number of the nucleus at the drip point which is shifted from of [4] to . The corresponding neutron number is about equal to the magic value . This difference originates, evidently, from the peculiarities of the effective DF3 force in comparison with, say, Skyrme forces, which are mainly used in [4]. For describing nuclei far from the beta-stability valley which are considered in vicinity of the drip point, the isovector component of the effective force is especially important. The density dependence of the latter in [11] and that of the Skyrme forces is quite different. It should be stressed that the parameters of [11] were chosen to reproduce the binding energies and the radii of long isotopic chains, therefore one may hope that their extrapolation to the drip line region is sufficiently accurate. The high accuracy of the effective force by S.A. Fayans et al., in comparison with the popular version SLy4 of the Skyrme force, was recently confirmed also by Y.Yu and A.Bulgac [20].
In addition, we systematically examined the equilibrium configurations of the upper part of the inner crust, for the density region corresponding to average Fermi momenta fm-1. These calculations supplement the ones of [8, 19] to make the description of the ground state of the inner crust of neutron star complete over all the density interval except the bottom layers fm-1 where the non-spherical configurations are commonly believed [1] to be energetically favored. The features of the solution are in many ways similar to those for the fm-1 examined in [8, 19], but there are some peculiarities. In particular, in the density region under consideration, for the nuclear-type clusters in the center of the WS cell there exist the counterparts among ordinary atomic nuclei below the neutron drip line.444The one for fm-1, the Pd nucleus, is situated almost exactly on the drip line. This makes possible direct comparison of the neutron and proton densities in the cluster with those in the nuclear counterpart. It turned out that the corresponding density distributions are quite similar, but the values of the radius and of the diffuseness parameter for clusters are slightly bigger, the effect increasing at larger .
As to the equilibrium configurations (), they differ from the NV ones significantly. Indeed, we found , whereas the value of was found in [3] for all the region under consideration. To this respect, the situation for higher values of is similar [8, 19], but at fm-1 we obtained values which are significantly smaller than the NV ones. As to the pairing gap function, it shows a strong interplay between the region inside the cluster in the center of the WS cell and the neutron matter outside it. This effect takes place for all values of including the smallest one where the gap value itself is very small.
This research was partially supported by the Grant NSh-8756.2006.2 of the Russian Ministry for Science and Education and by the RFBR grant 06-02-17171-a.
References
- [1] C.J. Pethick and D.G. Ravenhall, Ann. Rev. Nucl. Part. Sci. 45, 429 (1995).
- [2] G.Baym, C.Pethick, and P.Sutherland, Ap.J, 170, 299 (1971).
- [3] J. Negele and D. Vautherin, Nucl. Phys. A 207, 298 (1973).
- [4] S. B. Ruster, M. Hempel, and J. Schaffner-Bielich, Phys. Rev. C 73, 035804 (2006).
- [5] M. Baldo, U. Lombardo, E.E. Saperstein, S.V. Tolokonnikov, JETP Lett. 80, 523 (2004).
- [6] M.Baldo, E.E.Saperstein, S.V. Tolokonnikov, Mucl. Phys. A 749, 42 (2005).
- [7] M. Baldo, U. Lombardo, E.E. Saperstein, S.V. Tolokonnikov, Nuc. Phys. A 750, 409 (2005).
- [8] M. Baldo, U. Lombardo, E.E. Saperstein, S.V. Tolokonnikov, Phys. At. Nucl., 68, 1812 (2005).
- [9] F. Montani, C. May and M. Muther, Phys. Rev. C 69, 065801 (2004).
- [10] A.V. Smirnov, S.V. Tolokonnikov, S.A. Fayans, Sov. J. Nucl. Phys. 48, 1030 (1988).
- [11] S. A. Fayans, S. V. Tolokonnikov, E. L. Trykov, and D. Zawischa, Nucl. Phys. A 676, 49 (2000).
- [12] W. Kohn, L.J. Sham, Phys. Rev. A 140, 1133 (1965).
- [13] M. Baldo, C. Maieron, P. Schuck and X. Vinas, Nucl. Phys. A 736, 241 (2004).
- [14] B. Carter, N. Chamel, P. Haensel, Nucl. Phys., A 748, 675 (2005).
- [15] N. Chamel, Nucl. Phys., A 747, 109 (2005).
- [16] N. Chamel, Nucl. Phys., A 773, 263 (2006).
- [17] N. Chamel, S. Naimi, E. Khan, and J. Margueron, arxiv preprint astro-ph/0701851.
- [18] M. Baldo, E.E. Saperstein, S.V. Tolokonnikov, Nuc. Phys. A 775, 235 (2006).
- [19] M. Baldo, E.E. Saperstein, S.V. Tolokonnikov, arxiv preprint nucl-th/0609031, to be published in EPJA.
- [20] Y. Yu and A. Bulgac, Phys. Rev. Lett. 90, 222501 (2003).
- [21] A. Bulgac, Phys. Rev. C 65, 051305(R) (2002).
- [22] S. A. Fayans, JETP Lett., 68, 169 (1998).