Hydrodynamic Flow and Jet Induced Mach Shocks at RHIC and LHC
Abstract:
We discuss the present collective flow signals for the phase transition to quark-gluon plasma (QGP) and the collective flow as a barometer for the equation of state (EoS). A study of Mach shocks induced by fast partonic jets propagating through the QGP is given. We predict a significant deformation of Mach shocks in central Au+Au collisions at RHIC and LHC energies as compared to the case of jet propagation in a static medium. Results of a hydrodynamical study of jet energy loss are presented.
1 The QGP phase transition
Lattice QCD calculations yield a phase diagram [1, 2] (Fig. 1) showing a crossing, but no first-order phase transition to the quark-gluon plasma (QGP) for vanishing or small chemical potentials , i.e. for conditions accessible at central rapidities at full RHIC energy. A first-order phase transition is expected to occur only at high baryochemical potentials or densities, i.e. at lower SPS and RHIC energies ( A GeV) and in the fragmentation region of RHIC, [3, 4]. Here, the critical baryochemical potential is predicted [1, 2] to be large, , and the critical temperature to be MeV. We expect a first-oder phase transition also at finite strangeness [5]. Predictions for the phase diagram of strongly interacting matter for realistic non-vanishing net strangeness are urgently needed to obtain a comprehensive picture of the QCD phase structure in all relevant dimensions (isospin, strangeness, non-equilibrium) of the EoS. Multi-strange degrees of freedom are very promising probes for the properties of the dense and hot matter [6].
1.1 Thermodynamics in the - plane
Figure 1 shows a comparison of the QCD predictions with the thermodynamic parameters and extracted from the UrQMD transport model in the central overlap regime of Au+Au collisions [7]. Full dots with errorbars denote the ’experimental’ chemical freeze-out parameters – determined from fits to the experimental yields – taken from Ref. [8]. Triangular and quadratic symbols (time-ordered in vertical sequence) stand for temperatures and chemical potentials taken from UrQMD transport calculations in central Au+Au (Pb+Pb) collisions at RHIC [9] as a function of the reaction time (separated by 1 fm/c steps from top to bottom). Open symbols denote nonequilibrium configurations and correspond to parameters extracted from the transverse momentum distributions, whereas the full symbols denote configurations in approximate pressure equilibrium in longitudinal and transverse direction.
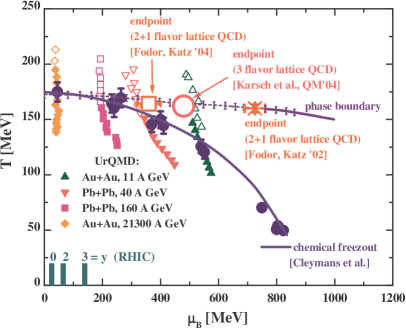
During the nonequilibrium phase (open symbols) the transport calculations show much higher temperatures (or energy densities) than the ’experimental’ chemical freeze-out configurations at all bombarding energies ( 11 A GeV). These numbers are also higher than the critical point (circle) of (2+1) flavor lattice QCD calculations by the Bielefeld-Swansea-collaboration [2] (large open circle) and by the Wuppertal-Budapest-collaboration [1] (the star denotes earlier results from [1]). The energy density at is of the order of 1 GeV/fm3. At RHIC energies a cross-over is expected at midrapidity, when the temperature drops during the expansion phase of the ’hot fireball’. The baryon chemical potential has been obtained from a statistical model analysis by the BRAHMS collaboration based on measured antihadron to hadron ratios [10] for different rapidity intervals at RHIC energies. At midrapidity one finds , whereas at forward rapidities increases up to MeV at . Thus only a forward rapidity measurement ( will allow to probe large at RHIC. The STAR and PHENIX detectors at RHIC offer a unique opportunity to reach higher chemical potentials and the first-order phase transition region at midrapidity in the high-mu-RHIC-running at A GeV in the coming year. The International FAIR Facility at GSI will be offering a fully devoted research program in the next decade.
1.2 Hydrodynamic flow
Hydrodynamic flow and shock formation has been proposed early [11, 12] as the key mechanism for the creation of hot and dense matter in relativistic heavy-ion collisions [13]. The full three-dimensional hydrodynamical flow problem is much more complicated than the one-dimensional Landau model [14]: the 3-dimensional compression and expansion dynamics yields complex triple differential cross-sections which provide quite accurate spectroscopic handles on the EoS. The bounce-off, (i.e., the strength of the directed flow in the reaction plane), the squeeze-out, (the strength of the second moment of the azimuthal particle emission distribution) [11, 12, 15, 16, 17, 18, 19], and the antiflow [15, 16, 17, 18, 19] (third flow component [20, 21]) serve as differential barometers for the properties of compressed, dense matter from SIS to RHIC. In particular, it has been shown [12, 15, 16, 17, 18, 19] that the disappearance or so-called collapse of flow is a direct result of a first-order phase transition.
Several hydrodynamic models [22] have been used in the past, starting with the one-fluid ideal hydrodynamic approach. It is well known that this model predicts far too large flow effects. To obtain a better description of the dynamics, viscous fluid models have been developed [23, 24, 25]. In parallel, so-called three-fluid models, which distinguish between projectile, target and the fireball fluid, have been considered [26]. Here viscosity effects appear only between the different fluids, but not inside the individual fluids. The aim is to have at our disposal a reliable, three-dimensional, relativistic three-fluid model including viscosity [24, 25].
Flow can be described very elegantly in hydrodynamics. However, also consider microscopic multicomponent (pre-)hadron transport theory, e.g. models like qMD [27], IQMD [28], UrQMD [29], or HSD [30], as control models for viscous hydrodynamics and as background models to subtract interesting non-hadronic effects from data.
1.3 AGS and SPS results - a review
Microscopic (pre-)hadronic transport models describe the formation and distributions of many hadronic particles at AGS and SPS quite well [31]. Furthermore, the nuclear EoS has been extracted by comparing the calculation results to flow data which are described reasonably well up to AGS energies [20, 32, 33, 34, 35, 36]. On the other hand, ideal hydrodynamical calculations predict far too much flow at these energies [23], what shows that viscosity effects have to be taken into account.
In particular, ideal hydrodynamical calculations yield factors of two higher for the sideward flow at SIS [23] and AGS, while the directed flow measurement of the E895 collaboration shows that the and data are reproduced reasonably well [34, 37] by UrQMD calculations, due to the reasonable cross-sections, i.e. realistic mean-free-path of the constituents in this hadronic transport theory.
Only ideal hydrodynamical calculations predict the appearance of a third flow component [20] the so-called antiflow [37, 38] in central collisions. We stress that this only holds if the matter undergoes a first-order phase transition to the QGP. The signal is that around midrapidity the directed flow, , of protons develops a negative slope. In contrast, a hadronic EoS without QGP phase transition does not yield such an exotic antiflow (negative slope) wiggle in the proton flow . The ideal hydrodynamic time evolution of the directed flow, , for the purely hadronic EoS shows a clean linear increase of [38], just as the microscopic transport theory and as the data [34], whereas for an EoS including a first-order phase transition to the QGP, the proton flow collapses. The collapse occurs around midrapidity. This observation is explained by an antiflow component of protons, developing when the expansion from the plasma sets in [39].
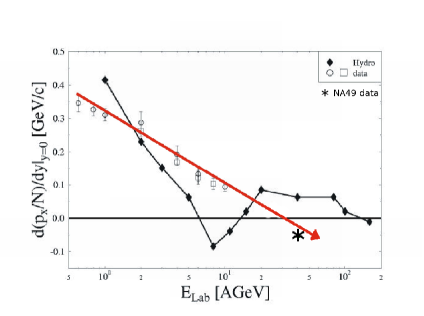
The ideal hydrodynamic directed proton flow (Fig. 2) shows even negative values between 8 and 20 A GeV. An increase back to positive flow is predicted with increasing energy, when the compressed QGP phase is probed. But, where is the predicted minimum of the proton flow in the data? Hydrodynamical calculations suggest this ”softest-point collapse” is at A GeV. This has not been verified by the AGS data. However, a linear extrapolation of the AGS (Fig. 2) data indicates a collapse of the directed proton flow at A GeV.
Recently, substantial support for this prediction has been obtained by the low energy 40 A GeV SPS data of the NA49 collaboration [41]. These data clearly show the first proton antiflow around mid-rapidity (cf. Fig. 2, in contrast to the AGS data as well as to UrQMD calculations involving no phase transition.
Thus, at bombarding energies of A GeV, the predicted effects of the first-order phase transition to the baryon-rich QGP are most likely observed, hence the first-order phase transition line in the --diagram has been crossed. In this energy region the new FAIR facility at GSI will operate. There are good prospects that the baryon flow collapse and other first-order QGP phase transition signals can be studied soon at the lowest SPS energies as well as at the RHIC planned HiMu-run ( A GeV) at midrapidity and possibly in the fragmentation region for the highest RHIC and LHC-collider energies. These experiments will enable a detailed study of the first-order phase transition at high and of the properties of the baryon-rich QGP in the near future.
2 Proton elliptic flow collapse at 40 A GeV - more evidence for a first-order phase transition at highest net baryon densities
At SIS energies, microscopic transport models reproduce the data on the excitation function of the proton elliptic flow quite well: A soft, momentum-dependent EoS [42, 43] seems to account for the data. The observed proton flow below 5 A GeV is smaller than zero, which corresponds to the squeeze-out predicted by hydrodynamics long ago [11, 12, 15, 16, 17, 18, 19]. The AGS data exhibit a transition from squeeze-out to in-plane flow in the midrapidity region. The change in sign of the proton at A GeV is in accord with transport calculations (UrQMD calculations [34] for HSD results see Ref. [35, 36]). At higher energies ( A GeV) a smooth increase of the flow is predicted from hadronic transport simulations. In fact, the 158 A GeV data of the NA49 collaboration suggest that this smooth increase proceeds between AGS and SPS as predicted. Accordingly, UrQMD calculations without phase transition give considerable 3% flow for midcentral and peripheral protons at 40 A GeV (cf. Ref. [37, 34]).
This is in strong contrast to recent NA49 data at 40 A GeV (see Ref. [41]): A sudden collapse of the proton flow is observed for midcentral as well as for peripheral protons. This collapse of for protons around midrapidity at 40 A GeV is very pronounced while it is not observed at 158 A GeV.
The dramatic collapse of the flow also observed by NA49 [41], again around 40 A GeV, where the collapse of has been observed yields again evidence for the hypothesis of the observation of a first-order phase transition to QCD. This is, according to Ref. [1, 2] and Fig. 1, the highest energy at which a first-order phase transition can be reached at central rapidities of relativistic heavy-ion collisions. We therefore conclude that a first-order phase transition at the highest baryon densities accessible in nature has been seen at these energies in Pb+Pb collisions. Moreover, Ref. [44] shows that the elliptic flow clearly distinguishes between a first-order phase transition and a crossover.
3 Partonic jet induced Mach shocks in an expanding QGP
Sideward peaks have been recently observed [45, 46, 47, 48] in azimuthal distributions of secondaries associated with the high- hadrons in central Au+Au collisions at GeV. In Ref. [37] such peaks had been predicted as a signature of Mach shocks created by partonic jets propagating through a QGP formed in heavy–ion collisions. Analogous Mach shock waves were studied previously in cold hadronic matter [11, 15, 19, 49, 50] as well as in nuclear Fermi liquids [51, 52]. Recently, Mach shocks from jets in the QGP have been studied in Ref. [53] by using a linearized fluid–dynamical approach.
It is well known [14] that a point–like perturbation moving with supersonic speed in the spatially homogeneous ideal fluid produces the so–called Mach region of the perturbed matter. In the fluid rest frame (FRF) the Mach region has a conical shape with an opening angle with respect to the direction of particle propagation given by the expression111Quantities in the FRF are marked by tilde. where denotes the sound velocity of the unperturbed (upstream) fluid and is the particle velocity with respect to the fluid. In the FRF, trajectories of fluid elements (perpendicular to the surface of the Mach cone) are inclined at the angle with respect to . Strictly speaking, the above formula is applicable only for weak, sound–like perturbations. It is not valid for space–time regions close to a leading particle. Nevertheless, we shall use this simple expression for a qualitative analysis of flow effects [37, 54]. Following Refs. [37, 53, 54], one can estimate the angle of preferential emission of secondaries associated with a fast jet in the QGP. Assuming the particle velocity to be and the sound velocity to be leads to . This agrees well with positions of maxima of the away–side two–particle distributions observed in central Au+Au collisions at RHIC energies.
4 Deformation of Mach shocks due to radial flow

Assuming that the away–side jet propagates with velocity parallel to the matter flow velocity and does not change with space and time, one sees that after performing the Lorentz boost to the FRF, a weak Mach shock has a conical shape with the axis along . In this reference frame, the shock front angle is again given by . Transformation from the FRF to the center of mass frame (CMF) shows that the Mach region remains conical, but the Mach angle becomes smaller in the CMF, where is the Lorentz factor corresponding to the flow velocity u . Using the above Eqns. leads to the expression for the Mach angle in the CMF
| (1) |
where and the upper (lower) sign corresponds to the jet’s motion in (or opposite to) the direction of collective flow. For ultrarelativistic jets () it is what leads to
| (2) |
with . According to Eq. (2), in the ultrarelativistic limit does not depend on the direction of flow with respect to the jet. The Mach cone becomes more narrow as compared to jet propagation in static matter. This narrowing effect has a purely relativistic origin. Indeed, the difference between from Eq. (2) and the Mach angle in absence of flow given by is of second order in the collective velocity .
The case of a jet propagating at nonzero angle with respect to the flow velocity is more complicated. Mach shocks become nonconical for non–collinear flows. For simplicity, we study only the case when the jet and flow velocities are orthogonal to each other, . Let axes and be directed along and , respectively. We first make the transition to the FRF by performing a Lorentz boost along the axis which leads to a jet velocity .
Assume a jet propagating along the path during the time interval in the FRF. At the same time, the wave front from a point–like perturbation (created at the origin ) reaches a spherical surface with radius . Two tangent lines and border the Mach regio with the symmetry axis . This region only exists for what can be fulfilled by or . It has a conical shape with opening angles determined by the expressions .
Performing inverse transformation from FRF to CMF, it is easy to show that the Mach region is modified in two ways. First, it is no longer symmetrical with respect to the jet trajectory in the CMF. The boundaries of the Mach wave have different angles, , with respect to in this reference frame. One can interpret this effect as a consequence of transverse flow which acts like a wind deforming the Mach cone along the direction . On the other hand, the angles of the Mach front with respect to the beam axis are not changed under the transformation to the CMF. We conclude that, due to effects of transverse flow, the Mach region in the CMF should have a shape of a deformed cone with an elliptic base. Figure 3 shows numerical values of the Mach angles for an ultrarelativistic jet moving through the QGP transversely or collinearly to its flow velocity. We point out a much stronger sensitivity of the Mach angles to the transverse flow velocity as compared with the collinear flow.
To discuss possible observable effects we consider three events with different di–jet axes with respect to the center of a fireball. In the first event, the away–side jet propagates along the diameter of the fireball, i.e. collinearly with respect to the collective flow. In the other cases, the di–jet axes are oriented along chords close to the boundary of the fireball. In these events, the fluid velocity has both transverse and collinear components with respect to the jet axis. By this the Mach fronts are deformed in an expanding matter. The radial expansion of the fireball should cause a broadening of the sideward peaks in the –distributions of associated hadrons. Due to the radial expansion, the peaks will acquire an additional width of the order of . Here are local values of the Mach angles in individual events. The angular brackets represent the averaging over the jet trajectory in a given event and over all events with different positions of di–jet axes. Assuming that the particle emission is perpendicular to the surface of Mach cone and taking , , we estimate the angular spread of emitted hadrons in the range . This is comparable with the half distance between the away–side peaks of the distribution observed by the STAR and PHENIX collaborations [45, 46, 47, 48]. On the basis of this analysis we conclude that in individual events the sideward maxima should be asymmetric and more narrow than in an ensemble of different events. Due to a stronger absorption of particles emitted from the inner part of the shock, the outer two peaks may have different amplitudes. We think that these effects can be observed by measuring three–particle correlations.
There is one more reason for broadening of the –distributions which one should keep in mind when comparing with experimental data: due to the momentum spread of the initial parton distributions, GeV, the di–jet system has a nonzero total momentum with respect to the global CMF. As a consequence, the angle between the trigger– and the away–side jet is generally speaking not equal to , as was assumed above. Taking typical momenta of initial partons as , with GeV [45, 46, 47, 48], we estimate the angular spread as . Therefore, the considered broadening should be much less than the typical shift of the Mach angles due to the collective flow.
5 Angular Correlations of Jets – Can jets fake the large -values observed?
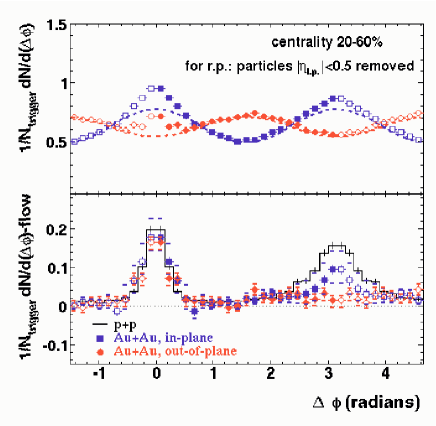
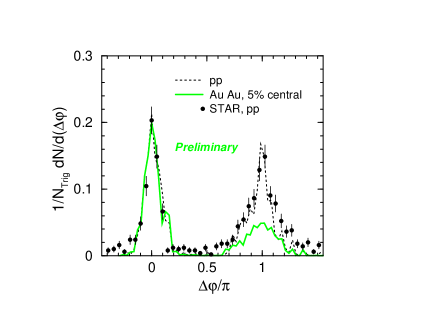
Figure 4 shows the angular correlation of high- particles for the 5% most central Au+Au collisions at = 200 GeV as well as reactions from the HSD-model [55] in comparison to the data from STAR for collisions [45]. Gating on high- hadrons (in the vacuum) yields near–side correlations in Au+Au collisions which are close to the near–side correlations observed for jet fragmentation in the vacuum (p+p). This is in agreement with the experimental observation [45, 57]. However, for the away–side jet correlations, the authors of Ref. [55] get only a 50% reduction, similar to HIJING, which has only parton quenching and neglects hadron rescattering. Clearly, the observed [45] complete disappearance of the away–side jet (see Fig. 5) cannot be explained in the HSD-(pre-)hadronic cascade even with a small formation time of fm/c. Hence, the correlation data provide another clear proof for the existence of the bulk plasma.
The question if the attenuation of jets of GeV/c can actually fake the observed -values at GeV/c comes about since due to fragmentation and rescattering a lot of momentum-degraded hadrons will propagate in the hemisphere defined by the jets. However, their momentum dispersion perpendicular to the jet direction is so large that it could indeed fake a collective flow that is interpreted as coming from the early high-pressure plasma phase.
On first sight, Fig. 5 shows that this could indeed be the case: the in-plane correlations are aligned with the jet axis, the away–side bump, usually attributed to collective flow (dashed line), could well be rather due to the stopped, fragmented and rescattered away–side jet. However, this argument is falsified by the out-of-plane correlations (circles in Fig. 5). The near-side jet is clearly visible in the valley of the collective flow distribution. Note that peaks at relative to the jet axis! The away–side jet, on the other hand, has completely vanished in the out-of-plane distribution (cf. Fig. 6).
Where are all the jet fragments gone and why is there no trace left? Even if the away–side jet fragments completely and the fragments get stuck in the plasma, leftovers should be detected at momenta below GeV/c. Hadronic models as well as parton cascades will have a hard time to get a quantitative agreement with these exciting data.
We propose future correlation measurements which can yield spectroscopic information on the plasma:
-
•
If the plasma is a color-electric plasma [37, 59], experiments will - in spite of strong plasma damping - be able to search for wake-riding potential effects. The wake of the leading jet particle can trap comoving companions moving through the plasma in the wake pocket with the same speed as the leading particle. This can be particular stable for charmed jets due to the deadcone effect (proposed by Kharzeev et al. [60]) which will guarantee little energy loss, i.e. constant velocity of the leading D-meson. The leading D-meson will practically have very little momentum degradation in the plasma and therefore the wake potential following the D will be able to capture the equal speed companion, which can be detected [61].
-
•
The sound velocity of the expanding plasma might be measured by the emission pattern of the plasma particles travelling sideways with respect to the jet axis: The dispersive wave generated by the wake of the jet in the plasma yields preferential emission to an angle relative to the jet axis given by the ratio of the leading jet particles’ velocity, devided by the sound velocity in the hot dense plasma rest frame. The speed of sound for a non-interacting gas of relativistic massless plasma particles is , while for a plasma with strong vector interactions, holds. Hence, the emission angle measurement can yield information of the interactions in the plasma. A hydrodynamical study of this point will be discussed in the following.
6 (3+1)dimensional hydrodynamical study of jet evolution


The STAR and PHENIX collaborations published the observation [45, 62, 57] that the away–side jet in Au+Au collisions for high- particles ((trigger) GeV/c, (assoc) GeV/c) with pseudo-rapidity 0.7 is suppressed as compared to the away–side jet in p+p collisions (see Fig. 5).
This is commonly interpreted as parton energy loss, the so-called jet quenching [37, 63]. One part of the back-to-back jet created in the collision escapes (near-side jet), the other one (away–side jet) deposits a large fraction of its energy into the dense matter.
We use (3+1)dimensional ideal hydrodynamics, employ the (3+1)dimensional SHASTA (SHarp And Smooth Transport Algorithm) [64], and follow the time evolution of a fake jet that deposits its energy and momentum completely during a very short time in a 2 fm3 spatial volume of a spherically symmetric expanding system.
The medium has an initial radius of fm, an initial energy density of and an initial profile velocity increasing by radius as .
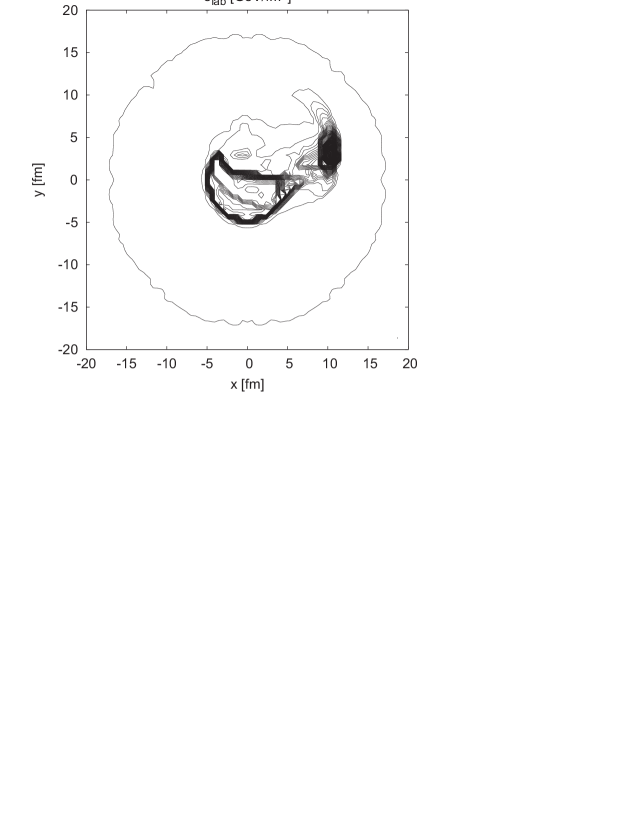
The initial energy density of the jet is increased by as compared to the medium and the jet material has an initial velocity of c. In Fig. 7 we display the contour plots of the jet evolution at late state fm/c for an ultrarelativistic ideal gas EoS (upper row) and a hadron gas with a first-order phase transition to QGP (lower row). The jet is initially located in the region between (left column) and in the retion between (right column).


The jet-induced shock front and a deflection of the jet for a finite impact parameter is clearly visible. Note, that in case of the Bag Model EoS the system reaches the mixed-phase. Therefore, the hydrodynamical evolution slows down and causes a broadend shock wave.
Figure 8 shows the azimuthal angular distributions of the laboratory energy at fm/c for an ideal gas EoS (left) and for a hadron gas with first-order phase transition to QGP (right). Here, the jet was originally located between . One clearly sees that sideward peaks occur in case of a first-order phase transition. They are a signal of conical emission and agree well with the 2 and 3 particle correlations from STAR and PHENIX [45, 62, 57].
7 Summary
The NA49 collaboration has observed the collapse of both, - and -collective flow of protons, in Pb+Pb collisions at 40 A GeV, which presents evidence for a first-order phase transition in baryon-rich dense matter. It will be possible to study the nature of this transition and the properties of the expected chirally restored and deconfined phase both at the HiMu/low energy and at the forward fragmentation region at RHIC, with upgraded and/or second generation detectors, and at the future GSI facility FAIR. According to lattice QCD results [1, 2], the first-order phase transition occurs for chemical potentials above 400 GeV. Ref. [44] shows that the elliptic flow clearly distinguishes between a first-order phase transition and a crossover. Thus, the observed collapse of flow, as predicted in Ref. [11, 12], is a clear signal for a first-order phase transition at the highest baryon densities.
A critical discussion of the use of collective flow as a barometer for the EoS of hot dense matter at RHIC showed that hadronic rescattering models can explain of the observed flow, , for GeV/c. We interpret this as evidence for the production of superdense matter at RHIC with initial pressure way above hadronic pressure, GeV/fm3.
The fluctuations in the flow, and , should be measured. Ideal hydrodynamics predicts that they are larger than 50 % due to initial state fluctuations. The QGP coefficient of viscosity may be determined experimentally from the fluctuations observed.
We propose upgrades and second-generation experiments at RHIC, which inspect the first-order phase transition in the fragmentation region, i.e., at MeV ( A GeV or at full energy), where the collapse of the proton flow analogous to the 40 A GeV data should be seen.
The study of jet-wake-riding potentials and bow shocks caused by jets in the QGP formed at RHIC can give further clues on the EoS and transport coefficients of the QGP.
8 Acknowledgements
We like to thank M. Bleicher, I. Mishustin, K. Paech, H. Petersen, D. Rischke and L. Satarov for discussions.
References
- [1] Z. Fodor and S. D. Katz, JHEP 0203 (2002) 014; JHEP 0404 (2004) 050.
- [2] F. Karsch, J. Phys. G 30 (2004) S887; F. Karsch,hep-ph/0701210.
- [3] R. Anishetty, Peter Koehler, and Larry D. McLerran, Phys. Rev. D 22 (1980) 2793.
- [4] S. Date, M. Gyulassy, and H. Sumiyoshi, Phys. Rev. D 32 (1985) 619.
- [5] C. Greiner, P. Koch, and H. Stöcker, Phys. Rev. Lett. 58 (1987) 1825; C. Greiner, D. H. Rischke, H. Stöcker, and P. Koch, Phys. Rev. D 38 (1988) 2797.
- [6] P. Koch, B. Müller, and J. Rafelski, Phys. Rept. 142 (1986) 167; I. Zakout, C. Greiner, and J. Schaffner-Bielich, Nucl. Phys. A 781 (2007) 150; J. Schaffner, C. B. Dover, A. Gal, C. Greiner, D. J. Millener, and H. Stöcker, Annals Phys. 235 (1994) 35; J. Schaffner, C. B. Dover, A. Gal, C. Greiner, and H. Stöcker, Phys. Rev. Lett. 71 (1993) 1328.
- [7] E. L. Bratkovskaya et al., Phys. Rev. C 69 (2004) 054907.
- [8] J. Cleymans and K. Redlich, Phys. Rev. C60 (1999) 054908.
- [9] L. V. Bravina et al., Phys. Rev. C 60 (1999) 024904; Nucl. Phys. A 698 (2002) 383.
- [10] I. G. Bearden et al., Phys. Rev. Lett. 90 (2003) 102301.
- [11] J. Hofmann, H. Stöcker, W. Scheid, and W. Greiner, Report of the Int. Workshop on BeV/Nucleon Collisions of Heavy Ions: How and Why, Bear Mountain, New York, Nov. 29 - Dec. 1, 1974 (BNL-AUI 1975).
- [12] J. Hofmann, H. Stöcker, U. W. Heinz, W. Scheid, and W. Greiner, Phys. Rev. Lett. 36 (1976) 88.
- [13] R. A. Lacey and A. Taranenko, nucl-ex/0610029.
- [14] L.D. Landau and E.M. Lifshitz, Fluid Mechanics, Pergamon Press, New York, 1959.
- [15] H. Stöcker, J. Hofmann, J. A. Maruhn, and W. Greiner, Prog. Part. Nucl. Phys. 4 (1980) 133.
- [16] H. Stöcker, J. A. Maruhn, and W. Greiner, Phys. Rev. Lett. 44 (1980) 725.
- [17] H. Stöcker et al., Phys. Rev. Lett. 47 (1981) 1807.
- [18] H. Stöcker et al., Phys. Rev. C 25 (1982) 1873.
- [19] H. Stöcker and W. Greiner. Phys. Rept. 137 (1986) 277.
- [20] L. P. Csernai and D. Röhrich, Phys. Lett. B 458 (1999) 454.
- [21] L. P. Csernai et al., hep-ph/0401005.
- [22] D. H. Rischke, Y. Pürsün, J. A. Maruhn, H. Stöcker, and W. Greiner, Heavy Ion Phys. 1 (1995) 309.
- [23] W. Schmidt et al., Phys. Rev. C 47 (1993) 2782.
- [24] A. Muronga, Heavy Ion Phys. 15 (2002) 337.
- [25] A. Muronga, Phys. Rev. C 69 (2004) 034903.
- [26] J. Brachmann et al., Nucl. Phys. A 619 (1997) 391.
- [27] M. Hofmann et al., nucl-th/9908031.
- [28] C. Hartnack et al., Nucl. Phys. A 495 (1989) 303c.
- [29] S. A. Bass, M. Gyulassy, H. Stöcker, and W. Greiner, J. Phys. G 25 (1999) R1.
- [30] W. Cassing and E. L. Bratkovskaya, Phys. Rept. 308 (1999) 65.
- [31] H. Weber, E. L. Bratkovskaya, W. Cassing, and H. Stöcker, Phys. Rev. C 67 (2003) 014904.
- [32] A. Andronic et al., Phys. Rev. C 67 (2003) 034907.
- [33] A. Andronic et al., Phys. Rev. C 64 (2001) 041604.
- [34] S. Soff, S. A. Bass, M. Bleicher, H. Stöcker, and W. Greiner, nucl-th/9903061.
- [35] P. K. Sahu and W. Cassing, Nucl. Phys. A 672 (2000) 376.
- [36] P. K. Sahu and W. Cassing, Nucl. Phys. A 712 (2002) 357.
- [37] H. Stöcker, Nucl. Phys. A 750 (2005) 121.
- [38] J. Brachmann, PhD thesis, J. W. Goethe - Universität Frankfurt am Main, 2000.
- [39] J. Brachmann et al., Phys. Rev. C 61 (2000) 024909.
- [40] K. Paech, M. Reiter, A. Dumitru, H. Stöcker, and W. Greiner, Nucl. Phys. A 681 (2001) 41.
- [41] C. Alt et al., Phys. Rev. C 68 (2003) 034903.
- [42] A. Andronic et al., Nucl. Phys. A 679 (2001) 765.
- [43] A. Andronic, Nucl. Phys. A 661 (1999) 333.
- [44] K. Paech, H. Stöcker, and A. Dumitru, Phys. Rev. C 68 (2003) 044907; Phys. Rev. C 62 (2000) 064611.
- [45] C. Adler et al. [STAR collaboration], Phys. Rev. Lett. 90 (2003) 082302; L. Molnar, nucl-ex/0701061.
- [46] C. Adler et al. [STAR collaboration], Phys. Rev. Lett. 91 (2003) 072304; S. S. Adler et al. [PHENIX collaboration], Phys. Rev. D 74 (2006) 072002.
- [47] Fuqiang Wang [STAR collaboration], J. Phys. G 30 (2004) S1299; J. G. Ulery and F. Wang, nucl-ex/0609017; F. Wang, Nucl. Phys. A 783 (2007) 157; F. Wang, nucl-ex/0610027.
- [48] B. Jacak [PHENIX collaboration], N.N. Ajitanand [PHENIX collaboration], talks at Int. Conf. on Physics and Astrophysics of Quark Gluon Plasma, Kolkata, India, 2005; B. Jacak [PHENIX collaboration], J. Phys. Conf. Ser. 50 (2006) 22.
- [49] D. H. Rischke, H. Stöcker, and W. Greiner, Phys. Rev. D 42 (1990) 2283.
- [50] G.F. Chapline and A. Granik, Nucl. Phys. A 459 (1986) 681.
- [51] A.E. Glassgold, W. Heckrotte, and K.M. Watson, Ann. Phys. 6 (1959) 1.
- [52] V.A. Khodel, N.N. Kurilkin, and I.N. Mishustin, Phys. Lett. B 90 (1980) 37.
- [53] J. Casalderrey–Solana, E.V. Shuryak, and D. Teaney, J. Phys. Conf. Ser. 27 (2005) 22; J. Casalderrey-Solana, hep–ph/0701257; F. Antinori and E. V. Shuryak, J. Phys. G 31 (2005) L19.
- [54] L. M. Satarov, H. Stöcker, and I. N. Mishustin Phys. Lett. B 627 (2005) 64.
- [55] W. Cassing, K. Gallmeister, and C. Greiner, J. Phys. G 30 (2004) 801.
- [56] W. Cassing, K. Gallmeister, and C. Greiner, Nucl. Phys. A 735 (2004) 277.
- [57] A. Sickles [PHENIX collaboration], nucl-ex/0702007.
- [58] H. G. Baumgardt et al., Z. Phys. A 273 (1975) 359.
- [59] J. Ruppert and B. Müller, Phys. Lett. B 618 (2005) 123.
- [60] D. Kharzeev, private communication.
- [61] W. Schäfer, H. Stöcker, B. Müller, and W. Greiner, Z. Phys. A 288 (1978) 349.
- [62] J. Adams et al. [STAR collaboration], Phys. Rev. Lett. 91 (2003) 072304.
- [63] M. Gyulassy, P. Levai, and I. Vitev, Nucl. Phys. B 594 (2001) 371.
- [64] D. H. Rischke, S. Bernard, and J. A. Maruhn, Nucl. Phys. A 595 (1995) 346.