Multiplicity Fluctuations in Proton-Proton and Nucleus-Nucleus Collisions
Abstract
We study the scaled variances of multiplicity fluctuations in nucleus-nucleus collisions at SPS and RHIC energies within the HSD transport model. The HSD results are compared with proton-proton data and with predictions of the hadron-resonance gas statistical model. We find that the HSD scaled variances for negatively, positively, and all charged hadrons in central nucleus-nucleus collisions remain close to the values in proton-proton collisions and increase with collision energy as the corresponding multiplicities per participating nucleon. The statistical model predicts very different behavior of . However, a comparison with preliminary NA49 data for the most central Pb+Pb collisions at SPS energies does not permit to distinguish the HSD and statistical model results. New measurements of the multiplicity fluctuations in nucleus-nucleus collisions in a wide energy region with large acceptance are needed to allow for a proper determination of the underlying dynamics.
keywords:
nucleus-nucleus collisions , fluctuations , transport models , statistical modelsPACS:
24.10.Lx , 24.60.-k , 24.60.Ky , 25.75.-q, , and
The event-by-event fluctuations in high energy nucleus-nucleus (A+A) collisions (see e.g., the reviews [1, 2]) are expected to be closely related to the transition between different phases of the QCD matter. Measuring the fluctuations one might observe anomalies of the onset of deconfinement [3] and dynamical instabilities when the expanding system goes through the 1-st order transition line between the quark-gluon plasma and the hadron gas [4]. Furthermore, the QCD critical point may be signaled by a characteristic pattern in fluctuations [5]. In the present paper we calculate the multiplicity fluctuations in central A+A collisions at SPS and RHIC energies within the microscopic Hadron-String-Dynamics (HSD) transport model [6] which gives rather reliable description for the inclusive spectra of charged hadrons in A+A collisions from SIS to RHIC energies [7].
For a quantitative measure of the particle number fluctuations it is convenient to use the scaled variances,
| (1) |
where denotes event-by-event averaging and the index means “-”, “+”, and “ch”, i.e negative, positive, and all charged final state hadrons. The compilation of proton-proton (p+p) data for and are taken from Ref. [1] and presented in Fig. 1. The energy dependence can be parameterized by the functions [1]:
| (2) |
where is the center of mass energy.
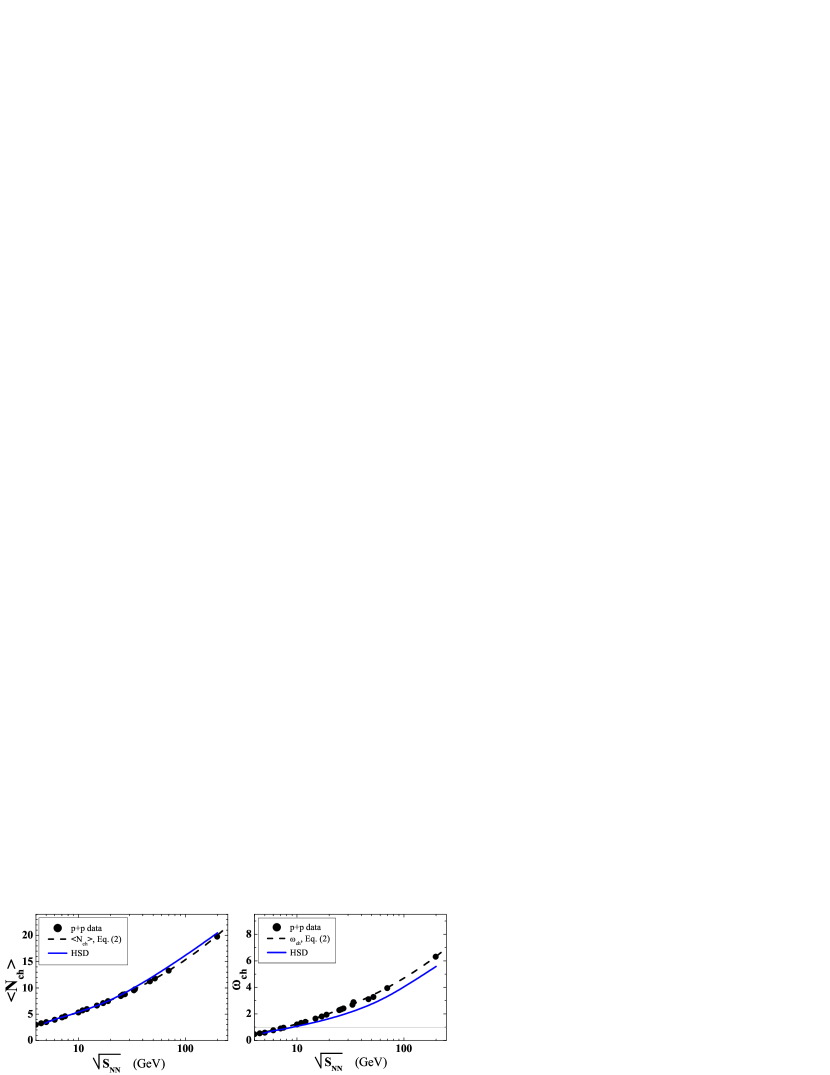
The HSD model description of the p+p data (for p+p reaction this is almost equivalent to the Lund-String model [8]) is shown in Fig. 1 by the solid lines. It gives a good reproduction of the p+p data for , but slightly underestimates at high collision energies. For negative and positive charged hadrons the average multiplicities and scaled variances in p+p collisions can be presented in terms of the corresponding quantities for all charged particles,
| (3) |
In general, one can define two groups of hadron observables. The first group includes observables which are rather similar in A+A and p+p collisions, thus, they can be reasonably described within the wounded nucleon model (WNM) [11] which treats the final state in A+A collisions as the result of independent nucleon-nucleon (N+N) collisions. The second group consists of A+A observables which are very different from those in p+p collisions (e.g. collective flow, multi-strange baryon production). The question arises: Are the multiplicity fluctuations in A+A collisions close to those in p+p reactions, or are they very different?
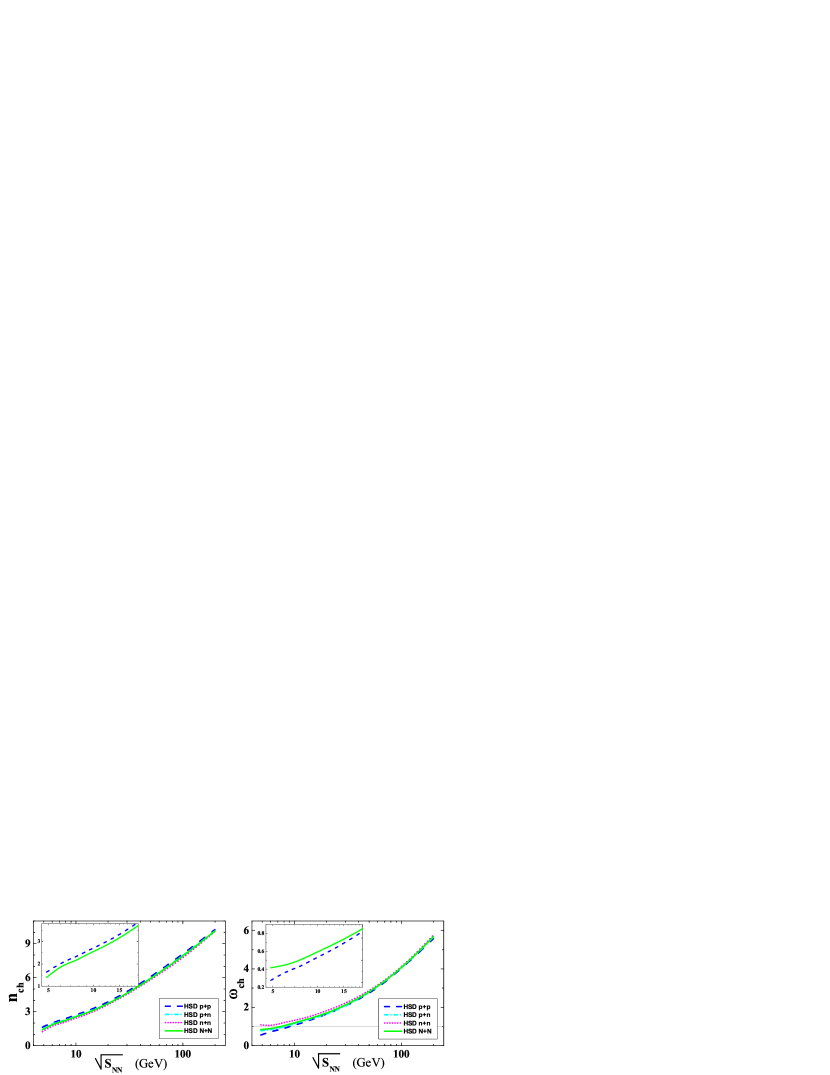
To answer this question let us first consider the model predictions. To compare central collisions of heavy nuclei and N+N collisions within the HSD model we construct the multiplicities and scaled variances of N+N reactions using the HSD results for p+p, p+n and n+n collisions:
| (4) |
| (5) |
where are the probabilities of proton-proton, proton-neutron, and neutron-neutron collisions in Pb+Pb (A=208, Z=82) or Au+Au (A=197, Z=79) reactions. The results for and collisions – presented in Fig. 2 – are very close to each other. A small difference between p+p and N+N collisions (%) is only seen at SPS energies (shown separately in the upper left corners) and gradually disappears at RHIC energies.
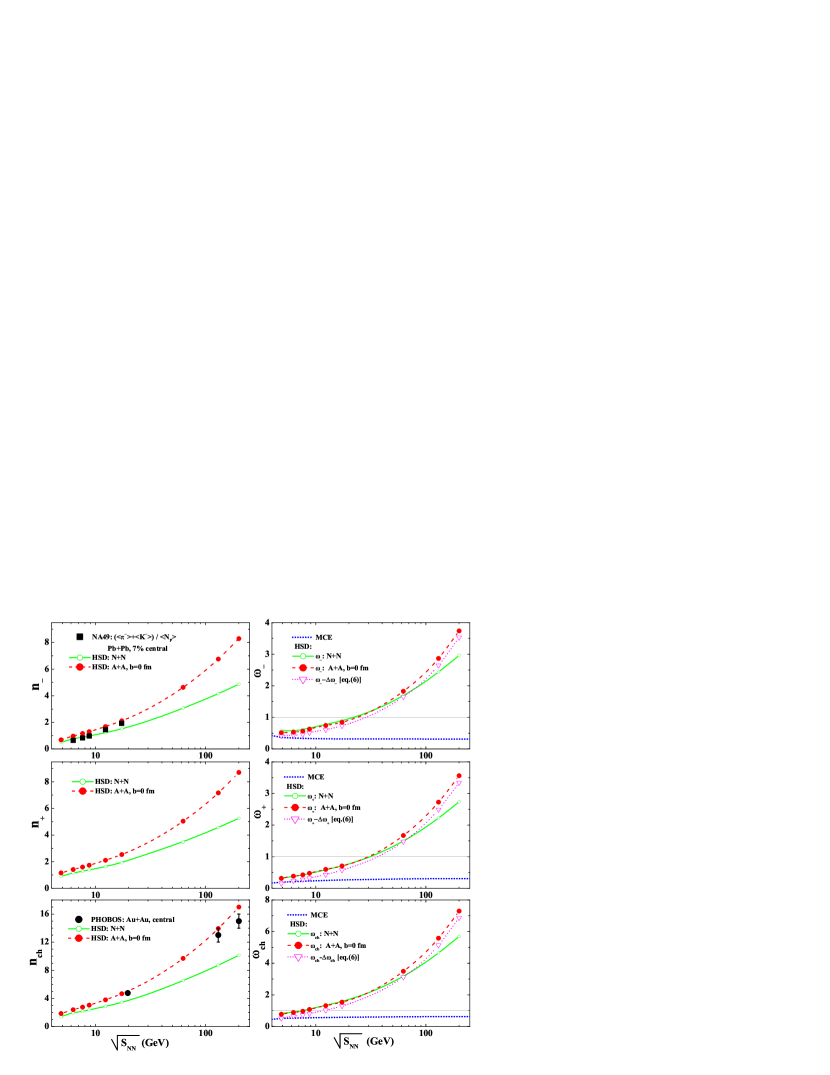
In Fig. 3 the HSD model results are shown for the multiplicities per participating nucleons, , and for the scaled variances, , in central collisions (zero impact parameter, ) of Pb+Pb at , 20, 30, 40, 80, 158 AGeV and Au+Au at , 130, 200 GeV. From Fig. 3 one concludes that the HSD results for the scaled variances in central A+A collisions are close to those in N+N collisions. For the SPS energy region all scaled variances, and , in central A+A collisions are slightly below the N+N results. The reversed situation is observed for RHIC energies. Thus, the HSD results for multiplicity fluctuations are rather similar to those of the WNM. This is in agreement with our previous finding [12]. For the samples with a fixed number of nucleon participants, , in Pb+Pb collisions at 158 AGeV, HSD shows fluctuations of the final hadrons close to those in N+N collisions at the same energy. This happens to be also valid for most central collisions () considered in the present study. To estimate the influence of participant number fluctuations we calculate the scaled variance, , in the HSD simulations. The participant number fluctuations are found to be rather small for collisions with . For example, in Pb+Pb collisions with at 158 AGeV the mean number of participants is , and the scaled variance is . The additional fluctuations, , of th hadrons due to participant number fluctuations can be estimated as [12],
| (6) |
The HSD results for after subtraction of the contributions (6) are shown in Fig. 3 by open triangles. The contributions to due to participant number fluctuations estimated by Eq. (6) are small, and they do not explain the (positive) difference, AANN seen in Fig. 3 at GeV.
In the statistical model the scaled variances for the ideal Boltzmann gas in the grand canonical ensemble (GCE). The deviations of from unity in the hadron-resonance gas (HG) model stem from Bose and Fermi statistics, resonance decays, and exactly enforced conservations laws within the canonical ensemble (CE) or micro-canonical ensemble (MCE) [13, 14]. Note that the statistical model gives no predictions for the energy dependence of hadron multiplicities. All yields are proportional to the system volume which is a free model parameter fitted to the multiplicity data at each collision energy. However, the statistical model does predict the scaled variances as to become independent of the system volume for large systems. In Fig. 3 the scaled variances calculated within the MCE HG model along the chemical freeze-out line (see Ref. [13] for details) are presented by the dotted lines: reach their asymptotic values at RHIC energies, (MCE) and (MCE). The corresponding results in the GCE and CE are the following: (GCE) and (GCE), (CE) and (CE). The HSD results for in central A+A collisions are very different. They remain close to the corresponding values in p+p collisions and, thus, increase with collision energy as . One observes no indication for ‘thermalization’ of fluctuations in the HSD results. This is especially seen for RHIC energies: (HSD)(MCE) at GeV.
Recently first measurements of fluctuations of particle multiplicity [15, 16, 17] and transverse momenta [18] in A+A collisions have been performed. The scaled variance for negatively, positively, and all charged hadrons was measured as a function of centrality at SPS [15, 16] and RHIC [17] energies. It has been argued in Ref. [12] that the final multiplicity fluctuations seen in the NA49 data [15] at the SPS are a straightforward consequence of the fluctuations in the number of nucleon participants (see also the discussion in Ref. [19]). It seems that the same conclusion [20] is valid for the RHIC data [17]. In the language of statistical models, the fluctuations of the number of nucleon participants correspond to volume fluctuations, hence, they translate directly to the final multiplicity fluctuations. To avoid these ‘trivial’ fluctuations, one has to select a sample of very central, , collisions. Such a rigid centrality selection has been recently done for the NA49 data [21] by fixing the number of projectile participants, .
The HG model was compared with the NA49 data [21] for the sample of 1% most central collisions at the SPS energies, AGeV in Ref. [13]. It was found that the MCE results for are very close to the data, they are shown by the dashed lines in Fig. 4. The NA49 acceptance probabilities for positively and negatively charged hadrons are approximately equal, and their numerical values are: , 0.063, 0.085, 0.131, 0.163, at the SPS energies of 20, 30, 40, 80, 158 AGeV, respectively. In the statistical model the scaled variances for the accepted particles are calculated from in the full space according to the acceptance scaling formulae (see Ref. [13] for details):
| (7) |
Note that the energy dependence of seen in Fig. 4 is strongly influenced by an increase with energy of the acceptance parameter : only about 4% of the hadrons are detected at 20 AGeV and 16% at 158 AGeV.
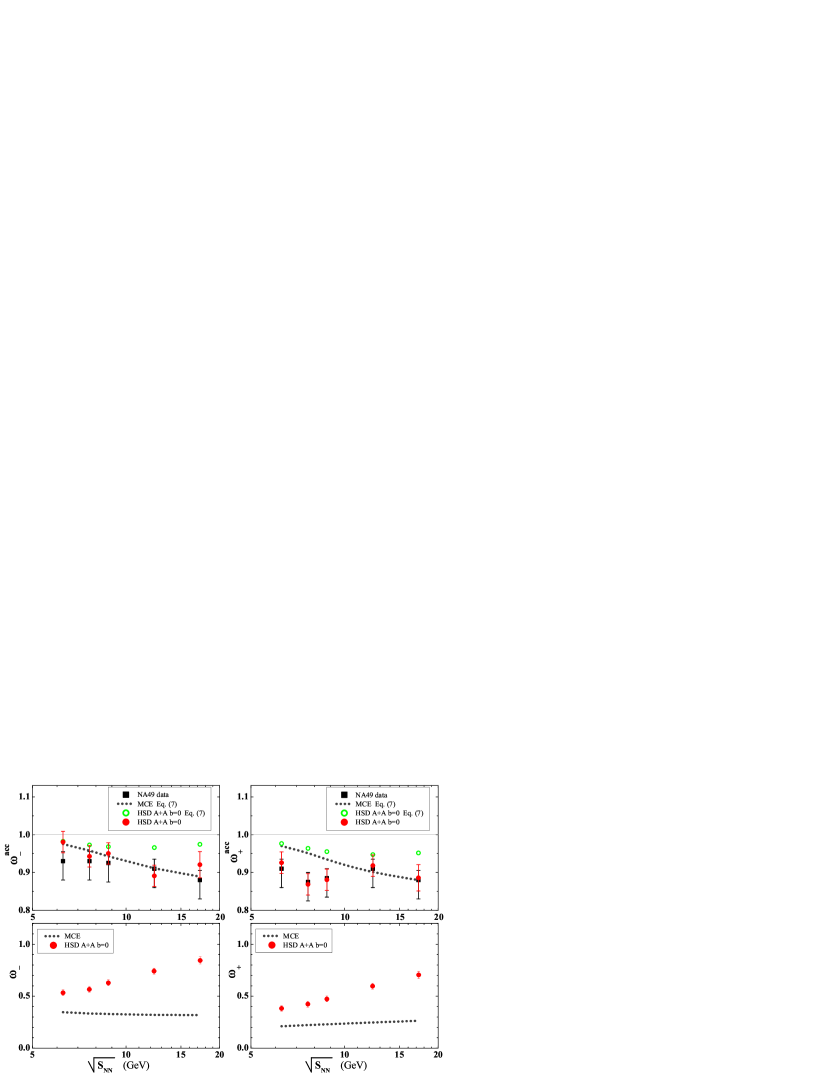
The comparison of the HSD results for central Pb+Pb collisions (zero impact parameter, ) with the preliminary NA49 data of 1% most central collisions, selected by the number of projectile spectators, is presented in Fig. 4. It demonstrates a good agreement of the HSD results with the preliminary NA49 data. There are also no essential differences between the MCE HG model and the HSD transport model results. Several comments are needed at this point: The HSD results for calculated within the NA49 acceptance (full circles in Fig. 4) lead to smaller values of than those obtained with the acceptance scaling formulae (7) (open circles in Fig. 4), i.e. to the violation of the acceptance scaling formulae (7). This difference may lead to a 10% effect in for the NA49 acceptance conditions. Thus, the MCE results for may also be about 10% smaller than those obtained from Eq. (7) shown in the upper panel of Fig. 4.
The lower panel of Fig. 4 demonstrates that the MCE and HSD results for at the lowest SPS energy 20 AGeV are accidentally rather close to each other. They both are also close to in p+p collisions (cf. Figs. 2 and 3). The HSD scaled variances increase with collision energy. In contrast, the MCE values remain approximately constant. The ratio of the HSD to MCE values of reaches about the factor of 2 at the highest SPS energy 158 AGeV. It becomes a factor of 10 at the top RHIC energy GeV. However, the rigid centrality selection is absent for the available RHIC fluctuation data. Due to this reason the participant number fluctuations give a dominant contribution to . On the other hand, for the SPS data the small values of the acceptance, , and 10% possible ambiguities coming from Eq. (7) almost mask the difference between the HSD and MCE results (Fig. 4, upper panel).
In summary, we have used the HSD transport model to study the particle number fluctuations in central A+A collisions at SPS and RHIC energies. HSD predicts that the scaled variances in central A+A collisions remain close to the corresponding values in p+p collisions and increase with collision energy as the multiplicity per participating nucleon, i.e. . The scaled variances calculated within the statistical HG model along the chemical freeze-out line show a rather different behavior: approach finite values at high collision energy. At the top RHIC energy, GeV, the HSD values of (HSD) is already about 10 times larger than the corresponding MCE HG values of (MCE).
The HSD and HG scaled variances show a different energy dependence such that the deviation grows with increasing energy. However, a comparison with preliminary NA49 data of very central, , Pb+Pb collisions at the SPS energy range does not distinguish between the HSD and MCE HG results due to two reasons: First, the MCE HG and HSD results for at SPS energies are not too much different from each other and from in p+p collisions. Second, small experimental coverage of the acceptance, , and 10% possible ambiguities coming from the acceptance scaling relation (7) make the difference between the HSD and MCE HG results almost invisible.
Thus, our study shows a clear way to distinguish the different models by measuring the multiplicity fluctuations. However, the later are very sensitive to the experimental acceptance, such that new measurements of for very central A+A collisions with large acceptance at both SPS [22] and RHIC energies are required to allow for a proper determination of the underlying dynamics.
Acknowledgments. We would like to thank V.V. Begun, W. Cassing, M. Gaździcki, W. Greiner, M. Hauer, B. Lungwitz and H. Stöcker for useful discussions. One of the author (M.I.G.) is thankful to the Humboldt Foundation for financial support.
References
- [1] H. Heiselberg, Phys. Rep. 351, 161 (2001).
- [2] S. Jeon and V. Koch, Review for Quark-Gluon Plasma 3, eds. R.C. Hwa and X.-N. Wang, World Scientific, Singapore, 430-490 (2004) [arXiv:hep-ph/0304012].
- [3] M. Gaździcki, M. I. Gorenstein, and S. Mrowczynski, Phys. Lett. B 585, 115 (2004); M. I. Gorenstein, M. Gaździcki, and O. S. Zozulya, Phys. Lett. B 585, 237 (2004).
- [4] I.N. Mishustin, Phys. Rev. Lett. 82, 4779 (1999); Nucl. Phys. A 681, 56 (2001); H. Heiselberg and A.D. Jackson, Phys. Rev. C 63, 064904 (2001).
- [5] M.A. Stephanov, K. Rajagopal, and E.V. Shuryak, Phys. Rev. Lett. 81, 4816 (1998); Phys. Rev. D 60, 114028 (1999); M.A. Stephanov, Acta Phys. Polon. B 35, 2939 (2004);
- [6] W. Ehehalt and W. Cassing, Nucl. Phys. A 602, 449 (1996); W. Cassing and E.L. Bratkovskaya, Phys. Rep. 308, 65 (1999); W. Cassing, E. L. Bratkovskaya, and S. Juchem, Nucl. Phys. A 674 (2000) 249;
- [7] H. Weber, et al., Phys. Rev. C67, 014904 (2003); E.L. Bratkovskaya, et al., Phys. Rev. C 67, 054905 (2003); ibid, 69, 054907 (2004).
- [8] B. Andersson et al., Z. Phys. C 57, 485 (1993).
- [9] S.V. Afanasev et al., [NA49 Collaboration], Phys. Rev. C 66, 054902 (2002); T. Anticic et al., [NA49 Collaboration], Phys. Rev. C 69, 024902 (2004).
- [10] B.B. Back et al., [PHOBOS Collaboration], Nucl. Phys. A 715, 490c (2003).
- [11] A. Bialas, M. Bleszynski, and W. Czyz, Nucl. Phys. B 111, 461 (1976).
- [12] V.P. Konchakovski, et al., Phys. Rev. C 73, 034902 (2006); ibid. C 74, 064911 (2006).
- [13] V.V. Begun, et al., arXiv:nucl-th/0611075.
- [14] V.V. Begun, et al., Phys. Rev. C 70, 034901 (2004); ibid. C 71, 054904 (2005); ibid. C 72, 014902 (2005); A. Keränen, et al., J. Phys. G 31, S1095 (2005); J. Cleymans, K. Redlich, and L. Turko, Phys. Rev. C 71, 047902 (2005); J. Phys. G 31, 1421 (2005); F. Becattini, et al., Phys. Rev. C 72, 064904 (2005).
- [15] S.V. Afanasev et al., [NA49 Collaboration], Phys. Rev. Lett. 86, 1965 (2001); C. Roland et al., [NA49 Collaboration], J. Phys. G 30 S1381 (2004); M. Rybczynski et al., [NA49 Collaboration], J. Phys. Conf. Ser. 5, 74 (2005); C. Alt et al., [NA49 Collaboration], nucl-ex/0612010.
- [16] M.M. Aggarwal et al., [WA98 Collaboration], Phys. Rev. C 65, 054912 (2002).
- [17] J. Adams et al., [STAR Collaboration], Phys. Rev. C 69, 044905 (2003); Z.W. Chai et al., [PHOBOS Collaboration], J. Phys. Conf. Ser. 37, 128 (2005); J.T. Mitchell [PHENIX Collaboration], J. Phys. Conf. Ser. 27, 88 (2005).
- [18] H. Appelshauser et al. [NA49 Collaboration], Phys. Lett. B 459, 679 (1999); D. Adamova et al., [CERES Collaboration], Nucl. Phys. A 727, 97 (2003); T. Anticic et al., [NA49 Collaboration], Phys. Rev. C 70, 034902 (2004); S.S. Adler et al., [PHENIX Collaboration], Phys. Rev. Lett. 93, 092301 (2004); J. Adams et al., [STAR Collaboration], Phys. Rev. C 71, 064906 (2005).
- [19] M. Gaździcki and M.I. Gorenstein, Phys. Lett. B 640, 155 (2006).
- [20] V.P. Konchakovski, E.L. Bratkovskaya, and M.I. Gorenstein, in preparation.
- [21] B. Lungwitz et al. [NA49 Collaboration], arXiv:nucl-ex/0610046.
- [22] M. Gaździcki et al. [NA49 Collaboration], arXiv:nucl-ex/0612007.