Partial-wave analysis of nucleon scattering
Abstract
Abstract
We have performed a partial-wave analysis of K+-nucleon scattering in the momentum range from 0 to 1.5 GeV/c addressing the uncertainties of the results and comparing them with several previous analyses. It is found that the treatment of the reaction threshold behavior is particularly important. We find a T=0 scattering length which is not consistent with zero, as has been claimed by other analyses. The T=0 phase shifts for are consistent with a pure spin-orbit potential. Some indications for the production of a T=0 pentaquark with spin-parity D5/2+ are discussed.
I Introduction
The interaction of the meson with the nucleon has a number of interesting features. Because of lack of annihilation of the meson anti-quark there is no three-quark intermediate state possible so 3-q resonances are not possible. This lack of 3-body states leads to a feeble interaction, among the smallest among the strong forces.
This fact has been useful for probing the possible changes in nucleon structure and/or K+N interaction in the nuclear medium siegel1 ; siegel2 ; brown ; krauss ; weiss ; gal1 ; gal2 ; tolos . Following the measurement of the ratio of total cross sections krauss ; weiss , a number of suggestions were made to explain the results, among the principal ones being a partial deconfinement of quarks, an interaction with exchanged mesons in the nucleus and a modification of the K+N interaction through exchanged mesons. In order to understand which of these possible scenarios might be the right one, a detailed comparison with experiment is in order. One element in making calculations of the multiple scattering corrections which are crucial for this comparison is the availability of reliable phase shifts.
Of equal importance is the use of the KN system to test fundamental theories of hadronic interaction. There have been a number of theoretical studies of the K+N system using a variety of approaches barnes ; buttgen ; bender ; campbell ; veit ; cohen . The phase shifts from K+N scattering provide the principal data with which they compare.
There have been very little data taken (but see krauss ; weiss ) in an ordinary sense since the most recent partial-wave analyses martinoades ; hash ; martinrome ; martin ; arndt2 ; arndt1 ; hyslop ; corden ; martin78 ; martinpl ; nakajima ; kato ; cutkosky ; watts . The suggestion of the existence of a possible pentaquark resonance (see Ref. penta for a list of experiments claiming to see it, some of which have been withdrawn) might change the point of view of any analysis. The existence of the pentaquark is now considered doubtful by many.
A partial-wave analysis is particularly interesting in the region of the reaction threshold. The production of pions in the collision of two nucleons is often calculated with the “re-scattering” diagram which describes the formation of the resonance by the exchange of one pion. In the case of scattering this simple re-scattering process does not exist since the cannot emit a single pion, and other mechanisms must be considered. The excitation by exchange of a meson might be a natural process to consider, at least from the point of view of the exchange of heavy mesons. Additional information on this process can be obtained from a phase shift analysis which indicates which partial waves are participating in the production.
Section II describes our fitting method, Section III gives a description of the T=1 analysis, Section IV discusses the results of the T=1 analysis, and Section V gives the method for the T=0 analysis. Section VI discusses the results of the T=0 analysis and Section VII gives an overall summary and discussion of the results.
II Fitting Procedure
In the heart of any amplitude analysis lies the search for the (or a) minimum in a (or similar) measure for the best fit to the data. It is normally assumed that the numerical procedure for this minimization is straightforward and does not pose any problems, but that may not be the case. The technique that we use is very pedestrian but seemingly very sure. The is minimized on each parameter in turn sweeping through a significant number of them (88 for the T=1 case and 61 for the T=0 case including data normalizations). To minimize , each parameter is stepped by a fixed interval until the value of increases. At this point in the search three values of are known at three values of the parameter. A parabola is then passed through the three points and the position of the minimum is predicted. This procedure, in some form, is common to most methods of minimization although several methods treat the full parameter space as a vector. There is a difficulty that arises due to the fact that as a function of the parameter is very often not a perfect parabola. This means that the prediction of the minimum position (and hence value) is not the true minimum in this region and the value of predicted may exceed the one at the central (lowest) point. Since the middle point is very often the value obtained in the search on the previous parameter in the sequence, if the predicted value is always accepted, the ”current minimum” will increase in some cases. In our algorithm we test the predicted value of against the central value and if it is greater, the central (previous best) value is used instead.
This incorrect prediction is not a rare occurrence. We observed that it happened about 4% of the time when the search was far from the minimum and up to 40%-50% of the time when it was close to the minimum. If one decreases the step size, the deviation from a parabolic shape can be lessened, but there is a limit to this process since the difference between values of needed to predict the new minimum becomes small compared with their values and with finite precision another source of error becomes important, even with double precision (which we use). Hence, there is an inherent limit to how well the minimum can be found.
This limit depends on the details of the method used, of course, but also on the parameterization of the phase shifts. Different parameterizations will have different functions to replace the parabola, or perhaps more practically, will have a different importance of third order terms.
This inability to find perfectly the minimum (or minima) translates to a dependence of the final result on the starting values. Tests of the dependence on starting point were made by perturbing some of the parameters (typically two or three) until the was very large. For of the order of 100,000 the search usually was unable to find a sensible minimum but for in the range 10,000 to 20,000 a minimum was found near, but not identical, to the principal fit. A large number of sweeps through the parameters was needed (several tens of thousands). The results of these tests are given in the discussions of the T=1 and T=0 analyses.
A corresponding to each normalization was included in the total of the fit by adding
| (1) |
for each normalizing parameter, N, to the coming from the individual data points. The value of 0.03 was chosen for since it is a typical value for normalization errors.
The philosophy behind this procedure is that the normalization should be treated as an independent data point. In a typical model experiment the number of counts is registered in a set of counters and then those counts are multiplied by a normalization factor determined by the effective number of target particles, the beam flux etc. The errors in this normalization factor will be common to the cross sections for every counter. While this would appear to be the right statistical procedure, some care is needed in the interpretation of the results. Even if a significant discrepancy occurs in the normalization, it can be hidden if one simply looks at the total per data point in the case that there are a large number of points which accompany a single normalization. The large number of points dilute the total so that it is only slightly larger than the number of degrees of freedom. A distinction based solely on total requires the separation of a value of the reduced closer and closer to unity from unity. Practical difficulties arise since one can assume that the experimental errors have been estimated correctly only up to a certain level (experience would suggest something of the order of 5%). Hence the square of the errors in the denominator of the definition of leads to a sufficient error in its value that this method is impractical. This does not mean that a problem with the normalizations cannot be found, however. It simply means that one must examine the normalizations separately to verify that the the from the normalizations alone is not excessive.
III proton (T=1) analysis
The T=1 data base used consists of 1880 data points including 1501 angular distribution points, 91 total cross section points, 265 polarization points and 23 reaction cross section points. Much of these data are available from compilations compilation ; vpidb ; pdg but we try to give references to the original data as much as possible ehrlich ; bugg68 ; caldwell70 ; cool70 ; abrams70 ; bowen70 ; loken72 ; bowen72 ; barnett73 ; burnstein74 ; abe74 ; patton75 ; adams ; cook ; blandr ; blanda ; bettini ; filippas ; giakpp ; berthon ; fisk .
Of these points, four were removed because they were outliers. These were: two points from Ref. bowen70 at 0.686 and 0.717 GeV/c, and two from Ref. bugg68 at 0.713 and 1.029 GeV/c. The error on Ref. ehrlich polarization at 1.330 GeV/c and was doubled. The errors were doubled on the polarization set at 1.430 GeV/c ehrlich since the variation from point to point is greater than the errors quoted.

Partial waves through F7/2 were considered. The G and H waves were not needed to get a good fit. We write the partial-wave amplitudes as
| (2) |
where the sign corresponds to and is the Coulomb phase shift. No “inner” Coulomb corrections were made, the Coulomb effect being very small for the energies considered here.
The differential cross section, polarization and total cross section are expressed in terms of the amplitudes in the standard manner (see e.g. Hashimoto hash ) and will not be repeated here. The reaction cross section (essentially pion production) can be written as
| (3) |
so is independent of the phase shifts and can be particularly important in determining the . Here, and in what follows, denotes the momentum in the center of mass (in GeV/c unless otherwise noted) and is , i.e., in femtometers.
We have taken for the S- and P-wave phase shifts the form
| (4) |
The index, runs from 1 to 2 for the S wave and 1 to 3 for the P3/2 wave. There is only one term in the sum for the P1/2 wave.
For the D waves a simple polynomial is used
| (5) |
and only the lowest order was used for the F waves
| (6) |
The were parameterized allowing a different threshold, , for each partial wave. Below the threshold the values were unity and above threshold the form
| (7) |
was used except for the D3/2 partial wave which was represented by
| (8) |
The highest power of varied with partial wave, the greatest being 3 in the case of the P3/2 wave. For the F7/2 wave was taken as unity. The values of the parameters for our best fit are given in Tables 1 and 2.
The normalizations of 55 of the data sets was varied in the fitting procedure and their distribution is given in Fig. 1. The standard deviation of the normalizations was 2.2%, less than the 3% used for N in Eq. 1. The mean normalization was 1.0004 and only two normalizations gave an adjustment greater than 5%. The total is 2051 for a per data point of 1.09.


The phase shifts for the best fit are shown in Fig. 2 compared with three other analyses discussed below. At low energy (below threshold) the results are very similar to those of Martin martin .
Aside from the main fit, we performed tests for the degree of uniqueness of the minimum. Values of the parameters were altered in varying degrees such that the values were very large (generally of the order of 10,000) and the minimum search was restarted. This was done 6 times and the values of at the minima found are given in table 3. The values of were about 9 above the best fit except for case d where was about 20 above the best fit.


The fits found at these other minima are very similar to the original fit. The comparison is shown in Fig. 3. There it is seen that the fits are nearly identical below threshold (with the possible exception of case d) but above threshold there is a noticeable variation. In principle one can eliminate all fits but the principal solution on the grounds that the difference in is considerably larger than unity. In practice, however, since one can never be sure that the “true” minimum has been found, we consider the variation among the fits (excluding fit d) as a conservative estimate of the error in the determination of the phase shifts and inelasticities.
III.1 Other Work for T=1
Leaving aside many of the earlier analyses martinoades ; martinrome ; corden ; martin78 ; martinpl ; nakajima ; kato ; cutkosky ; watts there are three modern analyses with which we compare.
III.1.1 Analysis of Hashimoto
Hashimoto hash performed an energy-independent analysis for momenta from 0.6 to 1.5 GeV/c. Such an analysis has the advantage that no theoretical prejudices are inserted in the parameterization of the energy dependence but the disadvantage that S-matrix elements obtained at one energy do not share information from nearby energies which can result in large fluctuations from one energy to another. Observables sometimes have to be grouped to have enough data at a given energy. When amplitudes are slowly changing this does not lead to problems but at the threshold for pion production, where some of the amplitudes change rapidly, it can. Structure was seen in this analysis in the P3/2 and other partial waves.
III.1.2 Analysis of the VPI Group
The VPI group arndt2 ; arndt1 ; hyslop has published three analyses. In these fits the S-matrix elements for each partial wave were parameterized in the form of a K-matrix with one elastic and one inelastic channel. Structure is seen in these fits in the P3/2 wave very similar to that of Hashimoto. This led the group to suggest that there was a resonance in this wave and two analyses give the mass pole at 1.780 and 1.796 GeV/c2, corresponding to beam momenta of 0.971 and 1.005 GeV/c.
The onset of one-pion inelasticity was assumed to come about by the production of intermediate particles which then decayed to the system. Such a model is made very plausible by the experimental fact that pion production does not start at its threshold but some 200 MeV/c higher in momentum (see Figs. 4 and 5). Since the threshold is 340 MeV/c above pion threshold and the delta has considerable width, so that the production can start below that, it was the prime candidate. The K was considered as well but it has a higher threshold.
The VPI work arndt1 ; hyslop allowed renormalization in much the same way as described above in the present work. However, unlike the present case, substantial renormalization occurred with a number of the data sets being renormalized by more than 5%.
We inserted the VPI solution (including the G and H waves) into our program to compare with the data base used here to find a of 2810 for the 1880 points (a ratio of 1.49), which implies a fit very similar in quality to the original fit which was 1.73 or 1.25 depending on the case. Two points in the threshold of the reaction cross section (at 0.735 and 0.785 GeV/c) contribute 270 to the . If we remove these two points the ratio drops to 1.35. One cannot expect a closer agreement since their parameters were not fit to our data base and the phase shifts taken from the paper hyslop (or the web site) are quoted with a limited accuracy.


III.1.3 Analysis of Martin
Martin performed an analysis in which the partial-wave amplitudes were parameterized directly. The result is equivalent to the partial-wave expansion in terms of and discussed above and the correspondence is easily made.
Suppressing the partial-wave index, the Martin amplitudes have the form
| (9) |
| (10) |
was approximated by a polynomial in and a polynomial in where is the reaction (pion production) threshold (0.3106 GeV/c in the center of mass) and is the maximum C. M. momentum considered in the fit. Thus, the inelasticity (expressed in terms of ) has a form similar to that used in the present work but only a single threshold () was used for all partial waves.
In his fit Martin used G and H waves which were estimated by means of a dispersion relation calculation alcock . He did not give these values and they are no longer available so we were forced to set them to zero. These waves are only important at the higher energies so did not affect the calculations done for the nuclear scattering siegel1 ; siegel2 . However, for momenta above 1.2 GeV/c the Kaon-nucleon amplitude can not be accurately obtained from Martin’s phase shifts alone.
Martin listed several re-normalizations chosen by hand. The average value of these re-normalizations was 0.98 and the standard deviation was 0.067. Since these normalizations were changed by hand, no was accorded to them by Martin. With a fixed error of 0.03 they would have contributed 64.7 to the .
The Martin solution was also compared with our data base and we found a of 3023 for a ratio of 1.61. The same two reaction cross section points which contributed large in the case of the VPI group give a contribution to the of 446. If we remove these two points, the ratio becomes 1.37. Since the normalizations for the data were refit the test is not completely valid. The major discrepancy occurs for large beam momenta where the lack of G and H partial waves used in the original fit is most important. Removing the two reaction cross section points and all data above 1.2 GeV/c, we find a of 1372 for the 1132 points of the reduced data set or a ratio of 1.21 so that the quality of the fit approaches that quoted in the original paper which was 1.08.
IV Discussion for T=1
The values of the phase shifts and inelasticities for the obtained partial waves are given, compared with other analyses, in Fig. 2. The behavior of the amplitudes is also given in an Argand diagram in Fig. 6. We note that there is no counter clockwise behavior in the P3/2 partial wave as was observed in Nakajima et al. nakajima or Arndt et al. arndt1 ; arndt2 .
IV.1 Reaction Cross Section
The partitioning of the reaction cross section among the partial waves is given in Fig. 4. The lower part of Fig. 4 gives the comparison of the reaction cross sections calculated with those from Arndt et al. arndt2 and Martin martin . One notices that just above the threshold for pion production the reaction cross section remains very small for about 200 MeV/c. A similar thing is seen in nucleon-nucleon scattering and the usual interpretation is that pion production proceeds primarily by production with the threshold for the reaction cross section being governed by the mass of the .
In the present reaction, the threshold behavior can perhaps be explained again by production although the exchange of a single pion to form the is not possible since a pion cannot couple to the kaon. Another possibility is for the reaction to proceed by the excitation of the K∗(892). The VPI group arndt1 used these two intermediate states to model the threshold behavior. As can be seen from the insert in Fig. 4 they obtain a rise in the reaction cross section very similar to that obtained by Martin, neither of which is sufficiently rapid. In the case of the VPI group arndt1 this is because the K has a higher threshold (1.077 GeV/c in the laboratory) and, while the has about the right threshold (0.886 GeV/c in the Lab), it has a significant width which causes the onset of the reaction cross section to be gradual. However, Oset and Vicente Vacas oset had a reasonable success in reproducing the data by combining this mechanism with a chiral symmetry calculation.
Wyborny et al. wyborny included final-state interactions between the and kaon in the pion production channel and were able to produce a maximum in the P3/2 phase shift very similar to the one observed. Their result gives a shape closer to our results (or Martin’s) than to those of Hashimoto hash or Watts et al. watts with which they compared. Figure 7 shows the comparison of their calculation with the four sets of phase shifts considered here.
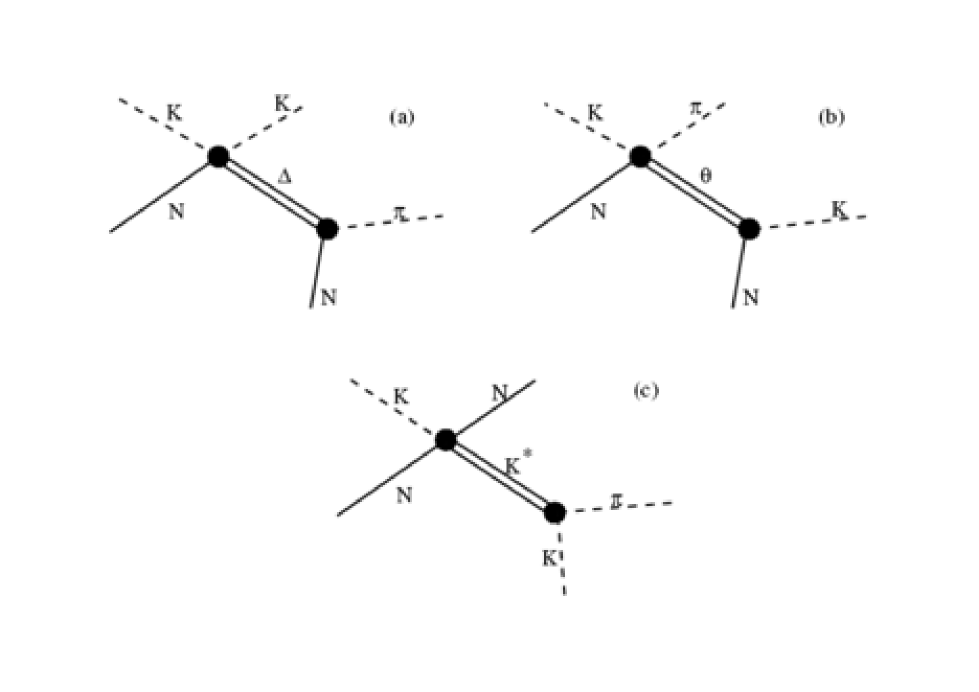
In order to have a rapid onset for the reaction cross section through the mechanism of an intermediate particle production, that particle must have a small width. An interesting possibility is pion production by the intermediate step of where is the much discussed pentaquark. Hyodo et al. hyodo have considered pion production in this reaction by this mechanism. The mass of the proposed pentaquark is thought to be around 1.54 GeV/c2 and its width very small. The threshold for production by this means (0.758 GeV/c in the Lab) is slightly lower than the threshold. The diagrams for these three possibilities are given in Fig. 8.
The separation of the reaction cross section into its partial-wave components may be of some help in sorting out the reaction mechanisms (see Figs. 4 and 5). If one assumes that the intermediate particle is produced at rest in the center of mass then it should be in a relative s-wave. For the case of the (with spin-parity 3/2+) in an s-wave, the only incident partial wave allowed is D3/2. It is interesting to note that in the present work, and in Martin’s analysis, this partial wave has very little reaction cross section and the VPI analysis arndt1 has only a moderate contribution. One possible explanation is that the production mechanism does not allow the formation of the -kaon final state in a relative s-wave. If we assume that it is produced in a relative p-wave then possibilities for the initial partial wave are P1/2, P3/2 and F5/2. We see that the P1/2 partial wave contributes a significant reaction cross section and the P3/2 partial wave also contains strength, although at slightly higher energies.
It is interesting to note that the D5/2 partial wave is important and, at least in the present work, dominates in the region 0.8 to 1.0 GeV/c. The Martin analysis also gives the dominant waves to be P3/2, P1/2 and D5/2 (Fig. 13). In our work it seems to be the D5/2 partial wave which accounts for the rapid rise in the region 0.8 to 0.9 GeV/c. If one were to assume that this increase corresponds to the threshold for production in the s-wave then the would have to have spin-parity 5/2+.
Bland et al. blanda measured the angular dependence of the pion production directly and found that production is in the P1/2 and P3/2 waves. They attempted a partial-wave analysis of the production although it was only possible to include a limited number of amplitudes. Their analysis indicated that the two P waves contributed about equally. They did not include the D5/2 wave in their study. In this same work blanda a model of formation by exchange was also presented which indicated that the expected ratio of P3/2 to P1/2 formation was 5:1, similar to what we find (Fig. 4).
Bland et al. blanda also found strong evidence for interference with an even parity partial wave. This effect became much larger for low beam momenta and invariant masses away from the central mass of the . This even partial wave was only present in the final charge states K0p and K+n and not in the state K+p where the kaon-nucleon system has isospin unity. Also observed in this paper was a strong asymmetry in the Daliz plot which, again, was not seen in the K+p final state. These observations suggest that the asymmetry may be linked to the production of a T=0 KN final state, again consistent with the presence of an isospin 0 particle. They blanda also studied the K production and were able to say that it occurred in a low angular momentum state consistent with our observation of a rise in the s-wave contribution in the region of the K threshold.
IV.2 Scattering Length
The value of the T=1 scattering length has been very stable over the years. Lévy-Leblond and Gourdin leblond obtained a scattering length of –0.34 fm in what was probably the first analysis. Hyslop et al. hyslop obtained a value of –0.33 fm, Cutkosky et al. cutkosky found –0.28 0.06 fm and Martin martin found –0.32 fm.
We obtain a central value of the s-wave scattering length of –0.308 fm from the best fit. One can estimate from the variation of minima in Table 3 an error of 0.002 fm. Fixing the scattering length at various values and re-fitting the rest of the parameters, one finds again an error of 0.002 fm. Adding the two errors in quadrature we can quote a value of –0.308 0.003 fm. While this error is that obtained with the present data set, it is so small that one would have to expect that the addition of new data would lead to a change of the same order or larger. We note that the average from Refs. hyslop , cutkosky and martin is –0.031 fm so our central value is what might be expected.
On the theory side, Barnes and Swanson barnes obtained, in a quark Born approximation, a scattering length of –0.35 fm. When this value was corrected for unitarity, by solving for scattering from a potential, the value became –0.22 fm.
IV.3 Scattering Volumes
The scattering volumes have always been estimated to be very small and are poorly determined. In early work, the p-waves were often neglected as input to the T=0 determinations. Cutkosky et al. cutkosky obtained –0.04 0.03 fm3 for the P1/2 wave and 0.02 0.02 fm3 for the P3/2 wave, for example. The values obtained in the present work are very dependent on the minimum found, unlike the scattering length. For the higher values of the scattering volumes are small, in agreement with Cutkosky et al. cutkosky but for the best fit, the volumes are somewhat larger in magnitude.


V Analysis for T=0
V.1 Data Treatment
The treatment of the isospin zero amplitude is more difficult since there exist no free neutron targets. What is normally used is scattering from the neutron contained in the deuteron. Modern analyses kamalov ; meissner suggest that scattering from the meson cloud is not a problem. There are only slightly more than half of the number of data points compared to the T=1 case and the reliability of the data is less, given that it must be extracted from deuteron data with corrections. Again most of the data can be obtained from compilations compilation ; vpidb ; pdg but we try to give references to original papers cook ; fisk ; ray ; giacomelli ; hirata69 ; hirata71 ; adams ; glasser ; slater ; carroll ; sakitt ; giacomellicex ; giacomelliel ; watts ; robertson ; damerell . Normally the neutron result is obtained assuming that the interactions of the kaon with the proton and neutron are independent. This is usually a good approximation except at low energies. However, the T=1 reaction dominates the deuteron (for example the total cross section on the deuteron is ) so a good knowledge of the T=1 amplitudes is needed. We used T=1 amplitudes from out best fit as input to the T=0 determination.
The data used in our standard fit are all from incoherent K+ deuteron scattering and deuteron total cross sections. There are 92 points of total cross section data, 17 points of one and two pion production data, 336 points of elastic cross sections from the neutron, 43 points of elastic polarization from the neutron, 657 points of charge exchange cross section data and 44 points of charge exchange polarization data for a total of 1189 points.
As might be expected, the pruning of the T=0 data is more significant and problematic than the T=1 case. In order to choose which points to eliminate, a preliminary fit was made with all data included. By binning the values of (bins of unit size were chosen) a distribution was obtained. This distribution, along with the expected distribution obtained from a distribution with one degree of freedom is shown in Fig. 9. We see that the expected number of counts in a bin of unit size falls to 0.1 around =15. For this reason, the 19 points with were removed leaving 1170 data points to be fit. It is clear that there is still an excess of points below but it is impossible to tell which points to remove so no further pruning was done and we must expect to have a higher . However, we did make one run with all points giving a being removed. The results of this fit are shown in Table 4.
V.2 Double Scattering
At very low energies, double scattering in the deuteron gives an important contribution to the total cross section. Other observables are not sufficiently well measured that it will have a significant effect.
The double scattering amplitude at 0∘ is given by book
| (11) |
where is the initial and final (on-shell) momentum of the scattering meson, is the two-body form factor, and and are half-off-shell basic scattering amplitudes.
For the scattering amplitudes we write the off-shell dependence as
| (12) |
will be assumed.
| (13) |
We will consider only the s- and p-waves for this correction. The isospin 1 s-wave is the strongest so we consider the double scattering between it and the s- and p-waves of the neutron. With these assumptions
| (14) |
where is the cosine of the angle between and . The double scattering contribution to the total cross section will be
| (15) |
Where the factor of 2 comes from the fact that there are two orders of scattering possible. To include charge-exchange scattering we can replace
| (16) |
Near zero energy the amplitudes become real (so the principal value terms become very small) and the p-wave amplitude goes to zero so that only the first term remains and gives a contribution of . Since the fourth term is small for both reasons we have neglected it. The function was computed using the one-pion-exchange deuteron wave function oped which gives a good representation of the momentum distribution in the deuteron dg . While we believe that this correction is needed to get a proper fit, the results with it being left out are shown in Table 4.
V.3 Reaction Cross Sections
Aside from the values given by Hirata et al. hirata71 , the principal reaction cross sections (one and two pion production) are from Giacomelli et al. giacomelli . They used their deuteron and proton pion production data to extract the neutron data. A more consistent way for us is perhaps to use our fit to the proton results with their deuteron production data to obtain directly the T=0 reaction cross section. These can be obtained directly in the single scattering impulse approximation from the following equations.
| (17) |
V.4 Normalizations
We maintained the constant error of 3% for most of the normalizations although, for the reasons mentioned above, we might expect it to be larger. Figure 12 shows the distribution of normalizations. The distribution is wider than for the T=1 case and there is a slight bias. The calculated width of the distribution is influenced by one outlier from the Damerell et al. elastic data damerell .


V.5 Other Work
V.5.1 Analysis of Hashimoto
V.5.2 Analysis of Martin
Martin’s database was somewhat smaller than the one used here. He used, in addition to the direct deuteron data, real parts of the amplitude obtained from a dispersion relation analysis using the K+ and K- total cross sections. The dispersion relations were once subtracted with the subtraction point was taken at zero energy which means that the scattering lengths were input. He assumed that the isospin 0 scattering length was fm based on previous analyses. His fit resulted in a scattering length of –0.035 fm in agreement with his small input value.
We inserted Martin’s solution in our code to compare with our database. Since he had a smaller amount of data and the parameters were not fit to the present data base, one cannot expect a reduced very close to what he obtained. We find (for 1170 points) a of 2849 or a ratio of 2.44. for the full data set. Restricting the comparison to data below 1.2 GeV/c (because of the missing high partial-waves problem mentioned before) we find a of 1430 for 827 points for a ratio of 1.73. His original fit (number 2) found a of 924.5 for 760 points or 1.22.
V.5.3 Analysis of the VPI Group
Hyslop et al. hyslop use production as a model for inelasticity in spite of the fact that the K+ final state is forbidden in the T=0 channel. Comparing their amplitudes with our data base we find a of 2776 on 1170 points for a ratio of 2.37. They found 3181 for 1746 data points for a ratio of 1.82. Again, we remark that their parameters were not adjusted to our data base and phase shifts of only limited accuracy are available so the same value cannot be expected.
VI Results for T=0
Figure 14 shows the phase shifts obtained for the T=0 fit compared with three other analyses and Tables 5 and 6 show the parameters which give the phase shifts and inelasticities. Figure 15 shows the behavior of the T=0 phase shifts in Argand plots. There is some structure in the plots but nothing that can surely be associated with resonances.
VI.1 Reaction Channels
The isospin 0 channel is quite interesting from the point of view of the mechanism for pion production. Because of isospin, production is not allowed, nor is the production of the isoscalar . Indeed, the reaction cross section is seen to be smooth in the region of these two thresholds, unlike the T=1 case. The K*(892) production is permitted and one does observe a rapid rise around where it would be expected (Figs. 10 and 11). This is particularly true of our results but is consistent with the reaction cross sections of the VPI group and Martin as is seen in Fig. 13. Since the K∗(892) has spin-parity 1-, if it is produced with the nucleon in a relative s-state, the spin-parity values possible are 1/2- and 3/2- which correspond to the incident waves of S1/2 and D3/2. Indeed, we see the S1/2 wave giving an important contribution to the reaction cross section at the threshold and the D3/2 wave is the largest single contributor. Somewhat surprising is the dominance (or at least importance) of the D3/2 channel. This is the partial wave expected for the (isospin forbidden) production of a in the s-wave. However, this wave may be simply the dominant wave for the non-isobar production as well as receiving a contribution for the K production.
VI.2 Scattering Length
The T=0 scattering length has a rather checkered history. Lévy-Leblond and Gourdin leblond obtained a value of –0.05 fm, with large but unspecified errors. Stenger et al. stenger found a value of +0.04 fm (a value which was commonly used in dispersion relation work martinrome ). There were also suggestions that it might be positive and large alcock . Presumably based on this previous work, Martin martin set the scattering length to zero with an error of 0.04 fm as the subtraction point for his dispersion relation constraint. Martin’s fit gives –0.035 fm, although he states that it has a large error. Later Martin gives martinpl a value of 0.02 fm and then in still later work martin78 he found –0.230.18 fm.
Barnes and Swanson barnes obtained a theoretical scattering length of –0.12 fm from a Born quark model. To compare with the experimental value they performed their own extrapolation to zero energy based on single-energy analyses and found –0.09 or –0.17 fm depending on which analysis they used.
From Hyslop et al. we extrapolate a value of –0.019 although they quote in the paper a value of zero. It can be seen from Fig. 14 that the behavior of the isospin 0 s-wave in their fit is rather different from ours and has a great deal of variation in the low-energy region where there are no data. It can only be assumed that the variation in this case is a result of a fit at higher energies. It is seen that the trend of the curve above 1.1 GeV/c is noticeably different from the other determinations.
For the T=0 s-wave scattering length we adopt for the central value our best fit value of –0.105 fm from Table 4. The error for the uncertainty in the minimum is estimated from Table 4 to be 0.002 fm. In order to estimate the statistical error the fit was redone for several fixed values of the scattering length varying all other parameters. From the resulting curve the error can be estimated to be 0.01 fm. For values of scattering length close to the central value, the curve is symmetric but for larger deviations it is not, rising steeply for small values. For the value of –0.035 fm given by Martin martin , the corresponds to 8.6 standard deviations from our central value. Since the statistical error dominates, we take the scattering length as fm. This error does not include possible errors from the variations in the database. Observations on the change in value from the omission of data sets as shown in Table 4 suggest that the error from this source can be expected to be of the same order or slightly smaller.
VI.3 Scattering Volumes
The P1/2 scattering volume is well determined by the fit to be 0.183 0.005 fm where the error comes from an examination of Table 4 assuming that there is no reason to exclude the double scattering correction or the Damerell data.
The P3/2 scattering volume is smaller and more poorly determined. Again from Table 4 we take the value of –0.029 0.008 fm.
VI.4 Spin-orbit Splitting
The phase shifts for shown in Fig. 14 display a remarkable symmetry below threshold. All phase shifts for are positive and all of those for are negative. In order to see how far a pure spin-orbit interaction would go toward explaining this behavior, we calculated a simple model consisting of scattering from a square well potential with strength where
| (18) |
The radius of the well was taken to be fm (corresponding to an rms radius of 0.66 fm). and the strength, was chosen to be 0.36 GeV. The results are shown in Fig. 17 with the dashed line. The angular momentum barrier changes a great deal from one value of to another and the potential strength also changes over a significant range. The rather remarkable agreement indicates that for the phase shifts in the lower energy region are described by a pure spin-orbit interaction.
Such a potential gives no contribution to the s-wave. If we introduce a central potential (independent of ) in all partial waves of strength 0.04 GeV we obtain an s-wave scattering length of –0.11 fm (in agreement with our determination from the data). The result for the higher partial waves is shown in Fig. 17 by the dash-dot lines. Thus, including a central potential of sufficient strength to give the moderate s-wave scattering length does not destroy the good agreement seen before.
VI.5 Variations in the fit
As in the T=1 case, a number of different minima were found corresponding to different starting points. The basic properties of the different fits are given in Table 4 (caes a-f) and the variations of the phase shifts are shown in Fig. 16.
The elastic data by Stenger et al. stenger was not included in the general fit. These data were among the first to find a very small scattering length for the T=0 channel. They consist of charge exchange and elastic scattering from the deuteron. In the elastic scattering there was no separation of scattering from the neutron or proton or, indeed, coherently from the deuteron (leaving it intact). Thus, for the elastic scattering the cross section from the proton should be added to that of the neutron and coherence must be taken into account as well. The contamination from coherent scattering is largest for small angles. For the charge-exchange cross section small angle scattering (small momentum transfer) tends (without spin-flip) to leave two protons in a triplet s-wave state. Since this state is blocked by the Pauli principle and the spin-flip amplitude is small at small angles, this effect leads to a very large suppression of the charge-exchange cross section such that it is far from charge exchange on a free neutron. The data were taken in large angle bins (0.4 in ). In order to estimate the effect of leaving out this data set we made two runs, one in which the two lowest energies were fully included in the fit and one in which the most forward points (at ) were excluded. The results are summarized in Table 4.
There are two modern data sets of total cross section data, those of Krauss et al. krauss and Weiss et al. weiss . In the fitting process these data suffer a renormalization (down) of about 4% which is greater than might be expected. To see the effect of these data on the fit, a run was made with them left out. The result is shown in Table 4.
Martin martin comments that the Damerell et al. damerell data fit poorly with the rest of the data base. For this reason we made a fit with this data removed. Since there is no a priori reason to mistrust these data they were used in all of the other fits. The results of this fit are shown in Table 4. The normalization of the elastic scattering (K+n) is greater than 20% and there is some shift in the low-energy parameters obtained.
Two experiments have been performed edelstein ; armitage using the inverse charge-exchange reaction on proton targets with K-long beams . It has been recognized for some time that there is great difficulty in controlling the normalization of these beams because of regeneration of K-short mesons. For this reason we did not use these data in the principal fit. However, we did include one of the sets armitage in a run to see the possible effect. The results are shown in Table 4. Table 7 gives the normalization factors which result from the fit. The normalization errors in the fit were taken as 0.1 through 0.95 GeV/c and 0.2 above that as suggested in the experimental paper armitage .
VII Summary and Conclusions
We have presented an easy-to-use parameterization of the K+ Nucleon amplitudes. As mentioned in the introduction, there is a need for reliable amplitudes for several purposes.
Our representation for s- and p-waves is equivalent to the effective-range expansion which, for s-waves, reads
| (19) |
This form was derived originally for a potential interaction but was shown to be valid for an effective field theory bethe ; bl . More recently it has been shown to arise from renormalization group calculations birse . Since one would tend to believe that this is an appropriate expansion it would seem to be ill advised to set the scattering length to zero.
We now discuss several points which are particularly interesting for their physics potential.
1) The ratio of the scattering length for T=1 to that of T=0 may be an interesting quantity. For example, in the work of Barnes and Swanson barnes this ratio depends only on the ratio of the sizes of the kaon and nucleon and the strange quark mass, being independent of the absolute size of the hadronic systems. While this is only approximately true in their work (i.e. only in Born approximation), it indicates that this may be a quantity which is sensitive to only a restricted set of physical parameters. Our value for this ratio is .
2) The reaction cross section in the T=0 state may provide an interesting piece of data for the calculation of pion production. Here the usual dominant mechanism ( production) is isospin forbidden so that other mechanisms will be more apparent. Calculations of the type of Oset and Vicente Vacas oset might be interesting for the T=0 channel.
3) The simple form of the phase shifts for the T=0 amplitude is remarkable. To date, no theoretical model has been able to reproduce this feature althugh the work of Büttgen et al. wyborny was able to get a moderately good representation of the data with some degree of phenomenology.
4) The presence of a narrow pentaquark state would facilitate the understanding of pion production in the T=1 channel. In fact, the best way to look for a narrow resonance may be to produce it and look for a sudden change in the inelastic cross section. This was the way in which the existence of the J/ was first indicated. If this is indeed the explanation of the rapid rise in pion production and if the final state has relative angular momentum zero, then the spin-parity of the must be D5/2+. Thus, the resonance, as seen directly in the T=0 channel, would be in the F5/2 partial wave. We have seen that this partial wave is very attractive with a large angular momentum barrier so that a narrow “molecular” state is possible.
We thank Jean-Pierre Dedonder for comments after a careful reading of the manuscript.
This work was supported by the National Science Foundation under contract PHY-0099729.
References
- (1) P. B. Siegel, W. B. Kaufmann and W. R. Gibbs, Phys. Rev. C30, 1256 (1984) , “-Nucleus Elastic Scattering and Charge Exchange”
- (2) P. B. Siegel, W. B. Kaufmann and W. R. Gibbs, Phys. Rev. C31, 2184 (1985) , “ as a Probe of Partial Deconfinement in Nuclei”
- (3) G. E. Brown, C. B. Dover, P. B. Siegel and W. Weise, Phys. Rev. Lett. 60, 2723 (1988) ,“K+-nucleus scattering and the ’swelling’ of nucleons in nuclei”
- (4) R. A. Krauss, J. Alster, D. Ashery, S. Bart, R. E. Chrien, J. C. Hiebert, R. R. Johnson, T. Kishimoto, I. Mardor, Y. Mardor, M. A. Moinester, R. Olshevsky, E. Piasetzky, P. H. Pile, R. Sawafta, R. L. Stearns, R. J. Sutter, R. Weiss, and A. I. Yavin, Phys. Rev. C46, 655 (1992) , “K+ total cross sections on 12C and medium effects in nuclei”
- (5) R. Weiss, J. Aclander, J. Alster, M. Barakat, S. Bart, R. E. Chrien, R. A. Krauss, K. Johnston, I. Mardor, Y. Mardor, S. May Tal-beck, E. Piasetzky, P. H. Pile, R. Sawafta, H. Seyfarth, R. L. Stearns, R. J. Sutter, and A. I. Yavin, Phys. Rev. C49, 2569 (1994) , “Measurement of low energy K+ total cross sections on N=Z nuclei”
- (6) A. Gal and Friedman, Phys. Rev. C 73, 015208 (2006) ,“Room for an S=+1 pentaquark in K+-nucleus phenomenology”
- (7) A. Gal and Friedman, Phys. Rev. Lett. 94, 072301 (2005) , “Traces of the Theta(+) pentaquark in K+-nucleus dynamics”
- (8) L. Tolos, D. Cabrera, A. Ramos and A. Polls, Phys. Lett. B632, 219 (2006) ,“The effect of the in-medium Theta(+) pentaquark on the kaon optical potential”
- (9) T. Barnes and E. S. Swanson, Phys. Rev. C49, 1166 (1994) , ”Kaon-nucleon scattering amplitudes and Z* enhancements from quark Born diagrams”
- (10) R. Büttgen, K. Holinde, A. Müller-Groeling, J. Speth and P. Wyborny, Nucl. Phys. A 506, 586 (1990) ,“A meson exchange model for the K+N interaction”; R. Büttgen, K. Holinde and J. Speth, Phys. Lett. B163, 305 (1985) ,“KN scattering and meson exchange”
- (11) I. Bender, H. G. Dosch, H. J Pirner and H. G. Kruse, Nucl. Phys. A414, 359 (1984) ,“K+N scattering in the consitituent quark model”
- (12) R. K. Campbell and D. Robson, Phys. Rev. D36, 2682 (1987) ,“K+-nucleon central interaction in a quark potential model”
- (13) E. A. Veit, A. W. Thomas and B. K. Jennings, Phys. Rev. D31, 2242 (1985) ,“KN scattering in the cloudy bag model: s, p, and d waves”
- (14) J. Cohen, Phys. Rev. C39, 2285 (1989) ,“Effective Lagrangian approach to K+-nucleon scattering and K+ photoproduction”
- (15) K. Hashimoto, Phys. Rev. C29, 1377 (1984) ,“K+N phase shifts from 600 to 1500 MeV/c”
- (16) B. R. Martin and G. C. Oades, in Baryon 1980, Proceedings of the IVth International Conference of Baryon Resonances, Toronto, edited by N. Isgur (University of Toronto Press, Toronto, 1981). [Note: While this is the standard reference to these phase shifts, there is no text of the talk in these proceedings.] see also G.C. Oades, in Low and Intermediate Energy Kaon Nucleon Physics, edited by E. Ferrari and G. Violini (Reidel, Dordrecht, 1981).
- (17) B. R. Martin, in “Low and Intermediate Energy Kaon Nucleon Physics”, edited by E. Ferrari and G. Violini (Reidel, Dordrecht, 1981) p. 97
- (18) B. R. Martin, Phys. Lett. 65B, 346 (1976) ,“Dispersion relation constraints on low energy KN scattering”
- (19) B. R. Martin, Nucl. Phys. B94, 413 (1975) ,“Kaon-nucleon partial-wave amplitudes below 1.5 GeV/c for I=0 and I=1”
- (20) R. A. Arndt, L. D. Roper and P. H. Steinberg, Phys. Rev. D18, 3278 (1978) ,“K+p scattering analysis to 2 GeV/c”
- (21) R. A. Arndt and L. D. Roper, Phys. Rev. D31, 2230 (1985) ,“K+-proton partial-wave analysis to 3 GeV/c”
- (22) J. S. Hyslop, R. A. Arndt, L. D. Roper and R. L. Workman, Phys. Rev. D46, 961 (1992) ,“Partial-wave analysis of K+-nucleon scattering”
- (23) B. R. Martin J. Phys. G, 4, 335 (1978) ,“S-wave I=0 KN scattering length and forward cross sections”
- (24) M. J. Corden, G. F. Cox, D. P. Kelsey, C. A. Lawrence, P. M. Watkins, O. Hamon, J. M. Lévy and G. W. London, Phys. Rev. D25, 720(1982) , “Quasiunique amplitude for I=0 KN scattering below 1.89 GeV”
- (25) K. Nakajima, N. Kim, S. Kobayashi, A. Masaike, A. Murakami, A. de Lesquen, K. Ogawa, M. Sakuda, F. Takasaki and Y. Watase, Phys. Lett. 112B, 80 (1982) , “Phase shift analysis of the reaction K+N KN below 1.6 GeV/c ”
- (26) S. Kato, P. Koehler, T. Novey, and A. Yokosawa, Phys. Rev. Lett. 24, 615 (1970) ,“Evidence for the Existence of a Z∗”
- (27) R. E. Cutkosky, H. R. Hicks, J. Sandusky, C. C. Shih, R. L. Kelly, R. C. Miller and A. Yokosawa, Nucl. Phys. B102, 139 (1976) , “Partial-wave analysis of K+p elastic scattering”
- (28) S. J. Watts, D. V. Bugg, A. A. Carter, M. Coupland, E. Eisenhandler, W. R. Gibson, P. I. P. Kalmus and H. Sandhu A. Astbury, G. H. Grayer, A. W. Robertson, T. P. Shah and C. Sutton; Phys. Lett. 95B, 323(1980) , “Polarization in K+n charge exchange scattering between 0.851 GeV/c and 1.351 GeV/c”
- (29) W. R. Gibbs, Phys. Rev. C70, 045208(2004) “The Pentaquark in K+d Total Cross Section Data”
- (30) U. Casadei, G. Giacomelli, P. Lugaresi-Serra, G. Mandrioli, A. M. Rossi and F. Viaggi, CERN-HERA Report 75-1 (1975) , “A compilation of K+N cross-sections below 2 GeV/c”
- (31) SAID program at http://gwdac.phys.gwu.edu
- (32) Particle Data Group, W.-M. Yao et al. , Jour. of Phys. G 33, 1 (2006); http://pdg.lbl.gov
- (33) R. D. Ehrlich, A. Etkin, P. Glodis, V. W. Hughes, K. Kondo, D. C. Lu, S. Mori, R. Patton, G. A. Rebka, Jr.6, J. E. Rothberg, P. A. Thompson, and M. E. Zeller; Phys. Rev. Lett. 26, 925 (1971) , “Asymmetry Measurements for Elastic Scattering of K+ Mesons by Polarized Protons”
- (34) D. V. Bugg, R. S. Gilmore, K. M. Knight, D. C. Salter, G. H. Stafford, E. J. N. Wilson, J. D. Davies, J. D. Dowell, P. M. Hattersley, R. J. Homer, A. W. O’dell, A. A. Carter, R. J. Tapper, and K. F. Riley Phys. Rev. 168, 1466 (1968) , “Kaon-Nucleon Total Cross Sections from 0.6 to 2.65 GeV/c”
- (35) P. K. Caldwell, T. Bowen, F. N. Dikmen, E. W. Jenkins, R. M. Kalbach, D. V. Petersen, and A. E. Pifer; Phys. Rev. D1, 1(1970) , “K-Proton Elastic Cross Sections at 180 from 0.41 to 0.72 GeV/c”
- (36) R. L. Cool, G. Giacomelli, T. F. Kycia, B. A. Leontic, K. K. Li, A. Lundby, J. Teiger, and C. Wilkin, Phys. Rev. D1, 1887 (1970) , “Structures in K-Nucleon Total Cross Sections between 0.9 and 2.4 GeV/c”
- (37) R. J. Abrams, R. L. Cool, G. Giacomelli, T. F. Kycia, B. A. Leontic, K. K. Li, and D. N. Michael pp. Phys. Rev. D1, 1917 (1970) , “Total Cross Sections of K Mesons and Antiprotons on Nucleons up to 3.3 GeV/c”
- (38) T. Bowen, P. K. Caldwell, F. N. Dikmen, E. W. Jenkins, R. M. Kalbach, D. V. Petersen, and A. E. Pifer, Phys. Rev. D2, 2599 (1970) , “Kaon-Nucleon Total Cross Sections from 0.36 to 0.72 GeV/c”
- (39) S. C. Loken, B. C. Barish, R. Gomez, D. W. Davies, P. E. Schlein, and W. Slater, Phys. Rev. D6, 2346 (1972) , “Inelastic K+p Reactions at Incident Momenta from 1.37 to 2.17 GeV/c”
- (40) T. Bowen, E. W. Jenkins, R. M. Kalbach, D. V. Petersen, A. E. Pifer, and P. K. Caldwell, Phys. Rev. D7, 22 (1972) , “K+p and K+d Total Cross Sections in the Momentum Range 0.57-1.16 GeV/c”
- (41) B. A. Barnett, A. T. Laasanen, P. F. M. Koehler, P. H. Steinberg, J. G. Asbury, J. D. Dowell, D. Hill, H. Kato, D. Lundquist, T. B. Novey, A. Yokosawa, G. Burleson, D. Eartly, and K. Pretzl. Phys. Rev. D8, 2751 (1973) , “Measurement of the Polarization Parameter in K+p Elastic Scattering”
- (42) R. A. Burnstein, J. J. LeFebvre, D. V. Petersen, H. A. Rubin, T. B. Day, J. R. Fram, R. G. Glasser, G. McClellan, B. Sechi-Zorn, and G. A. Snow, Phys. Rev. D10, 2767 (1974) , “K+-proton scattering from 200 to 600 MeV/c”
- (43) K. Abe, B. A. Barnett, J. H. Goldman, A. T. Laasanen, P. H. Steinberg, G. J. Marmer, D. R. Moffett, and E. F. Parker Phys. Rev. D11, 1719 (1974) , “Differential cross sections for K+p elastic scattering from 0.865 to 2.125 GeV/c”
- (44) R. Patton, W. A. Barletta, R. D. Ehrlich, A. Etkin, P. A. Souder, M. E. Zeller, M. Mishina, and D. M. Lazarus, Phys. Rev. Lett. 34, 975 (1975) , “New Measurements of Polarization and Differential Cross Sections in K+p Elastic Scattering in the 1.7-3 GeV/c Range”
- (45) U. Adams, R. S. Carter, V. Cook, G. Glass and K. Green, Nucl. Phys. B87, 41 (1975) , “K+ nucleon elastic scattering at 180° between 1.0 and 1.5 GeV/c incident momentum”
- (46) V. Cook, D. Keefe, L. T. Kerth, P. G. Murphy*, W. A. Wenzel, and T. F. Zipf, Phys. Rev. Lett. 7, 182 (1961) , ”Total Cross-Section Measurements of K+-p and K+-n Interactions in the Momentum Region 0.77 to 2.83 Bev/c”
- (47) R. W. Bland, M. G. Bowler, J. L. Brown, G. Goldhaber, S. Goldhaber, J. A. Kadyk, V. H. Seeger and G. H. Trilling, Nucl. Phys. B18, 537, (1970) , “The K+p interaction from 864 to 1585 MeV/c; angular distributions for inelastic scattering”
- (48) R. W. Bland, M. G. Bowler, J. L. Brown, J. A. Kadyk, G. Goldhaber, S. Goldhaber, V. H. Seeger and G. H. Trilling, Nucl. Phys. B13, 595 (1969) , “The K+p interaction from 864 to 1585 MeV/c; Cross sections and mass distributions”
- (49) A. Bettini, M. Cresti, S. Limentani, L. Peruzzo, R. Santangelo, D. Locke, D.J. Crennel, W. T. Davies, P.B. Jones, Phys. Lett. 16, 83 (1965) , “The K+ Proton Interaction at 1.45 GeV/c”
- (50) T.A. Filippas, V.P. Henri, B. Jongejans, M. Krammer, J.M. Perreau, S. Focardi, A. Minguzzi-Ranzi, L. Monari, G. Saltini, P. Serra, E. Barrelet, E. Huffer and F. Muller, Nuov. Cim. 51A, 1053 (1967) , “Study of the Reactions K+p K pion N at 735 and 785 MeV/c”
- (51) G. Giacomelli, P. Lugaresi-Serra, G. Mandrioli, A. M. Rossi, F. Griffiths, I. S. Hughes, D. A. Jacobs, R. Jennings, B. C. Wilson,G. Ciapetti, V. Costantini, G. Martellotti D. Zanello, E. Castelli and M. Sessa, Nucl. Phys. B20, 301 (1970) , “K+p interactions in the range 0.9–1.5 GeV/c and elastic scattering phase shift analysis”
- (52) A. Berthon, L. Montanet, E. Paul, P. Saetre and D. M. SendallP. Bertranet, G. Burgun, E. Lesquoy, A. Muller, E. Pauli and S. Zylberajch, Nucl. Phys. B 63, 54 (1973) , “K+p interactions in the range 0.9–1.5 GeV/c and elastic scattering phase shift analysis”
- (53) J. Fisk, H. K. Ticho, D. H. Stork, W. Chinosky, G. Goldhaber, S. Goldhaber, and T. F. Stubbs, CERN CONF62, p358 (1962) , “Pion production by K+ mesons on hydrogen and deuterium”
- (54) J. W. Alcock, W. N. Cottingham and A. C. Davies, J. Phys. G. 4, 323 (1978)
- (55) E. Oset and M. J. Vicente Vacas, Phys. Lett. 386B,39 (1996) , “The K+pKN Reaction”
- (56) P. Wyborny, M. Hoffmann, K. Holinde and J. Speth, Phys. Rev. C48, 1376 (1993) , “Role of K interactions in K+N pion production”
- (57) T. Hyodo, A. Hosaka and E. Oset, nucl-th/0307105 , “Determining the quantum numbers through the K+pK+n reaction”
- (58) J. M. Lévy-Leblond and M. Gourdin, Nuov. Cim. 23, 1163 (1962) , “Diffusion avec échange de charge, K+-deutérium”
- (59) S. S. Kamalov, J. A. Oller, E. Oset and M. J. Viciente-Vacas, Phys. Rev. C55, 2985 (1997) , “Meson exchange currents in kaon scattering on the lightest nuclei”
- (60) Ulf-G. Meissner, E. Oset and A. Pich, Phys. Lett. 353B, 161 (1995) , “Chiral symmetry constraints on the K+ interaction with the nuclear pion cloud”
- (61) A. K. Ray, R. W. Burris, H. E. Fisk, R. W. Kraemer, D. G. Hill and M. Sakitt, Phys. Rev. 183, 1183 (1969) , “Resolution of the T=0 Fermi-Yang Ambiguity in K-Nucleon Scattering”
- (62) G. Giacomelli, P. Lugaresi-Serra, F. Mercatali, A. Minguzzi-Ranzi, A. M. Rossi, F. Griffiths, A. A. Hirata, I. S. Hughes, R. Jennings, B. C. Wilson, G. Ciapetti, P. Guidoni, G. Martellotti, A. Nappi, D. Zanello, E. Castelli, P. Poropat, and M. Sessa, Nucl. Phys. B37, 577 (1972) , “K+d interactions between 0.6 and 1.5 GeV/c”
- (63) A. A. Hirata, C. G. Wohl, G. Goldaber and G. H. Trilling, Phys. Rev. Lett. 21,1485 (1968) , “K+d Partial Cross Sections Around 1 BeV/c”
- (64) A. A. Hirata, G. Goldhaber, B. H. Hall, V. H. Seeger, G. H. Trilling and C. G. Wohl, Nucl. Phys. B30, 157(1971): , “K+ n charge exchange near 1 GeV/c”
- (65) R. G. Glasser, G. A. Snow, and D. Trevvett, R. A. Burnstein, C. Fu, R. Petri, G. Rosenblatt, and H. A. Rubin, Phys. Rev. D15, 1200 (1977) , “Low-momentum K+d scattering”
- (66) W. Slater, D. H. Stork, and H. K. Ticho, W. Lee, W. Chinowsky, G. Goldhaber, S. Goldhaber, and T. O’Halloran; Phys. Rev. Lett. 7, 378 (1961) , “K+d Charge -Exchange Reaction from 52 to 456 MeV”
- (67) A. S. Carroll, T. F. Kycia, K. K. Li, D. N. Michael, P. M. Mockett, D. C. Rahm and R. Rubinstein; Phys. Lett. B45, 531 (1973) , “Structure in the K+-nucleon I = 0 total cross section below 1.1 GeV/c”
- (68) M. Sakitt, J. Skelly, and J. Thompson, Phys. Rev. D15, 1846 (1977) , “Differential cross-section measurements of K+np at K+ momenta of 0.7, 0.8, and 0.9 GeV/c”
- (69) G. Giacomelli, P. Lugaresi-Serra, A. Minguzzi-Ranzi, A. M. Rossi, F. Griffiths, A. A. Hirata, I. S. Hughes, R. Jennings, B. C. Wilson, G. Ciápetti, P. Guidoni, G. Martellotti, A. Nappi, D. Zanello, E. Castelli, P. Poropat, and M. Sessa, Nucl. Phys. B 42, 437 (1972) , “Differential cross sections for K+n charge-exchange scattering in deuterium between 0.64 and 1.51 GeV/c”
- (70) G. Giacomelli, P. Lugaresi-Serra, G. Mandrioli, A. Minguzzi-Ranzi, A. M. Rossi, F. Griffiths, A. A. Hirata, R. Jennings, B. C. Wilson, G. Ciapetti, P. Guidoni, G. Mastrantonio, A. Nappi, D. Zanello, G. Alberi, E. Castelli, P. Poropat, and M. Sessa, Nucl. Phys. B 56, 346 (1973) , “Differential cross sections for K+n elastic scattering between 0.64 and 1.51 GeV/c”
- (71) A. W. Robertson, A. Astbury, G. H. Grayer, T. P. Shah, C. Sutton D. V. Bugg, A. A. Carter, M. Coupland, E. Eisenhandler, W. R. Gibson, P. I. P. Kalmus, H. Sandhu and S. J. Watts Phys. Lett. 91B, 465 (1980) , “Measurement of polarization in K+n elastic scattering between 0.851 GeV/c and 1.351 GeV/c”
- (72) C. J. S. Damerell, M. J. Hotchkiss, F. Wickens, K. R. Bentley, J. D. Davies, J. D. Dowell, R. J. Homer, C. McLeod, T. J. McMahon, H. B. van der Raay Nucl. Phys. B 94, 374 (1975) , “K+n elastic and charge-exchange scattering between 430 and 940 MeV/c”
- (73) W. R. Gibbs, “Computation in Modern Physics”, World Scientific Publishing, Singapore (1999)
- (74) T. E. O. Ericson and M. Rosa-Clot, Nucl. Phys. A405, 497 (1983) , “The deuteron asymptotic D-state as a probe of the nucleon-nucleon force”; J. L. Friar, B. F. Gibson and G. L. Payne, Phys. Rev. C30, 1084 (1984) , “One-pion exchange potential deuteron”; J. L. Ballot and M. R. Robilotta, Phys. Rev. C45, 986 (1992) , “Pionic values for deuteron observables”; Phys. Rev. C45, 990 (1992) , “Nonpionic effects in deuteron asymptotic observables” J. L. Ballot, A. M. Eiró and M. R. Robilotta, Phys. Rev. C40, 1459 (1989) , “Pions in the deuteron”
- (75) J.-P. Dedonder and W. R. Gibbs, Phys. Rev. C69, 054611 (2004) , “Pion Charge Exchange on Deuterium”
- (76) V. J. Stenger, W. E. Lsater, D. H. Stork and H. K. Ticho, Phys. Rev. 134, B1111 (1964) , “K-N Interaction in the I=0 state at Low energies”
- (77) J. C. M. Armitage, D. Astonstar, I. P. Duerdoth, R. J. Ellison, G. Fitton, R. E. H. Jones, A. D. Kanaris, F. K. Loebinger, D. Mercer, P. G. Murphy, D. Stork, M. G. Strongstar, M. A. R. Kempstar, and R. F. Templeman, Nucl. Phys. B123, 11 (1977) , “A study of K0p charge exchange scattering from 0.6 to 1.5 GeV/c”
- (78) R. M. Edelstein, H. E. Fisk, P. Joseph, E. L. Miller, J. S. Russ, M. O. Schick, R. C. Thatcher, D. L. Cheshire, R. C. Lamb, F. C. Peterson, and E. W. Hoffman Phys. Rev. D14, 702 (1976) , “Kp charge-exchange scattering from 550 to 1000 Mev/c”
- (79) H. A. Bethe, Phys. Rev. 76, 38 (1949) ,“Theory of the Effective Range in Nuclear Scattering”
- (80) H. A. Bethe and C. Longmire, Phys. Rev. 77, 647 (1950) ,“The Effective Range of Nuclear Forces II. Photo-Disintegration of the Deuteron”
- (81) M. C. Birse, J. A. McGovern and K. G. Richardson, Phys. Lett. 464B, 169 (1999) ,“A renormalisation-group treatment of two-body scattering”