Study of nucleon resonances with electromagnetic interactions
Abstract
Recent developments in using electromagnetic meson production reactions to study the structure of nucleon resonances are reviewed. Possible future works are discussed.
1 Introduction
The study of nucleon resonances () has long been recognized as an essential step towards developing a fundamental understanding of strong interactions. Since the discovery of the (1232) in 1951, many ’s have been identified mainly through amplitude analyses of pion-nucleon elastic scattering. This effort peaked in the 1970’s with fairly consistent results from several independent groups. A long-standing challenge in hadronic physics is to understand the spectroscopy of these resonant states, including their electromagnetic and strong decays, within a framework consistent with QCD. However, many of the assumptions used in phenomenological analyses remain to be justified theoretically. Also, the limitations of the data base lead to rather large errors in many of the determined resonance parameters.
Some additional but limited pion-nucleon scattering data have been obtained since the 1980’s. While these data have improved the determination of amplitudes at low energies, there has not been much impact in the region. The situation changed drastically in the 1990’s with the construction of new electron and photon beam facilities. Experiments at Jefferson Laboratory, MIT-Bates, LEGS, Mainz, Bonn, GRAAL, and Spring-8 are providing new data on the photo- and electroproduction of , , , , mesons and final states. These data offer a new opportunity to understand in detail how properties emerge from the non-perturbative aspects of QCD. For example, the extraction of transition form factors could shed light on the dynamical origins of the confinement of constituent quarks and the associated meson cloud.
To make progress, we need to perform amplitude analyses of the data to extract the parameters. More importantly, we need to develop dynamical reaction models to interpret the extracted parameters in terms of QCD. At the present time, the achievable goal is to test the predictions from various QCD-based hadron models such as the well-developed constituent quark model[1] and the covariant model based on Dyson-Schwinger Equations[2]. In the near future, we hope to understand the parameters in terms of Lattice QCD (LQCD).
In the region, both the amplitude analyses and reaction models have been well developed. We find that these two efforts are complementary. For example, a recent review of amplitude analyses [3] gave the result that the - M1 transition strength is . This value is about 40 larger than the constituent quark model predictions . Using dynamical models [4, 5] one can show that the discrepancy is due to the pion cloud which is not included in the constituent quark model calculations. The effect of the meson cloud on the - transition has been further revealed in the study of pion electroproduction reactions.
In the higher mass region, the situation is much more complicated because of many open channels. Any reliable analysis of the meson production data in this higher energy region must be based on a coupled-channel approach. In recent years, significant progress has been made in this direction.
In this article, we will briefly summarize the status of theoretical and experimental efforts in the study of resonances. In section 2, we review most of the current meson production reaction models used to extract information from meson production data. In section 3, we summarize the results from recent analyses of photo- and electro-production data. The focus will be on the (1232) transition form factors which have now been investigated in great detail. We will also summarize the - transition form factors extracted recently by several groups. Discussions on future developments will be given in section 4.
2 Theoretical developments
Most of the models for meson production reactions can be derived by considering the following coupled-channel equations
| (1) |
where = , , , , , , , . The interaction term is defined by with
| (2) |
Here represents the non-resonant(background) mechanisms such as the tree diagrams illustrated in Figs. 1(a)-(d), and describes the excitation shown in Figure 1(e). Schematically, the resonant term can be written as
| (3) |
where defines the decay of the -th state into meson-baryon states, and is a mass parameter related to the resonance position.

The meson-baryon propagator in (1) is
with
| (4) | |||||
where is the free Hamiltonian and
| (5) |
Here denotes taking the principal-value part of any integration over the propagator. If is replaced by and by , (1) then defines the K-matrix which is related to T-matrix by
| (6) |
By using the two potential formulation, one can cast (1) into
| (7) |
with
| (8) |
The first term of (7) is determined only by the non-resonant interaction
| (9) |
The resonant amplitude (8) is determined by the dressed vertex
| (10) |
and the dressed propagator
| (11) |
Here the mass-shift term is
| (12) |
Note that the meson-baryon propagator for channels including an unstable particle, such as , and , must be modified to include a width.
With the above equations, we now can derive in the next few subsections most of the recent models for analyzing the data of meson production reactions.
2.1 Unitary Isobar Model
In recent years, the most widely used model is the Unitary Isobar Model (UIM) developed [6] by the Mainz group. This model, called MAID, is based on the on-shell relation (6). By including only one hadronic channel, (or ), (6) leads to
| (13) |
where is the pion-nucleon scattering phase shift. By further assuming that , (13) can be cast into the following form
| (14) |
The non-resonant term in (14) is calculated from the standard Born terms but with an energy-dependent mixture of pseudo-vector (PV) and pseudo-scalar (PS) coupling. For the resonant term in (14), MAID uses the following parameterization by Walker [7]
| (15) |
where and are the form factors describing the decays of , is the total decay width, and is the excitation strength. The phase is required by the unitarity condition and is determined by an assumption that relates the phase of the total photoproduction amplitude to the scattering phase shift.
The UIM developed by the JLab-Yerevan collaboration [8, 9, 10] is similar to MAID. The main difference is that this model uses the Regge parameterization to define the amplitudes at high energies. Schematically, they write non-resonant amplitude of (14) as
| (17) | |||||
where GeV was determined phenomenologically in fitting the pion photoproduction data.
Both MAID and JLab-Yeveran UIM have been applied extensively to analyze the data of and production reactions.
2.2 K-matrix Coupled-Channel Models
2.2.1 VPI-GWU Model
The VPI-GWU [11] (SAID) can be derived from (6) by considering three channels: , , and . The solution of the resulting matrix equation leads to
| (18) |
where
| (19) | |||||
| (20) |
The amplitude needed to evaluate (18) is available in SAID. In actual analyses, they simply parameterize and as polynomial functions of the on-shell momenta for pion and photon with adjustable parameters. Once the parameters of and have been determined by fitting the pion photoproduction data, the parameters are extracted by fitting the resulting amplitude at energies near the resonance position to a Breit-Wigner parameterization (similar to (15)).
An extensive database of pion photoproduction experiments has been analyzed by SAID. The extension of SAID to the analysis of pion electroproduction data is being pursued.
2.2.2 Giessen and KVI Models
The K-matrix coupled-channel models developed by the Giessen group [12, 13, 14, 15] and the KVI group [16] can be obtained from (6) by taking the approximation . This leads to a matrix equation involving only the on-shell matrix elements of
| (21) |
The interaction is calculated from tree diagrams such as those illustrated in Figure 1. The Giessen group has performed analyses [12, 13, 14, 15] with , , , , , and channels. They further simplify as a stable partice channel. The KVI group [16] has focused on the hyperon production reactions by performing analyses with channels.
2.3 Dynamical Models
The dynamical models of meson-baryon reactions account for the off-shell scattering dynamics through the use of integral equations such as (1) or their equivalence (7)-(12). The off-shell dynamics are closely related to the meson-baryon scattering wavefunctions in the short-range region where we want to map out the structure of . Thus the development of dynamical models is an important step towards interpreting the extracted parameters.
In recent years, the predictions from the dynamical models of Sato and Lee (SL) [4] and the Dubna-Mainz-Taiwan (DMT) collaboration [5] are most often used to analyze the data in the region. The SL model can be derived from (7)-(12) by keeping only one resonance and two channels . In solving exactly the resulting equations the non-resonant interactions and are derived from the standard PV Born terms and and exchanges by using an unitary transformation method.
The DMT model also includes only and channels. They however depart from the exact formulation based on (1) or (7)-(12) by using the Walker parameterization (15) to describe the resonant amplitude. Accordingly, their definition of the non-resonant amplitude also differs from that defined by (9) : in the right-hand side of (9) is replaced by the full amplitude . Furthermore, they follow MAID to calculate the non-resonant interaction from an energy-dependent mixture of PS and PV Born terms.
Extensive data of pion photoproduction and electroproduction in the region can be described by both the SL and DMT models. However, they have significant differences in the extracted electric E2 and Coulomb C2 form factors of the transition. Both models show very large pion cloud effects on the transition form factors in the low region.
The Utrecht-Ohio model [17] has also succeeded in describing the data in the region. Despite some differences in treating the gauge invariance problem and the excitation amplitude, its dynamical content is similar to that of SL and DMT models.
The equations (7)-(12) are used in a 2- and 3-channels (, , and ) study [18] of scattering in partial wave. This work illustrated the extent to which the quark-quark interactions in the constituent quark model can be determined directly by the reaction data. The equations (7)-(12) have also been used to show that the coupled-channel effects due to the channel are very large in photoproduction [19] and photoproduction [20]. All identified by the Particle Data Group are included in these two dynamical calculations.
The coupled-channel study of both scattering and in the channel by Chen et al [21] includes , , and channels. Their scattering calculation is performed by using (1). For their calculation, they neglect the channel coupling, and follow the procedure of the DMT model to evaluate the resonant term in terms of the Walker parameterization (15). They find that four are needed to fit the empirical amplitudes in the channel up to GeV. This approach is being extended to also fit the and amplitudes in all partial waves.
A coupled-channel calculation based on (1) has been carried out by the Jülich group [22] for scattering. They are able to describe the phase shifts up to GeV by including the , , , and channels and 5 resonances: , , , and . They find that the Roper resonance arises completely from the meson-exchange coupled-channel effects.
A coupled channel calculation based on (1) for both the scattering and up to GeV has been reported by Fuda and Alarbi [23]. They include the , , and channels and 4 resonances: , , and . They adjust the parameters of their model to fit the empirical multipole amplitudes in low partial waves.
More simple coupled-channel calculations have been performed by using separable interactions. In the model of Gross and Surya [24], separable interactions come from simplifying the meson-exchange mechanisms in Figs 1(a)-1(c) as a contact term like Figure 1(d). They include only and channels and 3 resonances: , and , and restrict their investigation up to GeV. To account for the inelasticities in and , the coupling is introduced in these two partial waves. The inelasticities in other partial waves are neglected.
A similar separable simplification is also used in the chiral coupled-channel models [25, 26] for strange particle production. There the separable interactions are directly deduced from the SU(3) effective chiral lagrangians. They are able to fit the total cross section data for various strange particle production reaction channels without introducing resonance states. In recent years, this model has been further extended by Lutz and Kolomeitsev [27] to also fit the scattering data.
None of the dynamical models described above account for all of the effects arising from the channels, which contribute about 1/2 of the and total cross sections in the higher mass region. Consequently, the parameters extracted from these models could have uncertainties due to the violation of the unitarity condition. One straightforward way to improve the situation is to extend the Hamiltonian formulation of [4] to include (a) and decay mechanisms as specified in of (24), (b) for non-resonant interactions, (c) for non-resonant transitions with or , and (d) for non-resonant interactions. Such a dynamical coupled-channel model has been developed recently by Matsuyama, Sato, and Lee [28] (MSL). The coupled-channel equations from this model can also be cast into the form of (7)-(12) except that the driving term of (9) is replaced by
| (22) |
where
| (23) | |||||
with
| (24) | |||||
Note that in (23) describes the self-energy of unstable particle channels , , and . Obviously contains the non-resonant multiple scattering mechanisms within the subspace. It generates unitarity cuts. It has been shown in [28] that this term has very large effects on production reactions. This dynamical coupled-channel model is currently being further developed at the Excited Baryon Analysis Center (EBAC) at JLab.
3 Experimental developments
The past ten years has seen an unprecedented increase in the volume and precision of data from electromagnetic meson production reactions. This has resulted from the development of CW electron accelerators, which drastically reduce accidental backgrounds in coincidence experiments, as well as from advances in charged, neutron and photon detector technologies such as nearly solid angle coverage and improved spatial/energy resolution. In addition, the development of polarized beams, targets and polarimeters has opened up a previously unavailable set of observables which are sensitive to the interference between resonant and non-resonant processes in the scattering amplitude. An extensive survey of initial data from the new facilities can be found in the review by Burkert and Lee [31]. In this section we highlight results from recent analyses of ongoing experiments.
3.1 Resonance transition form factors from , , production data
Pion electroproduction provides new information not available using real photons. First, measuring the dependence of the photocoupling amplitudes probes a range of distance scales within the nucleon, revealing spatial information about the constituents. Second, polarization of the virtual photon allows study of both longitudinal and transverse modes of resonance excitation. Both of these factors place strong constraints on the structure of the transition current used in phenomenological, quark model and lattice QCD calculations.
3.1.1 Resonance
A longstanding question is the origin of the non-zero quadrupole strength experimentally observed in the transition. Quadrupole transitions, which occur via the absorption of or photons, imply non-zero orbital angular momentum in the or wave function, which can arise from configuration mixing due to residual gluon or meson interactions between constituent quarks or from the direct photon coupling to the pion cloud. Until recently the data were not sufficiently accurate to constrain calculations.
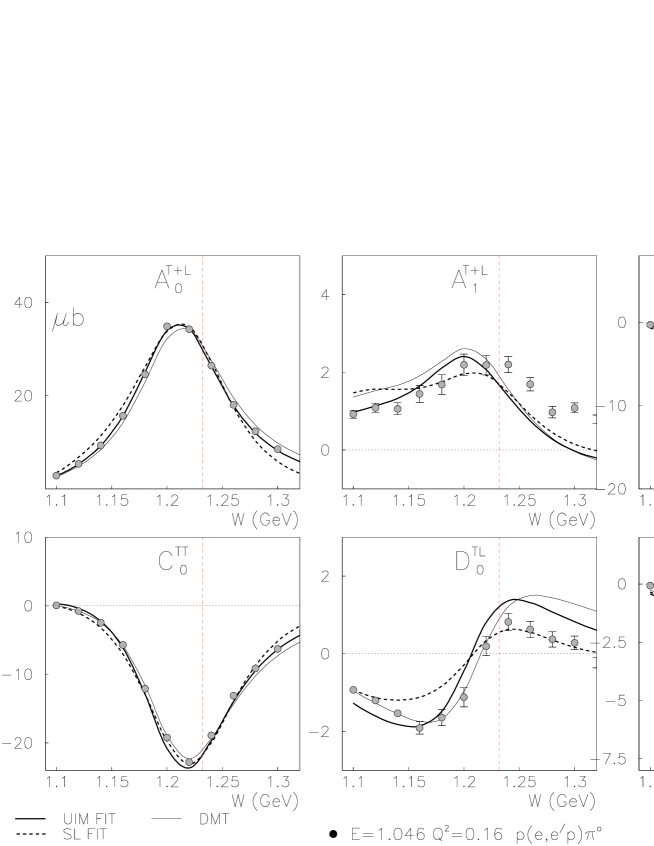
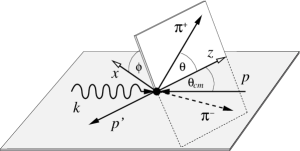
New precision measurements of the reaction at BATES, JLAB and MAMI have drastically improved our knowledge of the dependence of the electric and Coulomb quadrupole/magnetic dipole ratios and . The large acceptance CLAS experiments at JLAB measure the interference terms and via the azimuthal and partial wave decomposition of the final state:
| (25) |
where to first order, retaining only dominated terms
| (26) | |||||
| (27) | |||||
| (28) |
Here ”T” and ”L” refer to the transverse and longitudinal components of the virtual photon polarization. The data are shown in Figure 2 for GeV2 where it is seen that all the Legendre coefficients in (25) show a dependence consistent with interference terms involving the strong resonant . At higher , where dominance is no longer valid, corrections to (26-28) can be made using the Unitary Isobar Model (UIM) described in Section 2.1 where non-resonant backgrounds and tails from higher resonances are parameterized using (14) and (15). A typical UIM fit is shown in Figure 2.
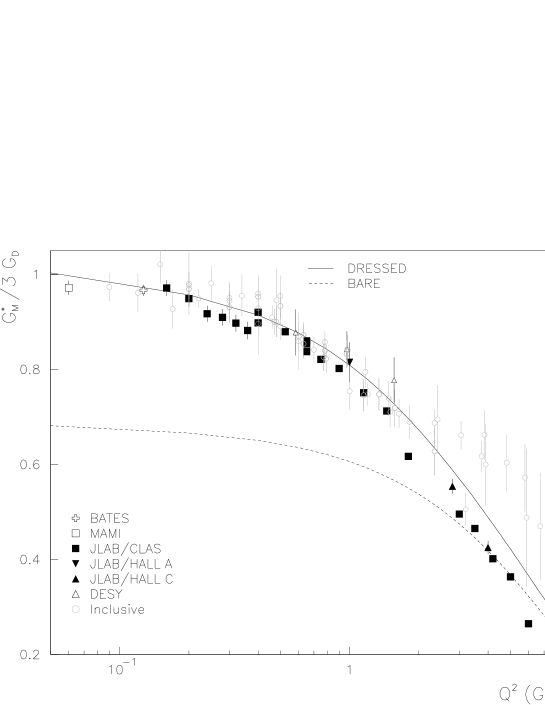
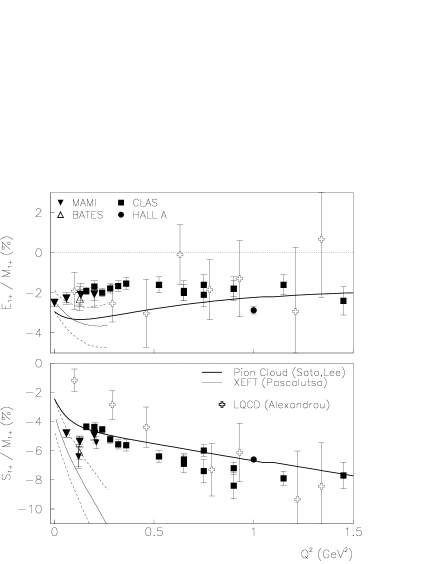
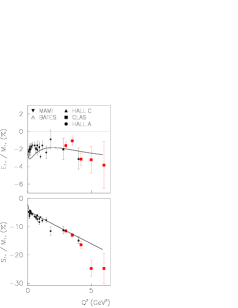
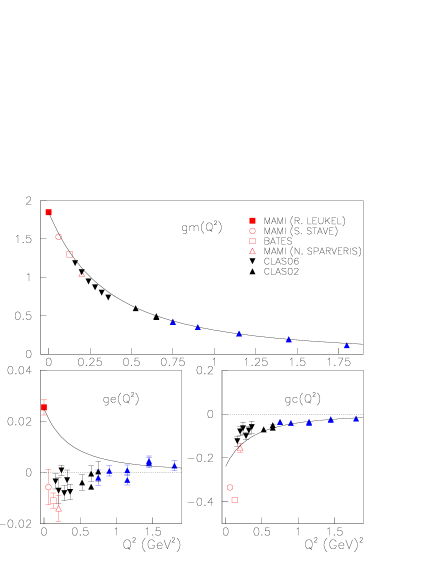
Figure 3 shows the dependence of the magnetic dipole , which is related to the isospin multipole through the width and a kinematic factor. These new exclusive measurements of now extend over the range GeV2, and confirm the rapid falloff relative to the elastic dipole seen in previous inclusive measurements, but with much greater sensitivity to the resonant multipole at higher . As previously noted, at least part of this rapid falloff may arise from the ’dressing’ of the vertex by rescattering through the pion cloud. The ’bare’ curve in Figure 3 is obtained in the SL dynamical model when the predicted ’dressed’ form factor is fitted to the data. It shows the increasing contribution from mesons as . Similar results have been obtained in the Dubna-Mainz-Taipei model.
The experimental quadrupole transition ratios REM and RSM are shown in Figure 4. The JLAB results are based on a full partial-wave analysis, while the MAMI and BATES data sets cover a more limited angle range. For the latter, MAID, DMT and SL model fits are used to estimate the resonant multipoles. The other data points with errors are quenched lattice QCD calculations [30] which have undergone a linear chiral extrapolation to the physical pion mass. It is evident that while the calculations qualitatively account for the magnitude of REM and RSM, the dependence is not consistently described. The low underprediction of RSM by LQCD is particularly striking. It was recently demonstrated, using a relativistic chiral effective field theory (EFT) calculation [32], that RSM may be particularly sensitive to a non-analytic dependence of pion loop diagrams on the quark mass, rendering invalid the linear chiral extrapolation used in [30]. A strong negative slope near is predicted by EFT for both REM and RSM (see Figure 4). While the lowest RSM points from MAMI and BATES appear to agree with this prediction, the data for higher are in better agreement with the SL and LQCD predictions. For REM, the data do not show the strong dependence predicted by EFT near , and also lie outside of the estimated theoretical uncertainty arising from higher-order effects.
At the largest measured by CLAS (right panel in Figure 4) neither REM nor RSM exhibit the helicity conserving scaling behavior expected in the hard pQCD limit (REM, RSM). Normally the transverse momenta of quarks are expected to be of the order of , and thus only important for resonance excitations at low . However Idilbi, Ji and Ma [36] have shown that the orbital motion of small partons makes a non-neglible contribution to helicity non-conservation in the transition, thus invoking both soft and hard QCD processes.
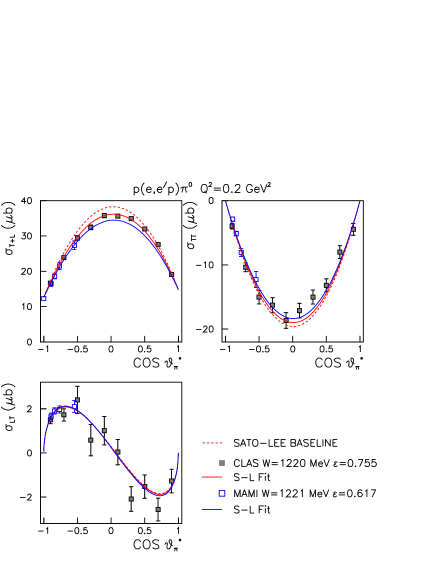
In addition to understanding the long-range chiral dynamics which are evidently important near , there has long been a fundamental interest in the ’bare’ vertex, which is presumably more sensitive to the short-range interquark potential relevant to QCD-motivated models. The bare couplings, which also contain information about the quark core wave functions of the and , can be estimated in dynamical reaction models by treating them as free parameters to be fitted to the experimental data. This was performed using the SL model for all recent data sets below GeV2. A typical fit to CLAS and MAMI data at GeV2 is shown in Figure 6, while the dependence of the extracted bare couplings and are shown in Figure 7. The simplest assumption, that the bare electromagnetic couplings have an identical dependence, is clearly ruled out by the data. Unlike , both and show a strong departure from smooth behavior at low . This behavior may indicate the presence of additional long-range physics not included in the reaction models. It is certain that more experimental data at the lowest would aid the interpretation of these results.
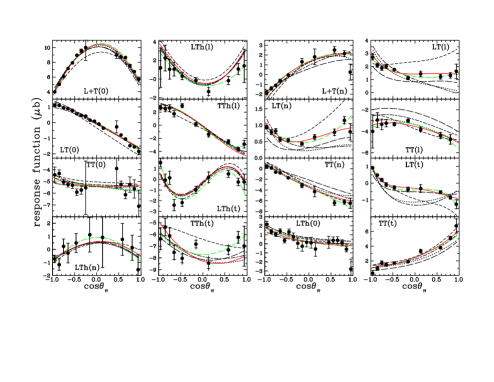
All reaction models make implicit assumptions about the mechanisms responsible for non-resonant backgrounds. This often leads to substantial model dependence in the extraction of resonance parameters due to ambiguities in relative phases, omitted diagrams, etc. In addition these same models are often used to perform the partial wave analysis of the experimental data, which should in principle be a model independent procedure. Clearly, more complete experiments would help resolve these ambiguities. A recent JLAB/Hall A experiment used a polarized beam and a high resolution magnetic spectrometer instrumented with a recoil polarimeter to measure 16 neutral pion electroproduction response functions at =1.0 GeV2. Twelve of these response functions were observed for the first time. These data are shown in Figure 5 at the peak of the , compared to MAID, DMT, SAID and SL model predictions. Although the overall agreement is good, there are several response functions for which the models clearly diverge in their predictions. This could be due simply to lack of previous experimental information on the weaker underlying multipoles. Due to the phase sensitivity of these polarization observables, a nearly model-independent extraction of and was obtained.
3.1.2
A significant new result using the large acceptance data from CLAS is the demonstration [41] of a large sensitivity to the and multipoles. These multipoles receive large contributions from excitation of the or ”Roper” resonance. Due to the isospin coupling, this sensitivity is maximized in the channel. It turns out that UIM fits to combined data sets which include the helicity dependent asymmetry and the cross section taken in the second resonance region, significantly constrain the real and imaginary parts of these multipoles through their interference, based on the UIM analysis, with largely Born dominated non-resonant multipoles. The sensitivity of the quantity to the imaginary (resonant) part of these multipoles is demonstrated in the left panel of Figure 8. The plot shows the sensitivity of this observable at GeV2 to a 0.5 shift in the transverse and longitudinal resonant photocouplings. The sensitivity is the result of the interference term that mixes real and imaginary amplitudes
| (29) |
where L and T represent the longitudinal and transverse amplitudes, respectively. At much higher , the tail from the is strongly diminished, and the Roper is directly visible as a small bump in the total cross section near GeV (right panel).


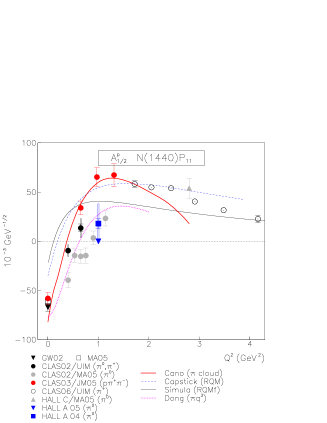
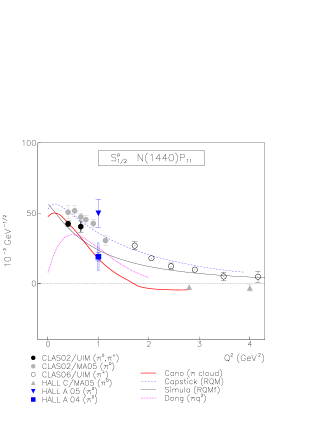
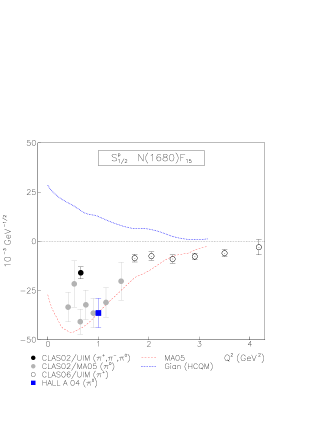
Using UIM and MAID model fits to CLAS data, the Roper photocoupling amplitudes have now been extracted over a large range of , as shown in Figure 9. A few of the points have been further analyzed in a multi-channel global fit [42] which includes the and final states and the agreement with the single channel analysis is good. We also show recently published [43, 45] points at GeV2 from Hall A. The new CLAS06 data at even higher [46] confirm the zero-crossing of first reported in [42]. This feature can completely rule out some previous quark model calculations, such as most non-relativistic approaches, as well as the quark-gluon hybrid approach for which no zero crossing occurs and for which . The strong longitudinal response seen in these data could revive the traditional ’breathing mode’ description of the Roper, possibly augmented by coupling to the cloud of the nucleon as suggested by the good agreement with the VMD model of Cano and Gonzales [49]. Dynamical models and lattice QCD calculations could provide useful input towards intepreting the zero-crossing seen in .
3.1.3 Second and Third Resonance Regions
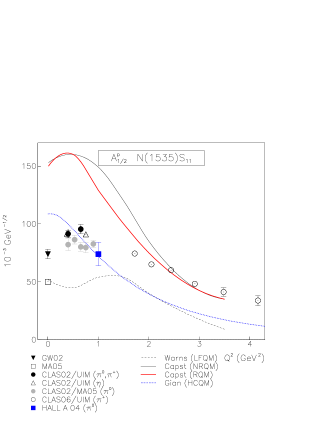
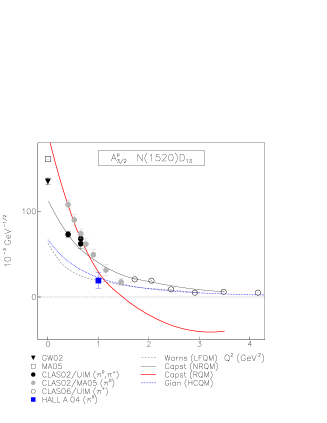
The most prominent states for GeV are , , and . These have fairly unambiguous signatures in partial wave analyses and can be reasonably well isolated in single pion production channels. Furthermore, except for the , the branching fractions and widths are known sufficiently to extract photocouplings with accuracy. On the other hand, a consistent quark model description of the dependence of these three orbital excitations has proven elusive. The new preliminary CLAS data (labeled CLAS06 in Figures 9-12) has extended the study of transition form factors into the unexplored region above GeV2.
For the , the CLAS/UIM determination [42] of photocoupling amplitudes from and electroproduction channels (assuming branching fractions , and MeV) give results which are in good agreement up to the highest measured, unlike at where from production is smaller than for production (see Figure 10). It has been shown [47, 48] that strong channel-coupling effects complicate the analyses near , although the evolution of these effects has not been studied. The new data at higher show a more dipole-like form factor compared to the anomalously hard form factor seen for GeV2. Also for the first time a reliable measurement of the longitudinal photocoupling has been made, which may shed more light on the role of meson rescattering.
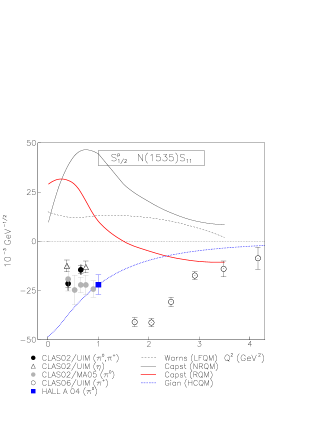
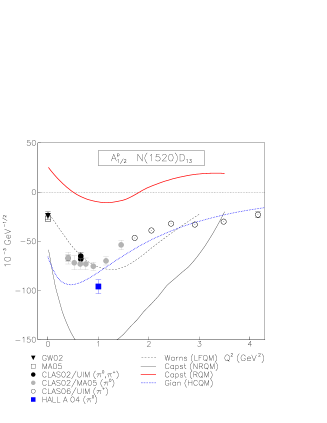
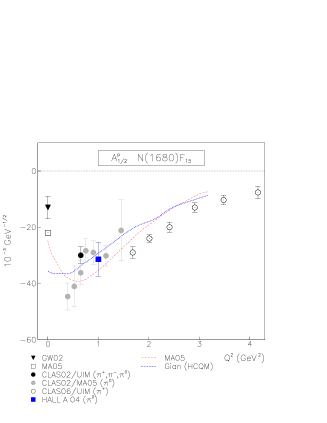
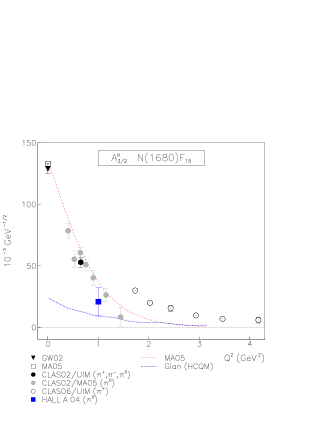
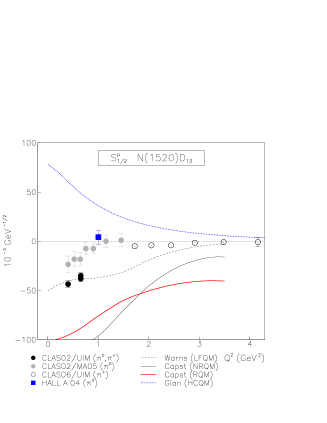
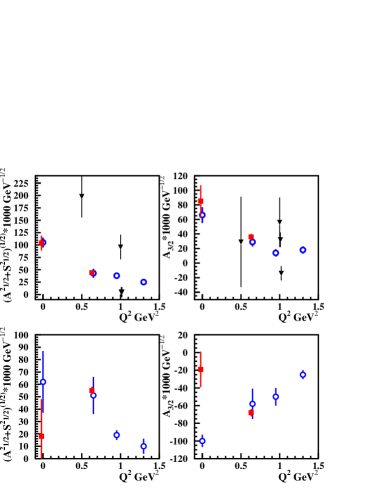
A more precise determination of the and transitions has resulted from the increased sensitivity provided by the CLAS data. The helicity non-conserving transverse amplitude for both transitions is clearly dominant at (see Figs. 11 and 12), and falls very rapidly with increasing . All quark models predict that at high , the helicity conserving will dominate the transition. However neither the harmonic oscillator potential nor hypercentral potential calculations shown in the figures describe the dependence satisfactorily. This is especially true for the longitudinal couplings (see also Figure 13), where the models fail to consistently predict even the sign. For example, quark model wavefunctions obeying symmetry predict [51], in disagreement with the data.
Most higher lying states ( GeV) have large branching fractions and reliable photocoupling amplitudes can only be obtained by performing (at minimum) fits to measurements of both single and double pion production channels. Also, detection of two pions permits the study of possible ’missing’ resonances which have weak couplings to single meson channels. These broad, overlaping states in the mass region GeV are predicted to decay to both and , which makes the channel ideal for their detection. However, the reliable extraction of photocouplings is also hampered by a poor understanding of the dynamical mechanisms behind production. Currently the most accurate data exists in the second resonance region, where it may be easier to disentangle the numerous resonant and non-resonant subprocesses which contribute to the channel.
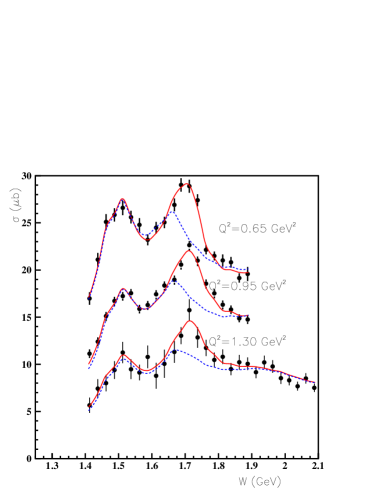
The analyses [59, 60, 61] of two pion production by using the JLab-Moscow State University (JLAB-MSU) isobar model considered only the minimum set of the tree diagrams proposed in the original work of Lüke and Söding [62]. However, they made two improvements. They included all 3-star and 4-star resonances listed by the Particle Data Group and used the absorptive model to account for the initial and final state interactions. They found that the form factor is needed to get agreement with the data of , while the initial and final state interactions are not so large. In analyzing the two-pion electro-production data, they further included a phase-space term with its magnitude adjusted to fit the data. This term was later replaced by a phenomenological particle-exchange amplitude which improves significantly the fits to the data. Evidence for intermediate isobar channels such as and possibly and are suggested by these fits. Most prominently, for increasing , the data show a peak emerging at GeV (Figure 14) which is identified [61] as a () state. However, this state differs from the conventional , having a much stronger photocoupling strength and larger decay ratio compared to PDG. The answer to whether this is a new state or a better experimental determination of an existing resonance awaits further analysis.
Polarization can play an important role in the identification of specific subprocesses which contribute to production. A good example is beam-helicity-asymmetry data in the reaction measured by Strauch et al.[58] using CLAS with a circularly polarized photon beam in the mass range GeV. The asymmetry displayed in Figs. 15,16 is defined as
| (30) |
where is the circular polarization of the photon and are the cross sections for the photon helicity states . Figure 16 shows a Fourier analysis of the asymmetries measured in the mass region of the , compared to model calculations incorporating and quasi-two-body intermediate states. The bump seen in the invariant mass (Figure16) for the coefficient is suggestive of the sequential decay . Previous unpolarized cross section measurements showed strong signatures only in the distributions, from the isospin favored transition. This again illustrates the sensitivity of polarization to the relative phases between various amplitudes, which can selectively amplify combinations of interfering background and resonance amplitudes.


3.2 Analyses of , , production data
Because the production cross sections of the , , channels are much weaker than those of the and channels, tree-diagram models cannot be used reliably to extract the information from the data of photo- and electro-production of these weak channels. We therefore review only the results from coupled-channel analyses.
Most extensive analyses [14, 15, 16] of , and photoproduction data have been performed by using the K-matrix coupled-channel models. The dynamical coupled-channel model has only been applied to analyze [20, 67] the photoproduction. The main focus of these analyses is to identify possible new resonances and also to extract more accurate information on parameters.
The photoproduction has been analyzed by the Giessen group with the K-matrix coupled-channel model, defined by (21), with channels. The channel is approximated as a stable particle channel with its coupling to the channel constrained by the empirical partial-wave amplitudes [69] of . The interaction of (21) is defined by a set of phenomenological Lagrangians with the parameters and associated form factors adjusted to fit the empirical amplitudes of , the cross sections of and .
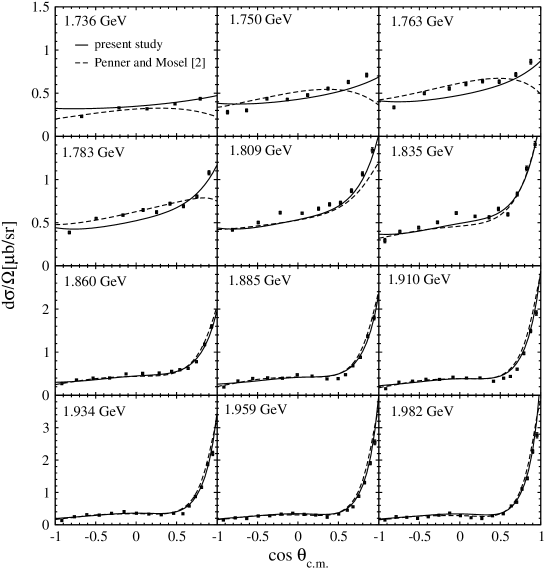
In Figure 17, we show their fits to the differential cross sections. They found a strong contribution from the resonance to and from the resonance to . From their analysis in Ref [14], they also extracted the helicity amplitudes. Their results are listed in the first rows of Tables 1,2. The SAID values from the VPI-GWU single-channel analysis are shown in the second rows. The differences between these two analysis results indicate the importance of including the coupled-channel effects in extracting the parameters.
-
92 -13 — 30(3) -16(5) — 57 -25 — 74(1) -28(4) — -84 138 — -67(2) 47(5) — -50 68 — 7(15) -2(15) — -65 1 35 -4 -15(15) 7(15) 7(10) -5(25) -8 -19 0 6 n.g. -13 -70 145 -141 -24(2) -67(4) 135(2) -112(3) 11 40 26 -33 n.g. 9 -56 21 -84 33(4) -50(4) 9(3) -71(5) 3 30 116 -48 -13(2) 29(6) 129(2) -58(9) 11 9 25 -3 n.g.
-
47 — -13(3) — 34 — n.g. n.g. -128 -253 -129(1) -243(1) -13 -28 -18(15) -25(15) 2 8 n.g. n.g. 107 147 89(10) 92(7) 32 -89 2(5) -56(5) -53 -23 4(6) -3(6)
Experimental results for and production have become very extensive over the past decade. However the coupled-channel analyses of these data are only now becoming available. The Giessen group, by extending their model to include channel, have found that , and are the main resonance contributions to photoproduction. They show that a peak near 1.9 GeV, which was identified with the ”missing” in a tree-diagram model analysis [71], can be described by a coherent sum of the contributions from the ”known” resonant and non-resonant amplitudes. This clearly demonstrates the importance of using a coupled-channel approach to analyze the data of any channel, such as the and channels, having much smaller production cross sections than the and channels.
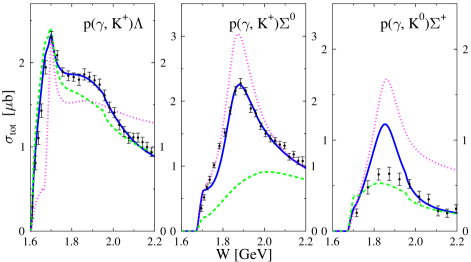
The KVI group has analyzed the and photoproduction data using a K-matrix coupled-channel model with , , , , , and channels. They use the SU(3) Lagrangian to define the interaction V of (21). With appropriate choices of form factors, they found that the data can be described very well with most of the coupling parameters not too different from their SU(3) limit. Their fits to the data on and total cross sections are shown in Figure 18. They found very large contributions from both resonances and coupled-channel effects.
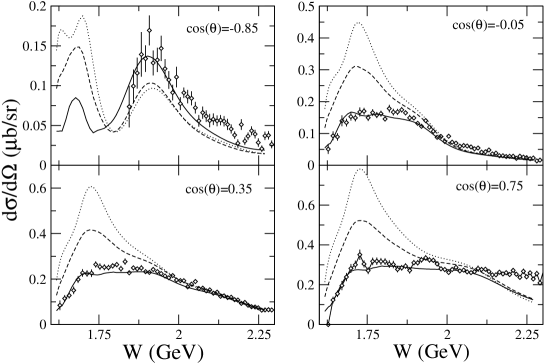
The photoproduction has also been analyzed by using a dynamical coupled-channel model [67] which is based on an extension of the dynamical model of [4] to include the channel. It differs from the K-matrix coupled-channel models of Giessen and KVI groups in accounting for the off-shell scattering dynamics. This analysis finds that the most relevant known resonances in are , and . In addition, they also demonstrate the importance of off-shell effects and meson cloud effects in interpreting the extracted parameters, as shown in Figure 19.
4 Future developments
In the past few years, we have witnessed very significant progress in the study of physics. We now have fairly extensive data for , , , , and production channels. Many more data will soon be available. Theoretical models for interpreting these new data and/or extracting the parameters have also been developed accordingly.
From the analyses of the single pion data in the region, quantitative information about the transition form factors have been obtained. With the development of dynamical reaction models, the role of pion cloud effects in determining the excitation has been identified as the source of the long-standing discrepancy between the data and the constituent quark model predictions. Moreover, the -dependence of the form factors has also been determined up to about GeV2. The Magnetic , Electric and Coulomb transition form factors should be considered along with the proton and neutron form factors as benchmark data for testing various hadron models as well as Lattice QCD calculations.
The analyses of the and production data had led to a rather quantitative determination of several parameters in the second resonance region. However, a correct interpretation of the parameters in terms of current hadron-model predictions requires a rigorous investigation of the dynamical coupled-channel effects which are not included in amplitude analyses based on either the K-matrix isobar model or the dispersion relation approach.
There has significant progress in analyzing the data for , , and photoproduction. It is now generally agreed that these data must be analyzed in a coupled-channel approach. New information on parameters have been extracted from K-matrix coupled-channel analyses. The importance of both coupled-channel and meson cloud effects have also been revealed. It will be interesting to extend these analyses to analyze the electroproduction data for also extracting the - transition form factors.
The analysis of production data is still in a development stage, while some interesting results have been obtained from the analyses based on tree-diagram isobar models. A reliable analysis of data must satisfy the unitarity condition rigorously. Progress in this direction has been made recently. The dynamical coupled-channel model developed in Ref. [28] accounts for all relevant channels and the effects due to the unitarity condition. It has been applied to reveal important dynamical features due to the unitary cuts which must be included in extracting the information from production data. The analyses based on this dynamical coupled-channel approach are being performed at the Excited Baryon Analysis Center (EBAC) at Jefferson Laboratory.
Progress made in the past decade has resulted from close collaborations between experimentalists and theorists. With much more complex data to be analyzed and interpreted, such collaborations must be continued and extended in order to bring the study of physics to a complete success.
Acknowledgments This work was supported in part by the U.S. Department of Energy, Office of Nuclear Physics, under Contract No. W-31-109-ENG-38, and in part under Contract No. DE-AC05-84ER40150 and Contract No. DE-AC05-060R23177, under which Jefferson Science Associates operates Jefferson Lab.
References
References
- [1] Capstick S and Roberts W 2000 Prog. Part. Nucl. Phys. 45 S241
- [2] Maris P and Roberts C 2003 Int. J. Mod. Phys. E12 297
- [3] Arndt R et al 2001 Proc. of the Workshop on the Physics of Excited Nucleons (Mainz) ed D Drechsel and L Tiator (New Jersey: World Scientific) p 467
-
[4]
Sato T and Lee T 1996 Phys. Rev. C54 2660
Sato T and Lee T 2001 Phys. Rev. C63 055201 -
[5]
Kamalov S and Yang S 1999 Phys. Rev. Lett. 83 4494
Kamalov S, Yang S, Drechsel D, Hanstein O and Tiator L 2001 Phys. Rev. C64 032201(R) - [6] Drechsel D, Hanstein O, Kamalov S and Tiator L 1999 Nucl. Phys. A645 145
- [7] Walker R 1969 Phys. Rev. 182 1729
- [8] Aznauryan I 2003 Phys. Rev. C67 015209
- [9] Aznauryan I 2003 Phys. Rev. C68 065204
- [10] Aznauryan I 2005 Phys. Rev. C71 015201
- [11] Arndt R, Strakovsky I, Workman R 2003 Int. J. Mod. Phys. A18 449
-
[12]
Feuster T and Mosel U 1998 Phys. Rev. C58 457
Feuster T and Mosel U 1999 Phys. Rev. C59 460 -
[13]
Penner G and Mosel U 2002 Phys. Rev. C66 055211
Penner G and Mosel U 2002 Phys. Rev. C66 055212 - [14] Shklyar V, Lenske H, Mosel U and Penner G 2005 Phys. Rev. C71 055206
- [15] Shklyar V, Lenske H and Mosel U 2005 Phys. Rev. C72 15210
- [16] Usov A and Scholten O 2005 Phys. Rev. C72 025205
- [17] Cala G, Pascalutsa V, Tjon J and Wright L 2004 Phys. Rev. C70 032201
- [18] Yoshimoto T, Sato T, Arima M and Lee T-S 2000 Phys. Rev. C61 065203
- [19] Oh Y and Lee T-S 2002 Phys. Rev. C66 045201
-
[20]
Chiang W, Tabakin F, Lee T.-S. and Saghai B 2001 Phys. Lett. B517 101
Julia-Diaz B, Saghai B, Lee T-S and Tabakin F 2006 Phys. Rev. C73 055204 - [21] Chen G, Kamalov S, Yang S, Drechsel D and Tiator L 2003 Nucl. Phys. A723 447
- [22] Krehl O, Hanhart C, Krewald S and Speth J 2000 Phys. Rev. C62 025270
- [23] Fuda M and Alharbi H 2003 Phys. Rev. C68 064002
-
[24]
Gross F and Surya Y 1993 Phys. Rev. C47 703
Surya Y and Gross F 1996 Phys. Rev. C 53 2422 - [25] Kaiser N, Waas T and Weise W 1997 Nucl. Phys. A612 297
- [26] Oset E and Ramos A 1998 Nucl. Phys. A635 99
- [27] Lutz M and Kolomeitsev E 2002 Nucl. Phys. A700 193
- [28] Matsuyama A, Sato T and Lee T-S (in preparation) (2006)
- [29] Matsuyama A and Lee T-S 1986 Phys. Rev. C34 1900
- [30] Alexandrou C et al 2005 Phys. Rev. Lett. 94 021601
- [31] Burkert V and Lee T-S 2004 Int. J. of Mod. Phys. E13 1035
- [32] Pascalutsa V and Vanderhaeghen M 2006 Phys. Rev. D73 034003
- [33] Smith L 2006 Proc. of the Shape of Hadrons Workshop Athens Eds. C.N. Papanicolas and A.M. Bernstein, (AIP), to be published
- [34] Sparveris N 2006 Proc. of the Shape of Hadrons Workshop Athens Eds. C.N. Papanicolas and A.M. Bernstein, (AIP), to be published
- [35] Ungaro M et al (CLAS Collaboration) 2006 Preprint hep-ex/0606042
- [36] Idilbi A, Ji X and Ma J-P 2004 Phys. Rev. D69 014006
- [37] Joo K et al (CLAS Collaboration) 2004 Phys. Rev. C70 042201
- [38] Joo K et al (CLAS Collaboration) 2003 Phys. Rev. C68 033201
- [39] Joo K et al (CLAS Collaboration) 2002 Phys. Rev. Lett. 88 12201
- [40] Stave S et al 2006 Preprint nucl-ex/0604013
- [41] Joo K et al (CLAS Collaboration) 2005 Phys. Rev. C72 058202
- [42] Aznauryan I et al 2004 Phys. Rev. C72 045201
- [43] Laveissiere G et al (Hall A Collaboration) 2004 Phys. Rev. C69 045203
- [44] Kelly J et al (Hall A Collaboration) 2005 Phys. Rev. Lett. 95 102001
- [45] Kelly J et al (Hall A Collaboration) 2005 Preprint nucl-ex/0509004
- [46] Park K et al. (CLAS Collaboration) to be submitted to Phys. Rev. C.
- [47] Vrana T, Dytman S and Lee T-S Lee 2001 Phys. Rept. 328 181
- [48] Arndt R et al. 2005 Phys. Rev. C72 045202
- [49] Cano F and Gonzales P 1998 Phys. Lett. B431 270
- [50] Dong Y 1997 J. Phys. G: Nucl. Part. Phys. 23 1005
- [51] Li Z, Dong Y and Ma W 1997 J. Phys. G: Nucl. Part. Phys. 23 151
- [52] Pace E, Salme G and Simula S 1999 Few Body Syst. Suppl. 10 407
- [53] Capstick S and Keister B 1995 PR D51 3598
- [54] Warns M, Schroder G, Pfiel W and Rollnik H 1990 Z. Phys. C45 627
- [55] Aiello M, Giannini M and Santopinto 1998 Eur. J. Phys. G24 753
- [56] Tiator L et al. 2004 Eur. J. Phys. A19 55
- [57] Mokeev V et al 2005 Preprint hep-ph/0512164
- [58] Strauch S et al (CLAS Collaboration) 2005 Phys. Rev. Lett. 95 162003
-
[59]
Ripani M et al 2000 Nucl. Phys. A672 220
Ripani M et al 2003 Phys. Rev. Lett. 91 022002 - [60] Mokeev V et al 2001 Phys. At. Nucl. 64 1292
- [61] Mokkeev V et al 2004 Proc. of the Workshop on the Physics of Excited Nucleons (Grenoble) eds. J Bocquet, V Kuznetsov and D Rebreyend (New Jersey: World Scientific) p 321
- [62] Lüke D and Söding P 1971 Springer Tracts in Modern Physics vol 59 (Berlin: Springer)
- [63] Fix A and Arenhövel H 2005 Eur. J. Phys. A25 115
- [64] Glander K et al 2004 Eur. J. Phys. A19 151
- [65] Lawall R et al 2005 Eur. J. Phys. A24 275
- [66] Barth J et al 2003 Eur. J. Phys. A18 117
- [67] Julia-Diaz B, Saghai B Lee T-S and Tabakin F 2006 Phys. Rev. C73 055204
- [68] Bradford R et al (CLAS Collaboration) 2006 Phys. Rev. C73 035202
- [69] Manley M 2003 Int. J. of Mod. Phys. A18 441
-
[70]
Arndt R, Strakovsky I and Workman R 1996 Phys. Rev. C53 430
Arndt R et al 1995 Preprint nucl-th/9509005
Arndt R, Briscoe W, Strakovsky I and Workman R 2002 Phys. Rev. C66 055213
Arndt R et al 2002 Preprint nucl-th/0205067 - [71] Mart T and Bennhold C 2000 Phys. Rev. C61 12201(R)