The symmetry energy at subnuclear densities and nuclei in neutron star crusts
Abstract
We examine how the properties of inhomogeneous nuclear matter at subnuclear densities depend on the density dependence of the symmetry energy. Using a macroscopic nuclear model we calculate the size and shape of nuclei in neutron star matter at zero temperature in a way dependent on the density dependence of the symmetry energy. We find that for smaller symmetry energy at subnuclear densities, corresponding to larger density symmetry coefficient , the charge number of nuclei is smaller, and the critical density at which matter with nuclei or bubbles becomes uniform is lower. The decrease in the charge number is associated with the dependence of the surface tension on the nuclear density and the density of a sea of neutrons, while the decrease in the critical density can be generally understood in terms of proton clustering instability in uniform matter.
pacs:
97.60.Jd, 26.60.+c, 21.65.+fI Introduction
The inner crust of a neutron star consists of a Coulomb lattice of nuclei embedded in a roughly uniform neutralizing background of electrons and in a sea of neutrons PR . The equation of state (EOS) of uniform nuclear matter and the surface tension, both at large neutron excess, are essential to understanding of the equilibrium properties of matter in the crust. However, laboratory data on nuclei only reflect the bulk and surface properties of nearly symmetric nuclear matter OI ; IO . So far, calculations of the equilibrium properties of matter in the crust depend on the way to extrapolate the known bulk and surface properties to large neutron excess, which is different among earlier investigations PR .
In this paper we systematically analyze the question of how the equilibrium properties of inhomogeneous nuclear matter at subnuclear densities depend on the parameter characterizing the density dependence of the symmetry energy. In doing so, we utilize a macroscopic nuclear model OI in which the equilibrium nucleon distribution depends on the EOS of nuclear matter through minimization of the energy density functional. One of the most important quantities is the charge number of the equilibrium nuclide. In a liquid-drop picture PR , this charge number is determined by the size equilibrium condition which controls the ratio between the Coulomb and surface energies. This condition tells that the charge number squared is proportional to the surface tension and the nuclear volume. As we shall see, the density dependence of the symmetry energy, which controls the surface tension by affecting the nuclear density and the density of the neutron gas, controls the charge number as well.
We also address the question of how matter with nuclei or bubbles melts into uniform matter with increasing density. In this melting process, rodlike and slablike nuclei embedded in a gas of neutrons, as well as rodlike and roughly spherical neutron-gas regions (bubbles) surrounded by a nucleon liquid, are expected to occur RPW ; HSY ; LRP ; O . At a density where roughly spherical nuclei are so closely packed that they occupy about 1/8 of the system volume, the nuclei tend to be elongated and eventually fuse into nuclear rods. The advantage of this rod formation is a reduction in the total surface area from the roughly spherical case. However, whether bubbles and nonspherical nuclei actually appear in neutron star crusts depends on the critical density at which proton clustering instability occurs in uniform nuclear matter PRL ; they are expected to appear when the density corresponding to the nuclear volume fraction of about is smaller than the critical density for proton clustering. We find that this critical density is in turn controlled by the symmetry energy at subnuclear densities.
Earlier investigations on such exotic nuclei are more or less based on specific nuclear models PR ; WS . An exception is the work by Watanabe et al. WIS which is systematic in the sense that the liquid-drop model calculations were performed in a way dependent on the proton chemical potential in pure neutron matter, , and the surface tension. It was found that the density at which the system dissolves into uniform matter increases with increasing . However, it remains to be clarified why some nuclear models LRP ; Chen ; SLy predict the absence of bubbles and nonspherical nuclei. It is important to note that these models predict relatively high pressure for pure neutron matter (or, equivalently, relatively small symmetry energy) at densities around half the normal nuclear density, while the work by Watanabe et al. WIS uses a parametrization BBP based on the microscopic calculations by Siemens and Pandharipande SP as the EOS of pure neutron matter and fix the density dependence of the symmetry energy. This parametrization is consistent with the recent Green’s function Monte Carlo (GFMC) calculations CMPR at neutron densities up to about half the normal nuclear density. We will give a unified picture about the presence of bubbles and nonspherical nuclei by describing the pressure of pure neutron matter in terms of the density dependence of the symmetry energy.
The size and shape of nuclei in the crust bear relevance to the thermal and rotational evolution of neutron stars. This is because thermal conductivity and neutrino emissivity in the crust are controlled by electron-nucleus scattering YP , while the motion of superfluid neutron vortices in the crust is affected by vortex-nucleus interactions EB92 . However, real crustal matter has to be accompanied by defects and impurities, which can play a more important role in the star’s evolution Jones . In a real neutron star, furthermore, the nuclear system is more or less out of equilibrium in the course of mass accretion onto the surface of the star and the star’s spin-down Sato ; HZ ; IS . Such disordered and nonequilibrium properties are beyond the scope of this paper.
In Sec. II, we construct a model for inhomogeneous nuclear matter at subnuclear densities in a way dependent on the EOS of nearly symmetric nuclear matter near the saturation point. The equilibrium size and shape of nuclei at given density are then calculated from the model constructed in Sec. III. Section IV is devoted to evaluations of the critical density at which uniform matter becomes unstable against proton clustering. Our conclusions are given in Sec. V.
II Model for matter at subnuclear densities
In this section, we construct a macroscopic model for zero-temperature, -equilibrated, inhomogeneous nuclear matter at subnuclear densities. This is an extension of Ref. OI to the case in which a gas of dripped neutrons is present, which is based on Ref. O . Here we focus on how macroscopic properties of the system depend on the EOS of nearly symmetric nuclear matter and, for simplicity, ignore various effects such as nucleon pairing effects FMH , shell effects in inhomogeneous matter OY ; MH , fluctuation-induced displacements of nuclei and bubbles WIS , and electron screening effects WI .
The bulk energy per nucleon is an essential ingredient of the macroscopic nuclear model. We set this energy as
| (1) | |||||
where
| (2) |
and
| (3) |
are the potential energy densities for symmetric nuclear matter and pure neutron matter, and are the neutron and proton number densities, , is the neutron excess, and is the neutron mass. Expressions (1)–(3) can well reproduce the microscopic calculations of symmetric nuclear matter and pure neutron matter by Friedman and Pandharipande FP in the variational method. In this method, the isospin dependence of asymmetric matter EOS is shown to be well approximated by Eq. (1) LP . (Replacement of the proton mass by in the proton kinetic energy would make only a negligible difference.) For the later purpose of roughly describing the nucleon distribution in a nucleus, we incorporate into the potential energy densities (2) and (3) a low density behavior as expected from a contact two-nucleon interaction.
A set of expressions (1)–(3) is one of the simplest that reduces to the usual form (4) in the limit of and ,
| (4) |
Here , , and are the saturation energy, saturation density, and incompressibility of symmetric nuclear matter. The parameters and are associated with the density dependent symmetry energy coefficient : is the symmetry energy coefficient at , and is the symmetry energy density derivative coefficient (hereafter referred to as the “density symmetry coefficient”). As the neutron excess increases from zero, the saturation point moves in the density versus energy plane (see, e.g., the dotted lines in Fig. 2). This movement is determined mainly by the parameters and . Up to second order in , the saturation energy and density are given by
| (5) |
and
| (6) |
The slope, , of the saturation line near is thus expressed as
| (7) |
We determine the parameters in such a way that the charge number, charge radius, and mass of stable nuclei calculated in a macroscopic nuclear model constructed in Ref. OI are consistent with the empirical data. In the course of this determination, we fix , which controls the EOS of matter for large neutron excess and high density, at 1.58632 fm3. This value was obtained by one of the authors O in such a way as to reproduce the neutron matter energy of Friedman and Pandharipande FP . Change in this parameter would make no significant difference in the determination of the other parameters and the final phase diagram.
We describe macroscopic nuclear properties in a way dependent on the EOS parameters by using a Thomas-Fermi model OI . The essential point of this model is to write down the total energy of a nucleus of mass number and charge number as a function of the density distributions and in the form
| (8) |
where
| (9) |
is the bulk energy,
| (10) |
is the gradient energy with adjustable constant ,
| (11) |
is the Coulomb energy, and is the neutron number. This functional allows us to connect the EOS and the nuclear binding energy through the bulk energy part . For simplicity we use the following parametrization for the nucleon distributions :
| (12) |
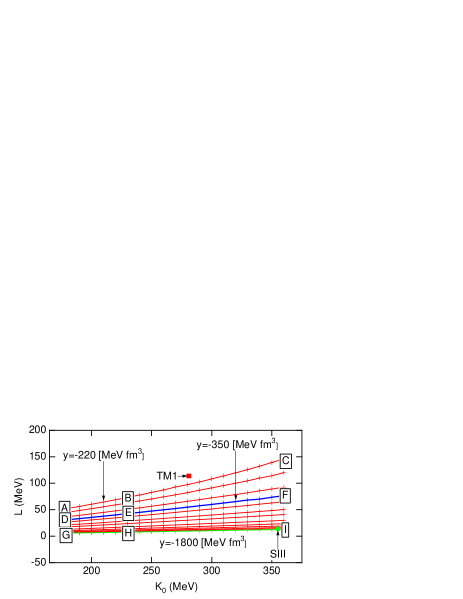
This parametrization allows for the central density, half-density radius, and surface diffuseness for neutrons and protons separately. In order to construct the nuclear model in such a way as to reproduce empirical masses and radii of stable nuclei, we first extremized the binding energy with respect to the particle distributions for fixed mass number, five EOS parameters, and gradient coefficient. Next, for various sets of the incompressibility and the density symmetry coefficient, we obtained the remaining three EOS parameters and the gradient coefficient by fitting the calculated optimal values of charge number, mass excess, root-mean-square (rms) charge radius to empirical data for stable nuclei on the smoothed stability line O . In the range of the parameters MeV and 180 MeV MeV, as long as MeV fm3, we obtained a reasonable fitting to such data (see Fig. 1). As a result of this fitting, the parameters , , , and are constrained as –0.17 fm-3, MeV, –40 MeV, and MeV fm5. We remark that a negative is inconsistent with the fact that the size of isobars deduced from the experimental values of the interaction cross section tends to increase with neutron/proton excess isobar . This inconsistency can be seen from Eq. (6) which shows that the saturation density increases (and hence the isobar size decreases) with neutron/proton excess for a negative .
We remark that in this range the calculations agree well with a more extended data set of nuclear masses for Audi and charge radii for dV . The rms deviations of the calculated masses from the measured values are –5 MeV, which are comparable with the deviations obtained from a Weizsäcker Bethe formula, while the rms deviations of the calculated charge radii from the measured values are about 0.06 fm, which are comparable with the deviations obtained from the law.
Let us summarize the macroscopic nuclear model used here. This model can describe global nuclear properties such as masses and rms radii in a manner that is dependent on the EOS of nuclear matter. One of the important predictions of this model was that the matter radii depend appreciably on the density symmetry coefficient , while being almost independent of the incompressibility . Although the present macroscopic approach has some limitations in describing the nuclear surface, it is still useful for examining the phase diagram of nuclear matter at subnuclear densities O .
For the purpose of describing matter in neutron star crusts, we proceed to extend the above-described nuclear model to the case of nuclei of various shapes embedded in a gas of dripped neutrons by following a line of arguments of Ref. O . Here we also take into account a gas of electrons as a constituent of matter in the crust and impose stability and charge neutrality in the system.
We consider five phases that consist of spherical nuclei, cylindrical nuclei, planar nuclei, cylindrical bubbles, and spherical bubbles, respectively. Each phase is assumed to be composed of a Coulomb lattice of a single species of nucleus or bubble at a given baryon density . For the convenience of practical calculations, we adopt the Wigner-Seitz approximation. In this approximation, a cell in the bcc lattice, including a spherical nucleus or bubble, is replaced by a Wigner-Seitz cell defined as a sphere having the same volume () and center. We refer to as the lattice constant. A cylindrical nucleus or bubble having an infinitely long axis and a circular section is taken to be contained in a cylindrical Wigner-Seitz cell having the same axis in place of a cell in the two-dimensional triangular lattice. For a planar nucleus, a Wigner-Seitz cell is identical with a cell in the one-dimensional layered lattice. For the sake of convenience, we redefine the cylindrical and slab Wigner-Seitz cells as a cylinder of height and base area and a slab of thickness and surface area , respectively (see Figs. 1 and 2 in Ref. O ).
For each unit cell, we write the total energy as
| (13) |
where , , and are the nuclear energy, the electron energy, and the Coulomb energy.
As in Eq. (8), the nuclear energy is again expressed in the density functional form:
| (14) | |||||
For a spherical nucleus in vacuum, this expression reduces to [see Eq. (8)].
The electron energy can be approximated as the energy of an ideal uniform Fermi gas,
| (15) |
with
| (16) |
where is the electron mass, and is the electron number density that satisfies the charge neutrality condition,
| (17) |
We remark that is so high that we can safely ignore inhomogeneity of the electron density induced by the electron screening of nuclei or bubbles WI and the Hartree-Fock corrections to the electron energy.
The Coulomb energy is composed of the proton self-Coulomb energy and the lattice energy. We write the Coulomb energy as
| (18) |
where is the electrostatic potential in a Wigner-Seitz cell, and is the difference of the rigorous calculation OHY for a cell in the bcc (triangular) lattice of spherical (cylindrical) nuclei or bubbles having sharp surfaces from the Wigner-Seitz value, as parametrized in Ref. O . We take into account , which is a less than 1 % correction, because depends sensitively on the dimensionality of the lattice. (Note that for the layered lattice of slab nuclei.)
For nucleon distributions in the Wigner-Seitz cell, we simply generalize the parametrization (12) for a nucleus in vacuum into
| (19) |
Here is the distance from the central point, axis, or plane of the unit cell. In the case of nuclei, , while in the case of bubbles, .
We finally determine the equilibrium configuration of the system at given baryon density,
| (20) |
First, for each of the five inhomogeneous phases, we minimize the total energy density with respect to the eight parameters , , , (for nuclei) or (for bubbles), , , , and . This minimization implicitly allows for the stability of the nuclear matter region (the region containing protons) with respect to change in the size, neutron drip, -decay, and pressurization. In addition to the five inhomogeneous phases, we consider a uniform phase of -equilibrated, neutral nuclear matter. The energy density of this phase is the sum of the nucleon part [see Eq. (1)] and the electron part (15). By comparing the resultant six energy densities, we can determine the equilibrium phase.
III Equilibrium size and shape of nuclei
We proceed to show the results for the equilibrium nuclear matter configuration obtained for various sets of the EOS parameters and as shown in Fig. 1. These parameters are still uncertain since they are little constrained from the mass and radius data for stable nuclei OI . As we shall see, the charge number of spherical nuclei and the density region containing bubbles and nonspherical nuclei have a strong correlation with .
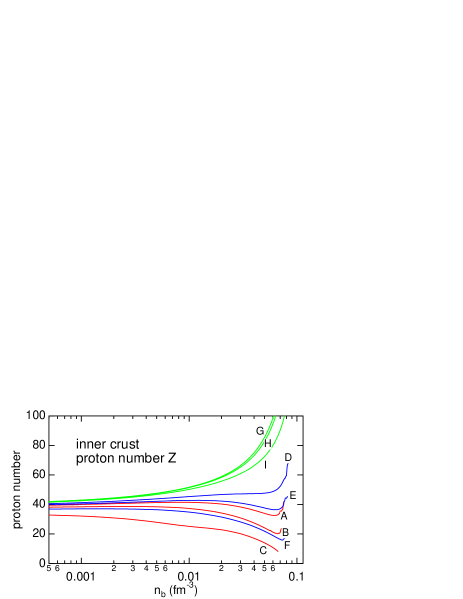
We first focus on spherical nuclei, which constitute an equilibrium state in the low density region. We calculate the charge number of the equilibrium nuclide as a function of for the EOS models A–I as depicted in Fig. 2. Note that the recent GFMC calculations of the energy of neutron matter based on the Argonne v8’ potential CMPR are close to the behavior of the model E. Hereafter we will thus call the model E as a typical one. The result is shown in Fig. 3. For densities below fm-3, the calculated density dependence of the charge number is almost flat, a feature consistent with the results in earlier investigations PR . More important, the calculated charge number is larger for the EOS models having smaller , and this difference in is more remarkable at higher densities.

As we shall see later in Fig. 6, this property of is related to the tendency that with increasing , the nuclear density decreases while the density of the neutron gas increases. Note that is, within a liquid-drop model PR , determined by the size equilibrium condition relating the Coulomb and surface energies in such a way that increases with increasing surface tension. Since the Thomas-Fermi model adopted here can be mapped onto a compressible liquid-drop model OI , the present results may well be interpreted in terms of the liquid-drop model. In fact we shall estimate the surface tension from the Thomas-Fermi model as a function of and discuss how the surface tension depends on the nuclear density and the neutron sea density.
We also note that the density at which the phase with spherical nuclei ceases to be in the ground state is between 0.05 fm-3 and 0.07 fm-3. This result, consistent with the results obtained in earlier investigations PR ; O ; WIS , will be discussed below in terms of fission instability.
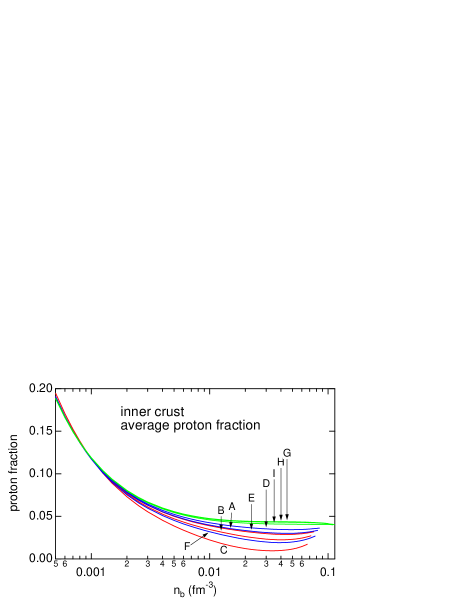
The average proton fraction, which is the charge number divided by the total nucleon number in the cell, is plotted in Fig. 4. We observe that the dependence of the average proton fraction on the EOS models is similar to that of . We also find that the average proton fraction basically decreases with baryon density. This is a feature coming from the fact that as the baryon density increases, the electron chemical potential increases under charge neutrality and then the nuclei become more neutron-rich under weak equilibrium.
We next consider the density region where bubbles and nonspherical nuclei appear in equilibrium, i.e., the density region of the “pasta” phases. We start with such a density region calculated for the EOS models A–I. The results are plotted in Fig. 5. Except for the model C, we obtain the successive first order transitions with increasing density: sphere cylinder slab cylindrical hole spherical hole uniform matter. A marked correlation of the upper end of the density region with the parameter can be observed by referring to Fig. 1. This dependence will be examined in detail in the next section.
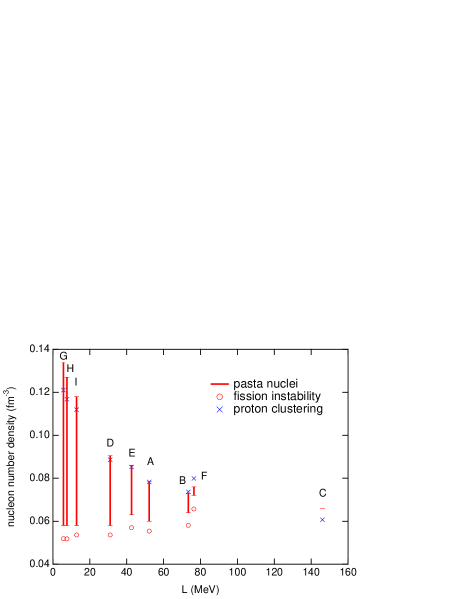
As can be seen in Fig. 5, the lower end of the density region of the pasta phases has only a weak dependence on the EOS models. In order to have a closer look at this feature, it is instructive to calculate a density at which spherical nuclei become susceptible to fission-inducing quadrupolar deformations. Within the framework of a liquid-drop model, a spherical liquid-drop in a Wigner-Seitz cell is predicted to undergo such a fission-like instability when the volume fraction , i.e., the ratio of the liquid-drop volume to the cell volume, becomes approximately PR . In such a closely packed situation, the Coulomb self-energy of the liquid-drop amounts to twice the surface energy even under size equilibrium. We note that the density corresponding to is generally within fm-3 of the transition density calculated from the energy comparison between the phases with spherical nuclei and with cylindrical nuclei.
In the present model, we evaluate the volume fraction as , where is the rms radius of the proton distribution multiplied by a factor . This is because the proton self-Coulomb energy is relevant to the fission-like instability. At , we calculate the equilibrium properties of matter with spherical nuclei for the parameter sets included in Fig. 1. The results are plotted as a function of in Fig. 6. The results for MeV are scarce since in this case the pressure of neutron matter is too high for to amount to . We remark that the results show only a weak dependence on .

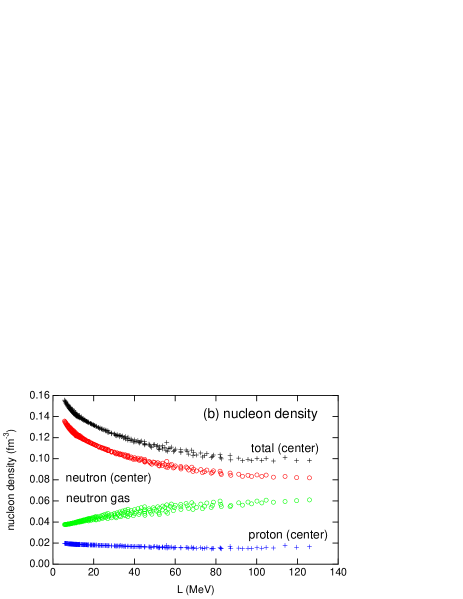
It is important to note that the baryon density at is almost flat at fm-3 [see Fig. 6(a)]. This is consistent with the lower end of the density region of the pasta phases as depicted in Fig. 5. This magnitude of at can be roughly understood from a simple formula with the values of , , and in Fig. 6(b). We also note that with increasing , the central density decreases while the neutron sea density increases. This is natural because both the saturation density of nuclear matter at nonzero neutron excess and the symmetry energy at subnuclear densities decreases with .
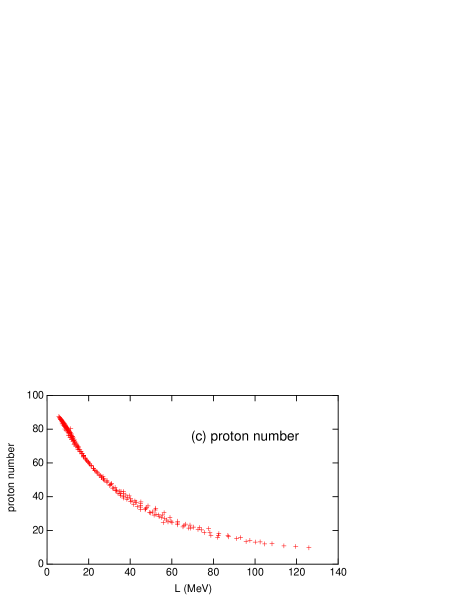
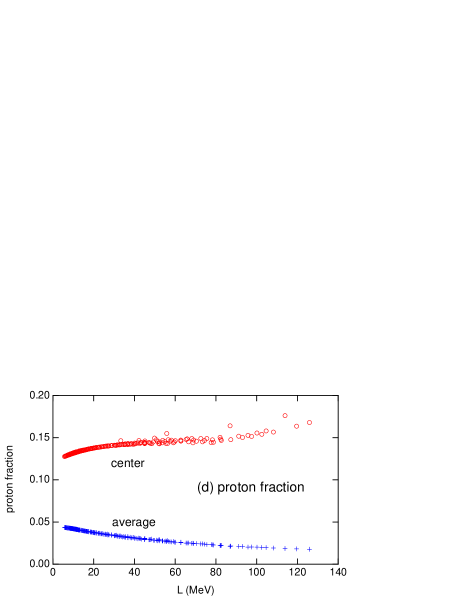
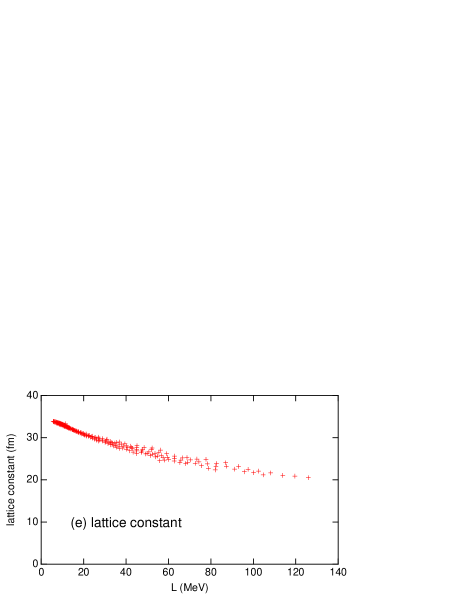
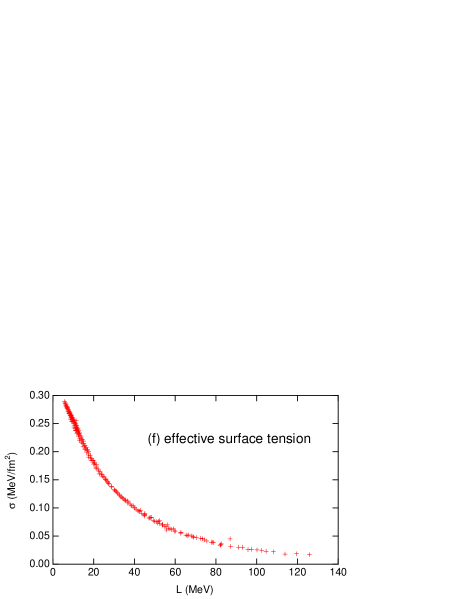
We now turn to the dependence of the charge number at [see Fig. 6(c)]. The charge number decreases with . This feature can be understood from the size equilibrium condition within a liquid-drop picture PR . This condition states that the Coulomb energy of a cell is half as large as the nuclear surface energy. Consequently, the equilibrium charge number squared is proportional to the surface tension and to the nuclear volume. Note that the proton fraction in the nuclear center and the nuclear volume have a relatively weak dependence on [see Figs. 6(d) and 6(e)]. The surface tension is thus expected to have a similar dependence to that of the charge number squared, through the dependence on the densities inside and outside the nucleus. From the Thomas-Fermi model, it is reasonable to estimate the effective surface tension as
| (21) |
where
| (22) |
is the gradient energy per cell. This is because in equilibrium, the Coulomb energy of a cell is as large as O , implying that the nuclear surface energy, , is twice as large as . The surface tension thus estimated basically follows the behavior of , as can be seen from Figs. 6(c) and 6(f). The surface tension is generally the function of the neutron excess in the nuclear interior and the densities inside and outside the nucleus BBP . Since the density gradient in the surface region tends to become small for smaller difference between the central density and the neutron sea density, the surface tension decreases with as shown in Fig. 6(f).
IV Proton clustering in uniform matter
In this section, we focus on the upper end of the density region of the pasta phases. This upper end corresponds roughly to a density at which uniform nuclear matter neutralized and equilibrated by electrons becomes unstable against proton clustering. In fact, this correspondence can be seen from Fig. 5.
We calculate the onset density of proton clustering by following a line of argument of Baym, Bethe, and Pethick BBP . This density was obtained in Ref. BBP by expanding the energy density functional () of the system with respect to small density fluctuations around the homogeneous state. While the contribution of first order in vanishes due to equilibrium of the unperturbed homogeneous system, the second order contribution can be described in the spirit of the Thomas-Fermi model used here as
| (23) |
where is the ground-state energy, is the Fourier transform of , and is the potential of the effective interaction between protons as given by
| (24) |
Here,
| (25) |
| (26) |
| (27) |
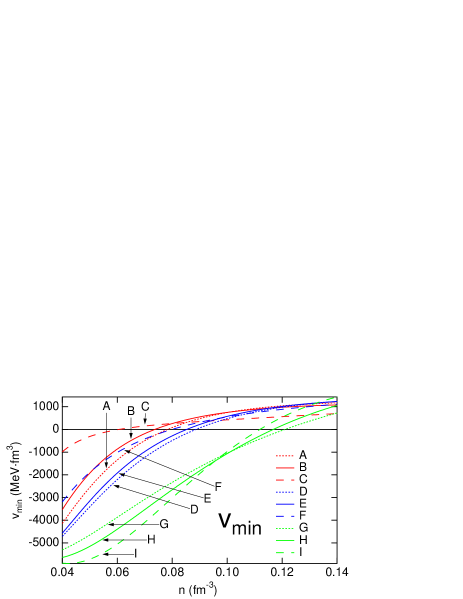
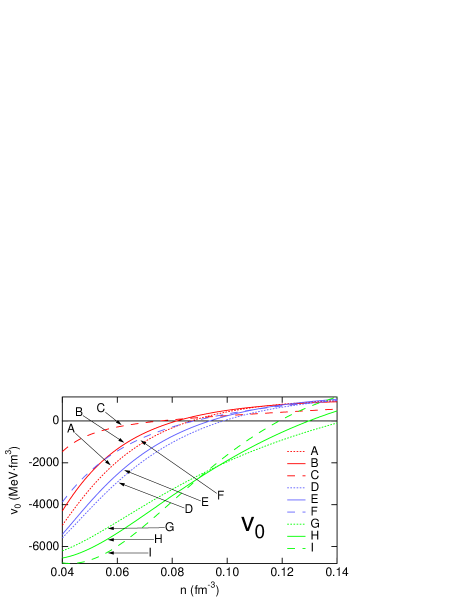
with the neutron (proton) chemical potential, and is the inverse of the Thomas-Fermi screening length of the electron gas. The effective potential takes a minimum value at , where
| (28) |
| (29) |
In the energy expansion up to second order in , the condition that uniform nuclear matter becomes unstable with respect to proton clustering reads . Generally, is dominated by the bulk contribution , which decreases with decreasing density (see Fig. 7). This density dependence ensures the presence of a critical density, , above (below) which the matter is stable (unstable) with respect to proton clustering. Hereafter we will estimate without including the gradient and Coulomb contributions to , which act to reduce only by an amount of order 0.02 fm-3 (see Fig. 7 and also Ref. IWS ).
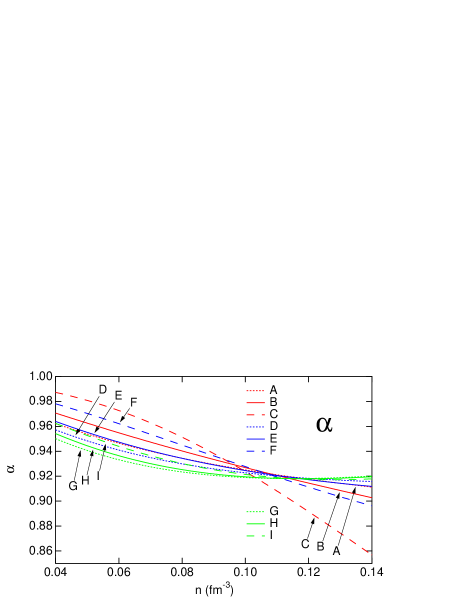
The density dependence of can be seen by substituting Eq. (1) into Eq. (25). In the limit of , to which nuclear matter equilibrated and neutralized by the electron gas is close at subnuclear densities (see Fig. 7), behaves roughly as
| (30) |
with the symmetry energy coefficient . At subnuclear densities, depends only weakly on , while the compressibility ratio between pure neutron matter and symmetric nuclear matter, , increases almost linearly with density because of the saturation property of the symmetric nuclear matter.
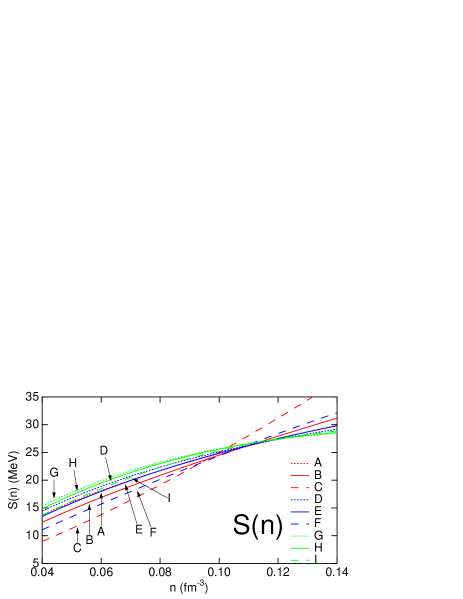
In Fig. 8 we show the results for estimated for the parameter sets included in Fig. 1. We find that decreases with , whereas it does not have a marked dependence on . The dependence is correlated with the dependence of the symmetry energy coefficient since acts as a driving force of proton clustering. Note the general tendency that at subnuclear densities, the larger , the smaller symmetry energy coefficient (see Fig. 7). The proton clustering thus takes place at lower density for larger . Figure 7 also shows that for fm-3, becomes larger for larger . This is a feature coming from the empirical relation, MeV, derived in Ref. OI .
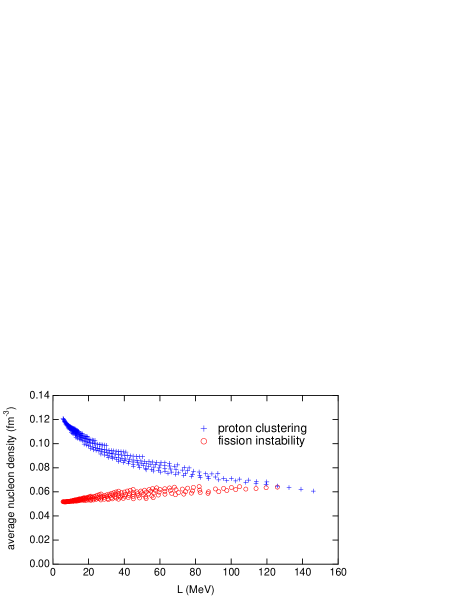
We can also observe from Fig. 8 that the difference between and the density corresponding to in the phase with spherical nuclei decreases with and eventually vanishes near MeV. This suggests that the density regime of the pasta phases is limited for a large , although for the standard EOS model E, corresponding to MeV, it does appear between 0.06 and 0.09 fm-3. In our EOS model, a larger value of implies a harder EOS of pure neutron matter as we shall see below. We thus conclude that the absence of the pasta phases seen in Refs. LRP ; Chen ; SLy from the EOS model with relatively high pressure of neutron matter at subnuclear densities is consistent with our result.
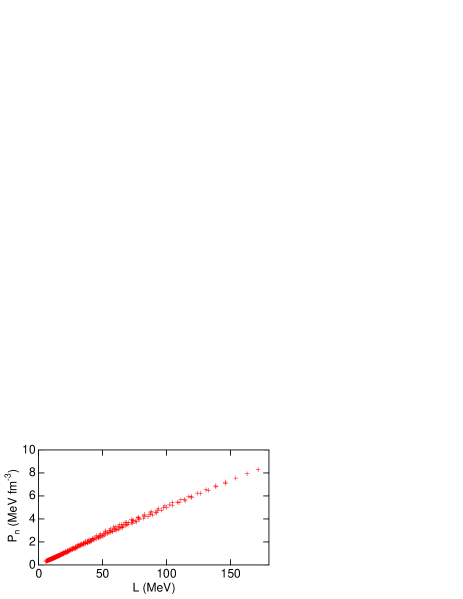
In order to clarify this consistency, we calculate the pressure of pure neutron matter,
| (31) |
for the parameter sets shown in Fig. 1. The results for at fm-3 are plotted as a function of in Fig. 9. We find out a roughly linear dependence of at fm-3. This dependence can be roughly understood by substituting the expansion (4) into Eq. (31) and thereby obtaining
| (32) |
We remark that this pressure controls the neutron skin thickness of 208Pb evaluated within the framework of the Skyrme Hartree-Fock model Brown .
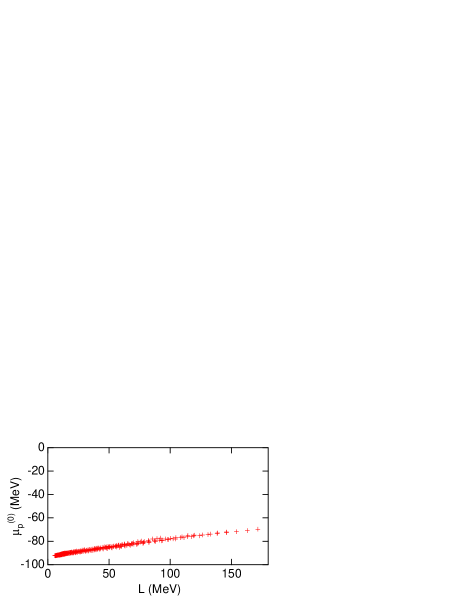
We conclude this section by mentioning a relation between the systematic liquid-drop analysis WIS and the present analysis. In Ref. WIS , the value of was fixed at MeV, and the proton chemical potential in pure neutron matter,
| (33) |
was changed by a factor of 2. In the present analysis, on the other hand, the value of was taken between 0 and 160 MeV, while depends only weakly on the value of , as shown in Fig. 9 in which the results for calculated at fm-3 for the parameter sets shown in Fig. 1 are plotted as a function of . According to Ref. WIS , plays a role in shifting the density region of the pasta phases without changing its width significantly. We may thus conclude that it is the parameter that controls the presence of the pasta phases.
V Conclusions
We have analyzed the equilibrium properties of inhomogeneous nuclear matter at subnuclear densities in a way dependent on the density symmetry coefficient by using a macroscopic nuclear model. We have estimated the upper and lower ends of the density region of the pasta phases from the onset densities of proton clustering in uniform nuclear matter and fission-like instability of spherical nuclei, respectively. We find that the upper end decreases with , while the lower end is almost flat at 0.05–0.07 fm-3. The former arises from the dependence of the symmetry energy, while the latter can be understood from the volume fraction at which spherical nuclei become susceptible to fission-inducing deformations. For a typical EOS model consistent with the GFMC calculations of pure neutron matter, the calculated pasta regime is appreciable. In fact, the pasta regime is predicted to appear when MeV.
The present analysis is the first to attempt a systematic analysis of the pasta region in terms of . However, much care needs to be taken of the interpretation of the results. While is the parameter characterizing the expansion of with respect to and around and , the system of interest here is at large neutron excess and at subnuclear densities. The relation between the parameter and neutron star matter depends on the parametrization of with respect to and . It is thus useful to keep in mind that we confined ourselves to expressions (1)–(3) although they are known to be capable of reproducing various existing microscopic calculations of the EOS of uniform nuclear matter.
We have also calculated the charge number of spherical nuclei as a function of density for various values of . Generally, the charge number becomes smaller for larger , a feature that could be of relevance to the evolution of neutron stars YP . In order to make better estimate of , however, shell and pairing effects should be taken into account.
Acknowledgements.
This work was supported in part by RIKEN through Grant No. A11-52040.References
- (1) C.J. Pethick and D.G. Ravenhall, Annu. Rev. Nucl. Part. Sci. 45, 429 (1995).
- (2) K. Oyamatsu and K. Iida, Prog. Theor. Phys. 109, 631 (2003).
- (3) K. Iida and K. Oyamatsu, Phys. Rev. C 69, 037301 (2004).
- (4) D.G. Ravenhall, C.J. Pethick, and J.R. Wilson, Phys. Rev. Lett. 50, 2066 (1983).
- (5) M. Hashimoto, H. Seki, and M. Yamada, Prog. Theor. Phys. 71, 320 (1984).
- (6) C.P. Lorenz, D.G. Ravenhall, and C.J. Pethick, Phys. Rev. Lett. 70, 379 (1993).
- (7) K. Oyamatsu, Nucl. Phy. A561, 431 (1993).
- (8) C.J. Pethick, D.G. Ravenhall, and C.P. Lorenz, Nucl. Phy. A584, 675 (1995).
- (9) G. Watanabe and H. Sonoda, cond-mat/0502515.
- (10) G. Watanabe, K. Iida, and K. Sato, Nucl. Phys. A676, 455 (2000); Erratum, ibid. A726, 357 (2003).
- (11) K.S. Cheng, C.C. Yao, and Z.G. Dai, Phys. Rev. C 55, 2092 (1997).
- (12) F. Douchin and P. Haensel, Phys. Lett. B 485, 107 (2000).
- (13) G. Baym, H. A. Bethe, and C.J. Pethick, Nucl. Phys. A175, 225 (1971).
- (14) P.J. Siemens and V.R. Pandharipande, Nucl. Phys. A173, 561 (1971).
- (15) J. Carlson, J. Morales, V.R. Pandharipande, and D.G. Ravenhall, Phys. Rev. C 68, 025802 (2003).
- (16) D.G. Yakovlev and C.J. Pethick, Annu. Rev. Astron. Astrophys. 42, 169 (2004).
- (17) R.I. Epstein and G. Baym, Astrophys. J. 387, 276 (1992).
- (18) P.B. Jones, Phys. Rev. Lett. 83, 3589 (1999); Mon. Not. R. Astron. Soc. 351, 956 (2004).
- (19) K. Sato, Prog. Theor. Phys. 62, 957 (1979).
- (20) P. Haensel and J.L. Zdunik, Astron. Astrophys. 227, 431 (1990).
- (21) K. Iida and K. Sato, Astrophys. J. 477, 294 (1997).
- (22) F. Montani, C. May, and H. Müther, Phys. Rev. C 69, 065801 (2004).
- (23) K. Oyamatsu and M. Yamada, Nucl. Phys. A578, 181 (1994).
- (24) P. Magierski and P.-H. Heenen, Phys. Rev. C 65, 045804 (2002).
- (25) G. Watanabe and K. Iida, Phys. Rev. C 68, 045801 (2003).
- (26) B. Friedman and V.R. Pandharipande, Nucl. Phys. A361, 502 (1981).
- (27) I.E. Legaris and V.R. Pandharipande, Nucl. Phys. A369, 470 (1981).
- (28) K. Oyamatsu, I. Tanihata, Y. Sugahara, K. Sumiyoshi, and H. Toki, Nucl. Phys. A634, 3 (1998).
- (29) A. Ozawa et al., Phys. Lett. B344, 18 (1994); L. Chulkov et al., Nucl. Phys. A603, 219 (1996); A. Ozawa et al., Nucl. Phys. A709, 60 (2002).
- (30) G. Audi and A.H. Wapstra, Nucl. Phys. A595, 409 (1995).
- (31) H. de Vries, C.W. de Jager, and C. de Vries, At. Data Nucl. Data Tables 36, 495 (1987).
- (32) K. Oyamatsu, M. Hashimoto, and M. Yamada, Prog. Theor. Phys. 72, 373 (1984).
- (33) K. Iida, G. Watanabe, and K. Sato, Prog. Theor. Phys. 106, 551 (2001); Erratum, ibid. 110, 847 (2003).
- (34) B.A. Brown, Phys. Rev. Lett. 85, 5296 (2000).