Forward-Backward Charge Fluctuations at RHIC Energies
Abstract
We use the ultra-relativistic quantum molecular dynamic UrQMD version 2.2 to study forward backward fluctuations and compare our results with the published data by the PHOBOS.
1 Introduction
One of the main goals of the relativistic heavy ion program is to understand the nature of the hadron production mechanism (e.g. parton coalescence, string fragmentation or cluster decay). Recent RHIC data suggested the formation of a quark gluon plasma (QGP) during the collision of two heavy gold nuclei at center of mass energy GeV. Using correlations and fluctuations to probe the nature of the created QCD matter has been proposed by many authors, see for example[1]. Recently, the PHOBOS experiment performed a similar analysis to the UA5 experiment [3] for Au+Au reactions at GeV [4]. In ref [2], a simple model was introduced to extract the effective cluster multiplicity from PHOBOS data and was found for peripheral collisions and for central collisions. The value of in central collisions is close to the value reported by UA5 [3]. Note that all measured cluster multiplicities are larger than the one that is computed for a hadron resonance gas () [5], indicating that the measured charge correlations can not be described by simple statistical models based on hadronic degrees of freedom. Our goal in the current study is to get a baseline estimate for forward-backward fluctuations based on the microscopic hadronic transport model UrQMD. For a complete review of the model see [6]. In this paper we analyze and minimum bias Au+Au events at GeV.
2 Forward-Backward Fluctuations
In this section, we introduce the variable that measures the asymmetry between the forward and backward charges. We define two symmetric rapidity regions at with equal width . The number of charged particles in the forward rapidity interval is while the corresponding number in the backward hemisphere is given by . We define the asymmetry variable , in each event. The variance of the charged particle multiplicity in the forward hemisphere is given by and similarly for the backward hemisphere . We also introduce the covariance of charged particles in both hemispheres by , where stands for the average over all events. The PHOBOS measure of the dynamical fluctuations can be written as
| (1) |
Recently STAR [7] reported a preliminary results of the so called correlation strength parameter . The effective cluster multiplicity is propotional to , such that if b=0, then the covariance vanishes. In this case we have . We emphasize that should be understood as a product of the true cluster multiplicity times a leakage factor that takes into account the limited observation window . The event by event fluctuations of the asymmetry parameter (variance) in the absence of any correlations among the produced particles will be .

3 Results
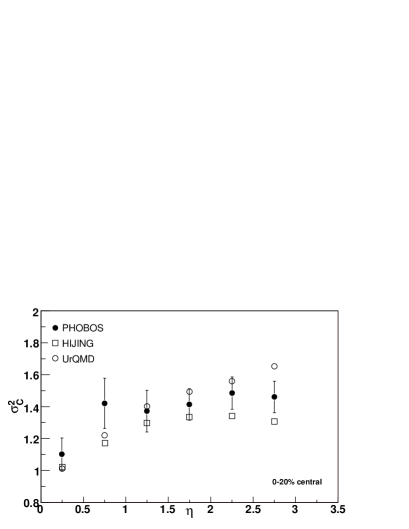

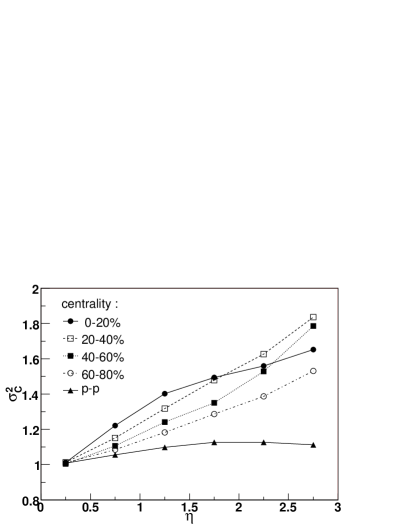
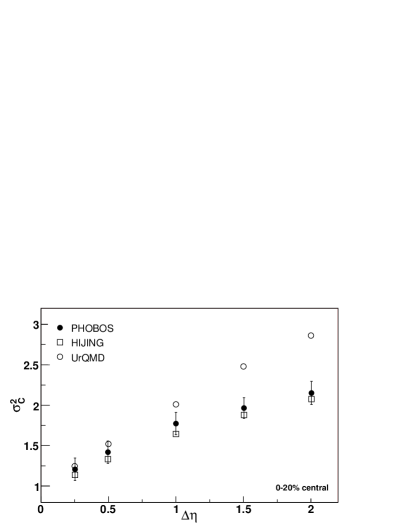
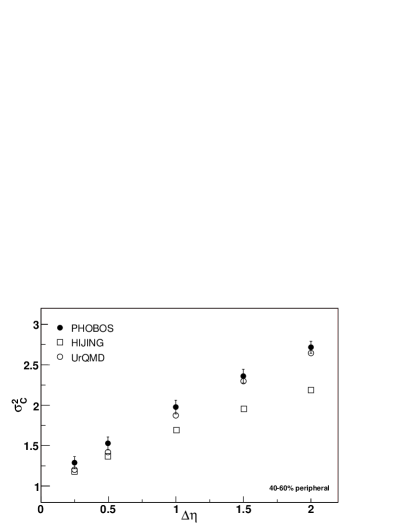
In Fig. 1(left) we show as a function of at GeV computed from UrQMD. We find that for collisions when , then increases to 1.1 for . In Fig. 1(right) we plot as a function of , we notice that reaches approximately 1.6. This value is close to the resonance gas value mentioned in [5]. In Fig. 1, we plot UrQMD results for Au+Au at different centralities. UrQMD shows that as a function of and has a clear centrality dependance, such that increases with centrality and then starts to decrease with more centrality cuts. In [2] we predicted that, for PHOBOS data, with more centrality cut, may be reduce to 1.9, and this reduction in may be regarded as an indication for cluster melting at RHIC. In Fig. 2 we show our UrQMD with PHOBOS data [4] and their HIJING results for central (left) and peripheral (right) Au+Au collisions. In both figures, we keep . From Fig. 2 we find that for both centralities increases with increasing . This behavior exists in both the experimental data and HIJING. For both centralities we find that when . This is because the competition between long and short range correlations almost cancels. In central collisions Fig. 2, UrQMD and HIJING roughly reproduce the experimental data within 1.5. In peripheral collisions Fig. 2(right), UrQMD can roughly produce the PHOBOS data while HIJING deviates by more than two for the large rapidity gaps. In ref [2], we show that by varying the observation window one can see the whole cluster structure. We keep the center of the observation window at while we allow for the observation window to change. In Fig. 3 we show the PHOBOS data [4] in addition to HIJING and our UrQMD analysis. We see that the measured increases up to 2.2 and 2.8 for central and peripheral collisions respectively. In contrast to HIJING which gives the same value for both centralities. UrQMD shows a centrality dependance as shown in Fig 3. For cental collisions, HIJING can reproduce the data. HIJING fails to reproduce the the peripheral data. UrQMD over estimates in the central collisions while it succeeded to reproduce the peripheral collisions. The failure of UrQMD to reproduce the the central data indicated that the cluster structure in UrQMD can survive, because the hadronic rscattering is not strong enough to destroy such clusters.
4 Summary and Conclusion
In this paper we computed forward-backward fluctuations and compared UrQMD calculations results to the available experimental data measured by PHOBOS. We started by studying proton-proton collisions and we find that long range correlation persists over a wide rapidity gap between the two rapidity hemispheres. The variance of the asymmetry parameter was found to increase with increasing such that changes from to , this can be due the saturation of the leakage factor . For Au+Au collisions, we find that for both centrality bins and , for small . This can be seen as a cancellation between short and long range fluctuations. By increasing we see that also increases and approaches 1.6 and 1.8 for and respectively. This increase can be attributed to the decrease in the long range correlations. This will be true if the particle production mechanism does not change with . To see the whole cluster structure, we fix the center of the observation window at 2 and allow to increase. We find that UrQMD can reproduce the peripheral data while it overestimates the experimental results for central collisions. HIJING gives the opposite behavior to UrQMD. HIJING produces the central data while it fails to reproduce the peripheral data as shown by PHOBOS. Also we find that UrQMD shows a smaller centrality dependance than the data. The discrepancies between HIJING, UrQMD and the data encourage more theoretical study to be done in order to clarify the correlation between produced particles in high energy nuclear collisions. The next step in this work is to measure and consistently to extract the cluster multiplicity and test for the survival or melting of such clusters.
Acknowledgements
This work is supported by BMBF and GSI.
References
- [1] S. Haussler, H. Stoecker and M. Bleicher, Phys. Rev. C 73, 021901 (2006); S. Jeon, L. Shi and M. Bleicher, Phys. Rev. C 73, 014905 (2006); V. Koch, M. Bleicher and S. Jeon, Nucl. Phys. A 698, 261 (2002) [Nucl. Phys. A 702, 291 (2002)]; M. Bleicher, S. Jeon and V. Koch, Phys. Rev. C 62, 061902 (2000); M. Bleicher et al., Phys. Lett. B 435, 9 (1998); N. Armesto, L. McLerran and C. Pajares, arXiv:hep-ph/0607345; L. Cunqueiro, E. G. Ferreiro, F. del Moral and C. Pajares, Phys. Rev. C 72, 024907 (2005).
- [2] M. Abdel-Aziz and M. Bleicher, arXiv:nucl-th/0605072.
- [3] K. Alpgard et al. [UA5 Collaboration], Phys. Lett. B 123, 361 (1983); R. E. Ansorge et al. [UA5 Collaboration], Z. Phys. C 37, 191 (1988).
- [4] B. B. Back et al. [PHOBOS Collaboration], Phys. Rev. C 74, 011901 (2006).
- [5] M. A. Stephanov, K. Rajagopal and E. V. Shuryak, Phys. Rev. D 60, 114028 (1999).
- [6] S. A. Bass et al., Prog. Part. Nucl. Phys. 41, 225 (1998), M. Bleicher et al., J. Phys. G 25 (1999) 1859.
- [7] T. J. Tarnowsky [STAR Collaboration], arXiv:nucl-ex/0606018.