Low-energy neutron-12C analyzing powers: results from a multichannel algebraic scattering theory.
Abstract
Analyzing powers in low-energy neutron scattering from 12C are calculated in an algebraic momentum-space coupled-channel formalism (MCAS). The results are compared with recently obtained experimental data. The channel-coupling potentials have been defined previously to reproduce the total cross section and sub-threshold bound states of the compound system. Without further adjustment, good agreement with data for the analyzing powers is obtained.
pacs:
24.10-i;24.70+s;25.40.Dn;25.40.Ny;28.20.CzA multi-channel algebraic scattering theory (MCAS) has been formulated for scattering of nucleons from nuclei, and tested on the well-studied 12C nucleus Am03 . This formulation of the coupled-channel scattering theory has the following desirable features: (i) the Pauli principle is satisfied even in the context of collective nuclear models Ca05 ; (ii) all resonances, no matter how narrow, as well as sub-threshold bound states of the compound system are found, without the need of calculations on an excessively fine energy mesh; and (iii) nuclear structure information can be extracted from the results of the MCAS calculations, providing the Pauli principle is satisfied Pi05 .
Our first work with this formulation focused on calculating cross sections for neutron Am03 and proton Pi05 scattering from 12C, though some sample polarization results have also been shown Pi05 . Work is in progress on other light nuclear systems, in particular mass seven Am05a and mass fifteen Ca05b . In this paper, we return to 12C to obtain analyzing powers which have been recently measured in a detailed study by Roper et al Rop05 . The data range in neutron laboratory (lab.) energy from 2.2 MeV to 8.5 MeV. In our MCAS results we limit the energy range to a maximum of 4 MeV. Beyond that it may be necessary to take account of higher-energy states of the target nucleus 12C besides the three we have used so far.
The MCAS formulation yields the complete -matrix for the selected scattering system. So, from all entries with the elastic channel, and by using standard formulas, we extract differential cross sections and polarizations as functions of the scattering angle and energy. For neutron scattering, the total cross section as a function of energy can also be found. The total cross section for neutron scattering from 12C was published in Refs. Am03 and Pi05 .
The calculations reported here use the same channel-coupling potentials as were used in Refs. Am03 and Pi05 ; namely, three states of the target nucleus 12C, the ground () and two excited states (, E = 4.389 MeV, , E = 7.6542 MeV). The coupling to the incoming neutron is via a rotational model potential, with quadrupole deformation, . Coupling is taken to second order, and spin-orbit, orbit-orbit and spin-spin interactions as well as a central potential are included. Closed-shell Pauli blocking effects have been included using othogonalizing pseudo-potentials, with very large couplings (1000 MeV). The potential parameters are those given in Ref. Pi05 ; namely, we have not adjusted any parameters in our calculation to compare with the recent data.
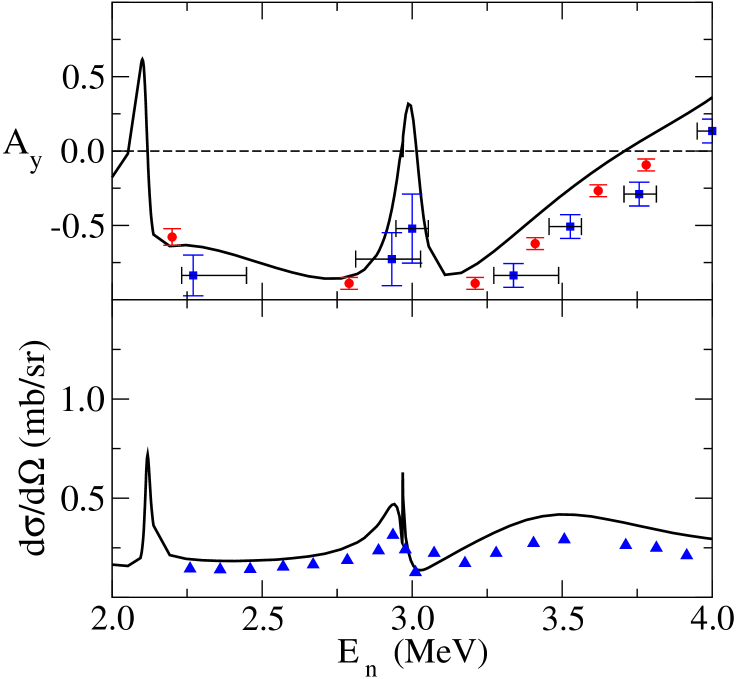
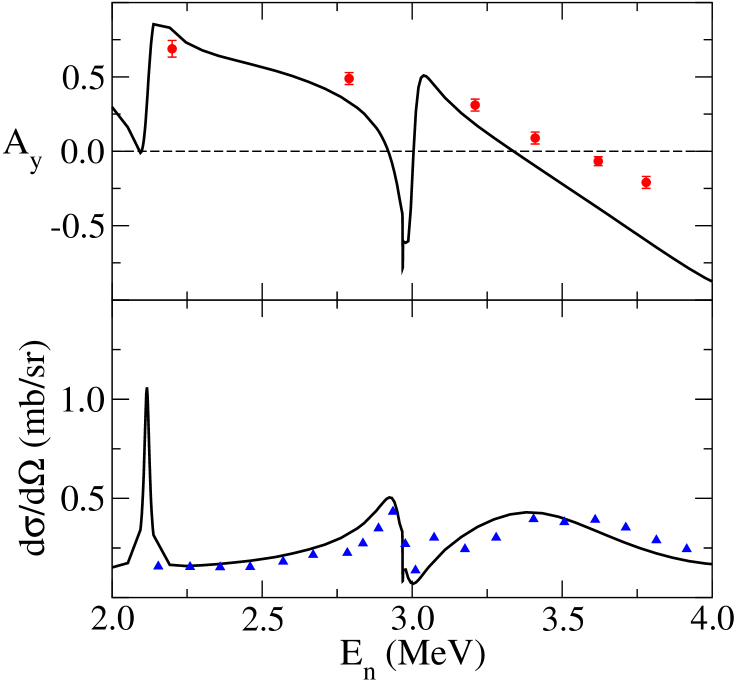
In Figs. 1 and 2, we show the differential cross section and analyzing power as a function of neutron lab. energy () in the range from 2 to 4 MeV for two center-of-mass (c.m.) scattering angles, 43.36∘ and 147.15∘. In both cases, the calculations quite satisfactorily match the data. It should be noted that no adjustment of parameters in the theory was done to achieve these results. None of the data points lie on the narrow resonances at 2.1 and 3.0 MeV, but there is a data point close to the first of these. In Fig. 1, we show also some older data from Bucher et al. Bu59 , taken at 45∘ (square points), which do have measurements in the region of the 3.0 MeV resonance. But the error bars on these data are large.
The MCAS results for differential cross section, solid line in the lower panel of Figs 1 and 2, have never been published before. These theoretical curves compare well with the experimental data from Fasoli et al. Fa73 . The error bars in these data are less than the size of the triangles indicating the data points. Note that the data Fa73 are at slightly different angles than the MCAS calculations, since those were done at the angles of the measurements in Ref. Rop05 .
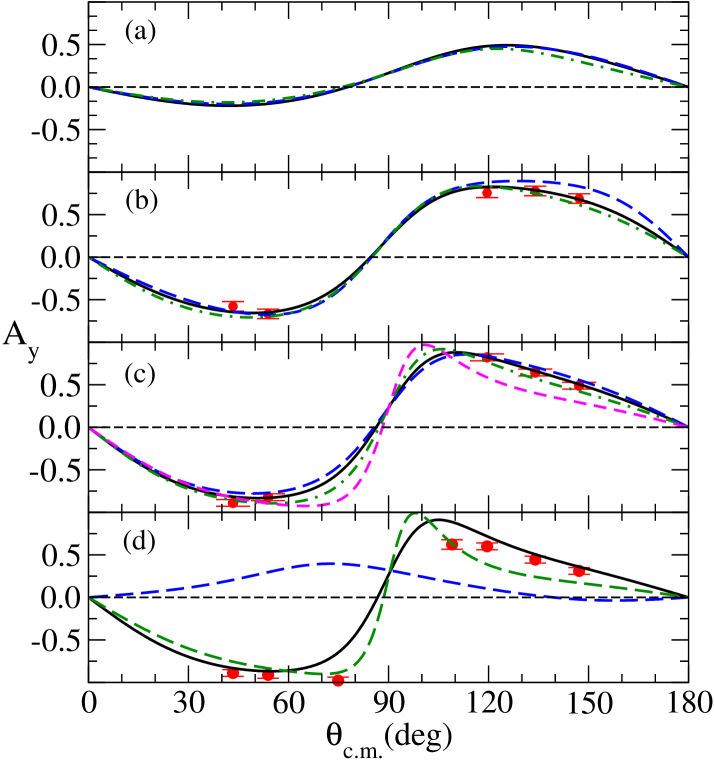
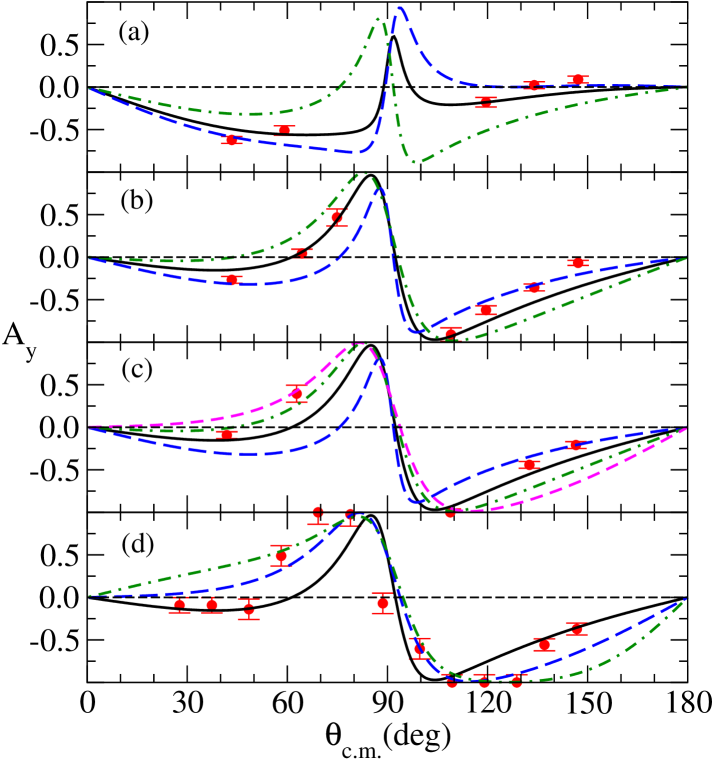
Next, we show a number of graphs of the analyzing power as a function of c.m. angle at various energies in the range 2 to 4 MeV. In these graphs, Figs. 3 and 4, more than one theoretical curve is shown. This is because the shape of the analyzing power as a function of angle is very sensitive to energy near a resonance. Compounding this is the fact that, in the data, there is an experimental spread in the neutron lab. energy ranging from 0.2 to 0.4 MeV, as shown in Fig. 5 of Ref. Rop05 . Very near a narrow resonance, the sensitivity of shape to energy can be extreme. That is most readily seen in our Fig. 5 which we discuss later.
In Figs. 3 and 4, the thick solid line always represents the theoretical result closest to the data points. The long-dashed and dot-dashed lines are for 0.1 MeV different from the energy for the solid line, except for the highest energy considered, in panel (d) in Fig. 4. At all but two of the data sets, the theoretical curve agrees with data within the 0.2 MeV experimental spread in the neutron energy. For energy 2.79 MeV (panel (c) of Fig. 3) and 3.78 MeV (panel (c) of Fig. 4), there is a fourth, short-dashed, curve at an energy with the result closest to that of the data. In these two cases the shape of the MCAS result at the quoted experimental neutron lab. energy is significantly different from that of the data. However, it should be noted that, even in these two cases, the difference between the energy of the closest theoretical representation of the data and the energy at which the data was taken is just at the limit of the experimental uncertainty in the neutron lab. energy. Overall, the agreement between the analyzing powers predicted by MCAS and the data of Ref. Rop05 is very good.
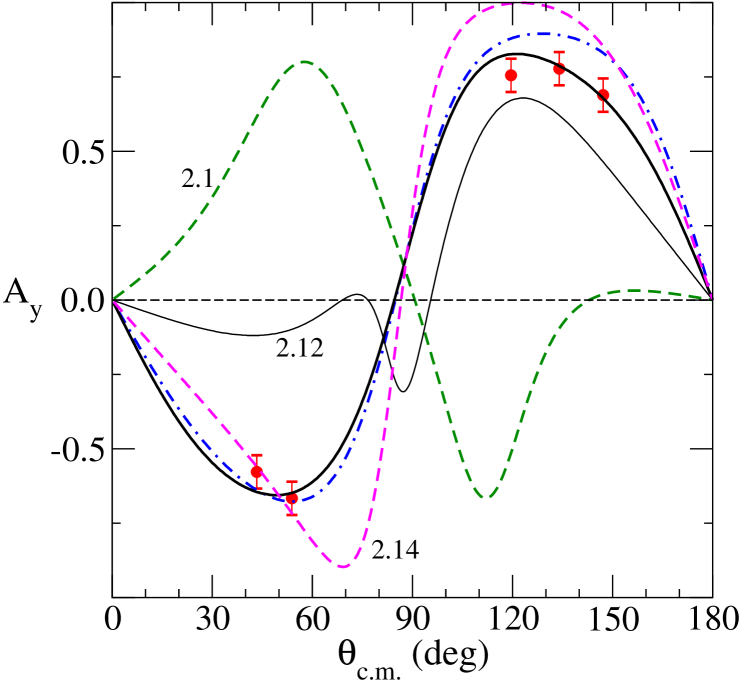
In Fig. 5 the rapid change with energy of the shape of the analyzing power close to the sharp resonance at 2.1 MeV is shown. The curves marked 2.1, 2.12 and 2.14 differ by 20 keV from each other, but they are very different in shape, and from the shape of the data taken at 2.2 MeV.
Determination of the potential parameters (central, spin-spin, orbit-orbit, and spin-orbit) was made in 2003 by fitting the overall features of the experimental spectrum (resonances and bound states) Am03 . The very good agreement between theoretical and experimental total cross section (in C scattering) demonstrates that the model correctly describes the process. The present analysis on new analyzing power data, Ref. Rop05 , gives even more confidence in the reliability of the model, since spin observables are more sensitive quantities to test the interaction mechanism. We believe, therefore, that our model can represent a good starting point for a phase shift analysis. Important to this is the inclusion of spin-spin and orbit-orbit terms, as well as a spin-orbit term in the interaction potential. Similarily important is the expansion to second order in the deformation parameter. Most critically needed is the inclusion of the Pauli principle. With the MCAS approach, that is done by the use of orthogonalizing pseudo-potentials, as detailed in Ref. Ca05 . We conclude that the MCAS theory has predictive power as we reproduce data which were not available when the theory was first used to fit the total cross section in Ref. Am03 .
Acknowledgements.
This research was supported by a grant from the Australian Research Council, by a merit award with the Australian Partners for Advanced Computing, by the Italian MIUR-PRIN Project “Fisica Teorica del Nucleo e dei Sistemi a Più Corpi”, and by the Natural Sciences and Engineering Research Council (NSERC), Canada. KA and JPS also thank the INFN, sezione di Padova, and the Università di Padova for financial support of their visits to Padova for collaboration.References
- (1) K.Amos, L. Canton, G. Pisent, J.P. Svenne, and D. van der Knijff, Nucl. Phys. A728, 65 (2003).
- (2) L. Canton, G. Pisent, J.P. Svenne, D. van der Knijff, K. Amos, and S. Karataglidis, Phys. Rev. Lett. 94, 122503 (2005).
- (3) G. Pisent, J.P. Svenne, L. Canton, K. Amos, S. Karataglidis, and D. van der Knijff, Phys. Rev. C 72, 014601 (2005).
- (4) K. Amos, S. Karataglidis, P. Fraser, D. van der Knijff, J. P. Svenne, L. Canton, and G. Pisent, Workshop on Perspectives for Nuclear Data Evaluation in the Next Decade, Bruyeres-le-Chatel, France, Sept. 2005. Proceedings to be published; arXiv nucl-th/0510030
- (5) L. Canton, G. Pisent, J. P. Svenne, K. Amos, and S. Karataglidis, October, 2005; arXiv nucl-th/0510067
- (6) C.D. Roper, W. Tornow, R.T. Braun, Q. Chen, A. Crowell, D. Gonzales Trotter, C.R. Howell, F. Salinas, R. Setze, R.L. Walter, Z. Chen, H. Tang, and Z. Zhou, Phys. Rev. C 72, 024605 (2005).
- (7) W.P. Bucher, W.B. Beverly, G.C. Cobb, and F.L. Hereford, Phys. Rev. 115, 961 (1959).
- (8) U. Fasoli, A. Metellini, D. Toniolo, and G. Zago, Nucl. Phys. A205, 305 (1973).