Short timescale behavior of colliding heavy nuclei at intermediate energies
Abstract
An Antisymmetrized Molecular Dynamics model is used to explore the collision of 114Cd projectiles with 92Mo target nuclei at E/A=50 MeV over a broad range in impact parameter. The atomic number (Z), velocity, and emission pattern of the reaction products are examined as a function of the impact parameter and the cluster recognition time. The non-central collisions are found to be essentially binary in character resulting in the formation of an excited projectile-like fragment (PLF∗) and target-like fragment (TLF∗). The decay of these fragments occurs on a short timescale, 100t300 fm/c. The average excitation energy deduced for the PLF∗ and TLF∗ ‘saturates for mid-central collisions, 3.5b6 fm, with its magnitude depending on the cluster recognition time. For short cluster recognition times (t=150 fm/c), an average excitation energy as high as 6 MeV is predicted. Short timescale emission leads to a loss of initial correlations and results in features such as an anisotropic emission pattern of both IMFs and alpha particles emitted from the PLF∗ and TLF∗ in peripheral collisions.
pacs:
PACS number(s): 25.70.MnI Introduction
Collision of two heavy-ions at intermediate energies can result in the production of a multi-particle final state Bowman et al. (1991); deSouza et al. (1991); Marie et al. (1997). These multi-particle final states have been experimentally characterized by a wide variety of signals including fragment multiplicity Bowman et al. (1991); deSouza et al. (1991), size distributions Rivet et al. (1998); Ogilvie et al. (1991), emission timescales Kim et al. (1991); Cornell et al. (1995, 1996); Beaulieu et al. (2000), scaling behavior Elliott et al. (2002); Scharenberg et al. (2001); Porile et al. (1989) and the attained excitation energy Cussol et al. (1993). For large fragment multiplicity, within a thermodynamic approach, such multi-fragment states have been interpreted as a transition of the finite nuclear system from a liquid to a gaseous phase Gross (1990); Bondorf et al. (1985); Pochodzalla et al. (1995); Viola (2004). Recent work has investigated the robustness of this conclusion by examining the influence of the surface, through the density dependence of the entropy, on the stability of the nuclear droplet against fragmentation Tõke et al. (2003); Sobotka et al. (2004). All these approaches however focus on the thermodynamic stability of the system. In reality, the decaying system is formed by the collision dynamics which may not equilibrate all degrees of freedom equally Moretto and Wozniak (1993); Viola et al. (2004). In order to understand both the formation and decay of excited nuclear systems involved in the collision process, microscopic approaches have also been followed Bauer (1987); Aichelin (1991); Danielewicz and F.Bertsch (1991); Schnack and Feldmeier (1997); Morawetz (2000); Wada et al. (2004). In order to make direct comparison with experimental data such microscopic models typically utilize a a two-stage approach. In the first phase, a dynamical model is used to describe the collision dynamics. Clusters produced in this phase are subsequently de-excited by a statistical model. Such a two-stage approach typically views the statistical decay stage as decoupled from the dynamical stage that preceded it. In the present work we examine the validity of such a de-coupled hybrid approach. Specifically, we utilize a microscopic model, the Antisymmetrized Molecular Dynamics model, to investigate how the collision proceeds on short timescales and how the reaction characteristics evolve with impact parameter. In addition, we examine whether initial correlations, existing at short times, survive the decay stage and how they are manifested in final distributions.
II Description of the AMD model
To describe the dynamical stage of intermediate energy heavy-ion collisions, we utilize the antisymmetrized molecular dynamics (AMD) model Ono et al. (1992a, b, 2002); Ono and Horiuchi (2004). For the present work, we use the same version of AMD as Ref. Ono et al. (2002) which has been used to describe the multifragmentation reaction of the central collisions at 50 MeV/nucleon.
The description of the dynamics of fragmentation is, in principle, a very complicated quantum many-body problem. In the exact solution of the many-body time-dependent Schrödinger equation, the intermediate and final states should be very complicated states containing a huge number of reaction channels corresponding to different fragmentation configurations. The AMD model respects the existence of channels, while it neglects some of the interference among them. Namely, the total many-body wave function is approximated by
| (1) |
where each channel wave function is parametrized by a set of parameters , and is the time-dependent probability of each channel.
In AMD, we choose the Slater determinant of Gaussian wave packets as the channel wave function
| (2) |
where are the spin-isospin states with or . Thus, the many-body state is parametrized by a set of complex variables , where is the number of nucleons in the system. The width parameter, , is treated as a constant parameter common to all the wave packets. If we ignore the antisymmetrization effect, the real part of corresponds to the position centroid and the imaginary part corresponds to the momentum centroid. This choice of channel wave functions is suitable for fragmentation reactions, where each single particle wave function should be localized within a fragment.
Instead of directly considering the probability in Eq. (1), we solve a stochastic equation of motion for the wave packet centroids , which may be symbolically written as
| (3) |
The first term is the deterministic term derived from the time-dependent variational principle with an assumed effective interaction. The Gogny interaction Dechargé and Gogny (1980) is used in the present work. The second term represents the effect of the stochastic two-nucleon collision process, where a parametrization of the energy-dependent in-medium cross section is adopted. The two-nucleon collision cross-section used is the same as in Ref. Ono et al. (2002) namely,
| (4) |
The collisions are performed with the “physical nucleon coordinates” that take account of the antisymmetrization effects, and then the Pauli blocking in the final state is automatically introduced Ono et al. (1992a, b). The third term is a stochastic fluctuation term that has been introduced in order to respect the change of the width and shape of the single particle distribution Ono and Horiuchi (1996); Ono (1999); Ono et al. (2002). In other words, the combination approximately reproduces the prediction by mean field theories (for a short time period) for the ensemble-averaged single-particle distribution, while each nucleon is localized in phase space for each channel. The term is calculated practically by solving the Vlasov equation (for a short time period) with the same effective interaction as for the term . In the present version of AMD Ono et al. (2002), the property of the fluctuation is chosen in such a way that the coherent single particle motion in the mean field is respected for some time interval until the nucleon collides another nucleon. The last term is a dissipation term related to the fluctuation term . The dissipation term is necessary in order to restore the conservation of energy that is violated by the fluctuation term. The coefficient is given by the condition of energy conservation. However, the form of this term is somehow arbitrary. We shift the variables to the direction of the gradient of the energy expectation value under the constraints of conserved quantities (the center-of-mass variables and the total angular momentum) and global one-body quantities (monopole and quadrupole moments in coordinate and momentum spaces). A complete formulation of AMD can be found in Refs. Ono et al. (2002); Ono and Horiuchi (2004).
The statistical decay of relatively small primary fragments () is calculated by using the code Maruyama et al. (1992) based on the sequential binary decay model by Pühlhofer Pühlhofer (1977). The code employed in the present work also takes account of the emission of composite particles not only in their ground states but also in their excited states with the excitation energy MeV. The experimental information is incorporated for known levels of nuclei, while the Fermi-gas level density is assumed otherwise. For the statistical decay of large primary fragments (), the decay code GEMINI Charity et al. (2001) is employed. In considering the decay of the fragments, both the excitation energy and decay probabilities are calculated for spherical fragments independent of the true shape of the fragments induced by the reaction dynamics. The effect of n-p asymmetry, excitation energy, and deformation on the nuclear level density are not considered in the decay. Introduction of a deformation dependence of the nuclear level density, and in particular the treatment of the continuum, results in a significant modification of the emission rate for fragments that are weakly bound or at high excitation Charity and Sobotka (2005).
The system we have chosen to study is 114Cd + 92Mo at E/A = 50 MeV which can be considered representative of symmetric heavy-ion collisions in this energy domain. We sampled all impact parameters, b, in the interval 0bbmax with a triangular distribution. The maximum impact parameter bmax had a value of 12 fm. The touching sphere configuration distance, given by R=1.2*(AP1/3+AT1/3), is equal to 11.2 fm. The projectile and target were therefore placed at an initial distance of 13 fm for b6.5 fm and 9.8 fm for b6.5 fm. For a given collision, the fate of the colliding system was followed until 300 fm/c. At regular intervals, the positions and momenta of all nucleons in the system were recorded. At a selected time (typically 300 fm/c), which we designate the cluster recognition time, the nucleon distributions are subjected to a cluster recognition algorithm based on the distance between nucleons. The nucleons and clusters that result from cluster recognition are subsequently propagated along Coulomb trajectories and allowed to statistically decay. The identity and momenta of the final reaction products are recorded for subsequent analysis. In order to examine the predictions of this model in a statistically significant manner, we have amassed 25,000 collisions. The calculations were performed on a 646 CPU parallel processor system of which each CPU was either a PowerPC or Power3+. A single collision for this reaction required 12 to 24 CPU-hours on a node depending on the impact parameter.
III General Reaction Characteristics
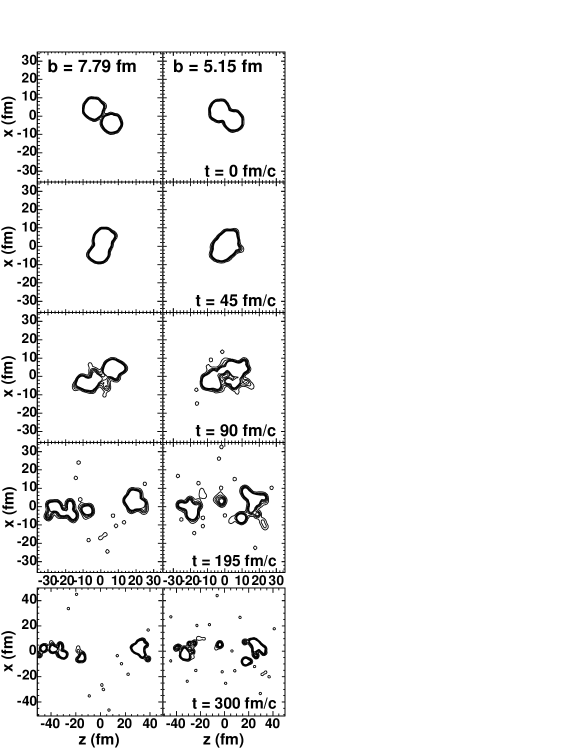
Depicted in Fig. 1 is the density distribution of nucleons in R-space as a function of time for a mid-peripheral (b=7.79 fm) and mid-central (b=5.15) collision. The initial moment in time (t=0) is taken as the near touching configuration of the projectile-target system previously described, with the projectile approaching the target nucleus from the negative z direction. As the di-nuclear system rotates, the initial dumb-bell shape of the two touching nuclei shown in the top panel evolves. While in contact, the two nuclei exchange mass, charge, and energy, governed by nucleon-nucleon scattering within the mean field.
For the presented event with b=7.79 fm, one observes that two large nuclei emerge from the collision at t=90 fm/c revealing the intrinsically binary nature of the collision. In this case, at longer times the elongation of the target-like fragment (left) leads to its breakup into multiple intermediate size nuclei. In the case of the mid-central collision with b=5.15 fm however, the situation is more difficult to discern. At t=90 fm/c, it is unclear whether the system is disassembling into two or three large pieces. What is apparent is that as the two nuclei separate from each other, one observes that the density distributions reflect the nuclear interaction between the projectile and target nuclei through the formation of transiently deformed nuclei. These non-spherical geometries persist up to 300 fm/c for different cluster sizes. Moreover, for both events presented clusters seem to emerge on a relatively fast timescale, t90 fm/c. This early production of clusters indicates that the timescale of the shape/density fluctuations responsible for cluster formation operate on this timescale. It should be noted that a considerable fraction, though not all, of this early stage cluster emission is located between the two large fragments that emerge from the collision. The evolution of the density distributions presented in Fig. 1 can also be viewed from the context of semi-classical colliding liquid drops. Formation of the transiently extended nuclear system by the collision dynamics involves the generation of a considerable amount of “surface” nuclear material as compared to “bulk” nuclear material. In comparison to the original system comprised of the projectile and target nuclei, the multi-fragment final state with multiple clusters requires the formation of a significant amount of surface – an energetically unfavorable change. Thus, once the surface-to-volume ratio has been increased by the collision dynamics, the energy cost of the system re-organizing to the multi-fragment final state is considerably reduced.
We examine the characteristics of the system immediately following this dynamical stage of the collision. The products of the reaction at this stage are designated the “primary” products which statistically de-excite to form the final reaction products which we also refer to as the “secondary” products. For a large ensemble of events we examine the evolution of both primary and secondary distributions with impact parameter, velocity dissipation, and cluster recognition time.
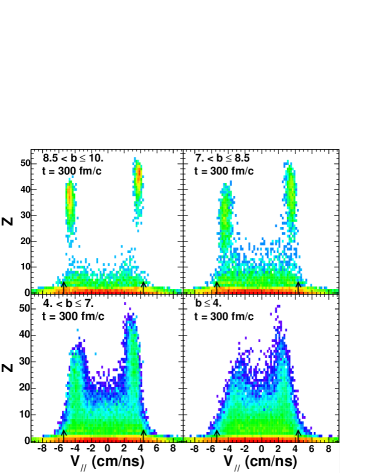
An overview of the collisions studied is presented in Fig. 2, where the correlation between the atomic number and parallel velocity (in the center-of-mass frame) of particles at t=300 fm/c is examined. For the most peripheral collisions (8.5b10 fm) two peaks located at Z47 and 39 are clearly evident. These peaks correspond to the excited projectile-like (PLF∗) and target-like (TLF∗) nuclei respectively and are relatively narrow distributions in velocity centered at V∥=3.8 and -4.7 cm/ns. Also evident is copious production of neutrons (Z=0), hydrogen, and helium nuclei. Smaller in yield, are clusters with Z3 and atomic number less than that of the PLF∗ and TLF∗. This pattern, dominated by the survival of the PLF∗ and TLF∗ for a peripheral collision, reflects a primarily binary nature. For mid-peripheral and mid-central collisions, a similar pattern is observed indicating that in this impact parameter range as well a PLF∗ and TLF∗ survive the dynamical phase, hence these impact parameters are also essentially binary in character. With increasing centrality V decreases and V increases reflecting an increase in the velocity damping. At the same time, the width of the PLF∗ and TLF∗ velocity distributions increases indicating the growth of fluctuations. In addition, with increasing centrality the average atomic number of the PLF∗ and TLF∗ decreases while the yield of clusters with 3Z15 increases. For simplicity, we designate the highest Z cluster with a velocity larger (smaller) than the center-of-mass velocity as the PLF∗ (TLF∗). For b4 fm the decrease in the average Z of the PLF∗ combined with the width of the distribution, lead to an operational definition of intermediate mass fragment, namely IMF: 3Z10. Particles with Z10, manifest broad velocity distributions for the most central collisions. Examination of the most peripheral collisions reveals a clear pattern of how the velocity distribution evolves with the atomic number (Z) of the fragment. Neutrons and hydrogen nuclei in particular have velocity distributions that are centered on velocities between those of the PLF∗ and TLF∗. In contrast, for nuclei with 3Z15 the velocity distribution while broad, clearly has a bimodal nature with each of the two peaks centered close to the PLF∗ and TLF∗ velocities. This bimodal character is also observed for helium nuclei although the distributions are broader. These overall patterns manifested for the most peripheral collisions are also observed for more central collisions.
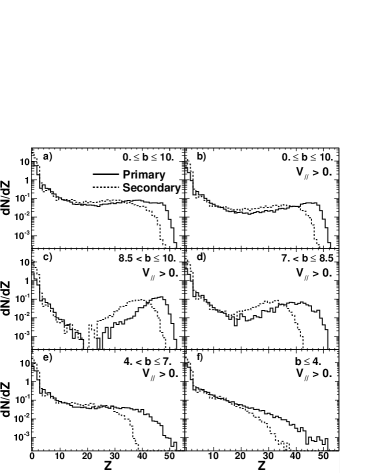
Depicted in Fig. 3 is the dependence of the primary and secondary Z distributions on impact parameter. The Z distribution of particles at t=300 fm/c is the primary distribution and is represented as the solid histogram. Following Coulomb propagation and statistical decay of the excited primary reaction products, the Z distribution of secondary particles is represented by the dashed histogram. The latter distribution includes both primary fragments that did not decay, as well as the decay products of excited primary fragments. All distributions have been normalized to the total number of events for each impact parameter range and therefore represent the average multiplicities. As may be expected from the trends in Fig. 2, the charge distribution for the most peripheral collisions, b10 fm, is largely dominated by two peaks at Z=42 and 48 which correspond to the TLF∗ and PLF∗. In Fig. 3 we therefore focus on smaller impact parameters, b10 fm. In panel a) the Z distributions integrated over impact parameter up to 10 fm are presented. As expected, the yield for neutrons, hydrogen, and helium is large in the primary distribution (solid histogram). A large yield is also observed for 3Z10. Evident for Z30 is a slight double peak in the primary distribution attributable to the presence of the PLF∗ and TLF∗. This double peak structure is eliminated by secondary decay as it is not evident in the dashed histogram. To separate the PLF∗ from the TLF∗, as well as to crudely separate their decay products, we further select particles with the condition V∥0. The resulting primary distribution shown in panel b) manifests only a single peak at large Z, which is located at Z=47. As observed in panel a) the yield of the Z distribution for 3Z30 is similar for both the primary and secondary particles.
We examine the dependence of the Z distribution on impact parameter for V∥0 in Fig. 3c-f. For 8.5b10 fm, Fig. 3c), the primary Z distribution is ’V-shaped’, reminiscent of the ’U-shape’ observed for asymmetric fission. The minimum yield observed near Z20 is deep in comparison to the yield at lower and higher Z indicating that asymmetric splits are strongly preferred over symmetric splits. It is striking that the multiplicity for Z=3-6 is approximately the same as that of Z47 (the PLF∗). The yield ratio for Z=3-6 over Z=45-47 is 0.31/0.370.84, indicating a process or processes resulting in copious production of light IMFs. This similarity in the yield of the light IMF and the PLF∗ can, for example, be understood as the asymmetric binary decay of a precursor PLF∗. Such a perspective is supported by experimental observation. For peripheral collisions of two heavy-ions at intermediate energies, the phenomenon of dynamical fission is well characterized Bocage et al. (2000); Davin et al. (2002); Colin et al. (2003). This dynamical fission has been associated with the deformation of the PLF∗ induced by the collision process. The defining characteristics of this process are the aligned asymmetric binary decay of the PLF∗ and large relative velocities between the two produced fragments. On general grounds one expects that this dynamical process should depend sensitively on both the induced deformation and the excitation of the PLF∗ Piantelli et al. (2002). It is important to observe that the shape of this primary distribution largely survives the process of secondary decay. The main difference between the primary and secondary distributions is that the high Z peak is shifted to lower Z and increases in width. For 7b8.5 fm, Fig. 3d), the shape of the primary distribution is better described as a ’U-shape’. In contrast to the previous impact parameter interval, the minimum located at Z20 is shallow. This decrease in the depth of the minimum can be associated with the increase in the probability of symmetric binary splits relative to asymmetric binary splits. This change of the Z distribution with decreasing impact parameter can be related to an increase in the excitation energy of the PLF∗. In this impact parameter interval, the yield for Z=3-6 is significantly larger than that for Z42. The ratio of the yield of Z=3-6 over the yield of Z=41-43 is 0.66/0.193.47, a change by a factor of 4 as the impact parameter decreases from 8.5b10 fm to 7b8.5 fm. This increase in the ratio is due to both an increase in the IMF yield by a factor of 2 and a decrease in the yield in the vicinity of the PLF∗ peak. The latter decrease reflects the increasing width of the peak in the Z distribution attributable to the PLF∗ with decreasing impact parameter. Following secondary decay the ’U-shape’ is somewhat less pronounced. For yet more central collisions, a ’U-shape’ distribution is not observed even for the primary distribution. In panel e) no clear bump is observed at large Z, indicating the decreased likelihood that a high Z PLF∗ survives to the cluster recognition time of t=300 fm/c. For the most central collisions shown, b 4 fm, the primary Z distribution is exponential over a large range in Z. This exponential behavior of the yield is suppressed for Z30 due to the finite size (atomic number) of the system. The secondary Z distribution for central collisions also exhibits an exponential character for Z3, although the onset of the finite size effects is observed at Z=20. The main effect of secondary decay on the Z distribution, for all impact parameters is to significantly enhance the yield of neutrons, hydrogen, and helium nuclei, while decreasing the maximum Z observed, namely the atomic number of the PLF∗ and TLF∗.
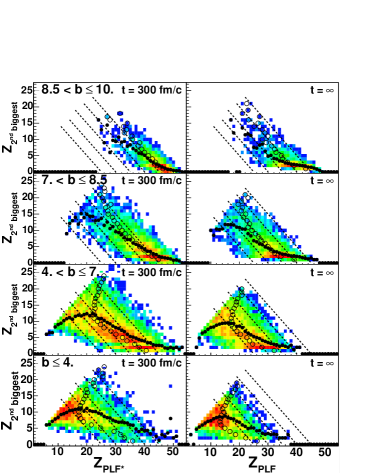
We have investigated whether the similarity of the yield for Z=3-6 and Z for peripheral collisions is an indication that the two largest fragments forward of the center-of-mass originate from a common parent. Displayed in the two-dimensional diagrams of Fig. 4 is the joint probability of observing the largest and second largest fragments both with V∥0. For reference the dashed lines correspond to ZTOT = Z + Z = 45, 40, 35, 30 and 25. The distribution at t=300 fm/c is presented in the left column while the distribution following secondary decay is shown in the right column. In the case of primary fragments (left column), for b4 fm, a clear anti-correlation is observed between the atomic number of the largest and second largest fragment. In order to examine the average behavior of the two dimensional distribution, we also indicate as solid and open circles the Z for a given Z and Z for a given Z. Strong correlation of Z and Z is evidenced by the near overlap of the open and closed circles over an extended range. Divergence of the symbols indicates that either the two fragments do not originate from a common parent or that finite size effects strongly influence the observed correlation. For 8.5b10 fm, ZTOT is almost constant over the range of Z with a value of 45. This value corresponds to an average loss of three charges from the incident Cd nucleus with the observed anti-correlation signaling a conservation of charge between the largest and second largest fragment. This anti-correlation signals that both fragments do on average originate from a common parent fragment. For a second largest fragment with Z=6, the Z is 40 consistent with dynamical breakup Montoya et al. (1994); Davin et al. (2002). While mid-peripheral (mid-central) collisions exhibit an anti-correlation, ZTOT changes from 45 (45) at high Z to 40 (35) at low Z. This change in ZTOT might indicate that the PLF∗ splits into three or more pieces or simply reflect the changing size of the parent fragment over the finite impact parameter interval considered. For b4 fm, the average atomic number of the largest and second largest fragment are closer, Z=20 and 9 respectively, as one might expect for a binary decay at high excitation, consistent with the increased probability of symmetric splits indicated by the Z distribution in Fig. 3. The general trends observed for the primary fragments are also evident following decay in the charge correlation of secondary fragments (right column). Similar charge correlation patterns have been experimentally observed Davin et al. (2002) indicating a transition from asymmetric splits toward those in which all asymmetries are populated. The total charge of the two fragments after secondary decay is typically reduced by 5 to 10 charges as compared to the total charge of the primary fragments. Following secondary decay, the emission of Z=4-6 results in a marked horizontal line in the charge correlation. This feature in the charge correlation has also been experimentally observed and has been previously attributed to dynamical fission Davin et al. (2002).
IV Velocity Dissipation of the PLF∗ and its Excitation
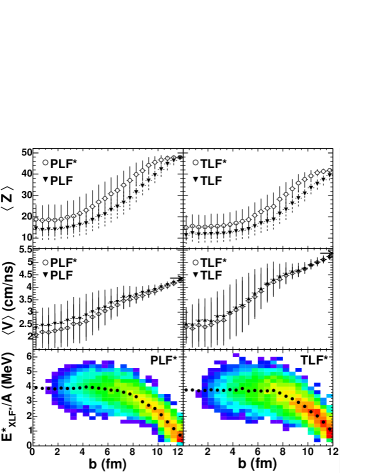
A more quantitative picture of the evolution of the general properties of the PLF∗ and TLF∗ with impact parameter is displayed in Fig. 5. For the most peripheral collisions studied, b10 fm, the Z is 48, the atomic number of the projectile. The Z decreases smoothly with decreasing impact parameter until b3-4 fm. For smaller impact parameters, Z shows no dependence on impact parameter and has a value of 19. For b10 fm, ZPLF, namely the average atomic number following decay, is approximately 4-9 units less than Z and exhibits the same impact parameter dependence as Z. It should be noted that the largest difference between Z and ZPLF is observed for mid-peripheral collisions with an impact parameter 8 fm. The average center-of-mass velocity of the PLF∗, V, also exhibits a smooth dependence on impact parameter, decreasing monotonically from V 4.3 cm/ns for the most peripheral collisions to 2.5 cm/ns for b=3 fm. For more central collisions V only shows a weak dependence on impact parameter. With increasing centrality the width of the velocity damping distribution (indicated by the error bars) increases significantly, indicating the growth of fluctuations.
The predicted velocity damping of the PLF∗ evident in the middle panel is associated with a corresponding increase in the excitation of the PLF∗ as shown in the bottom panel of Fig. 5. Such an association between velocity damping and excitation has been experimentally observed Yanez et al. (2003). While the average E∗/A of the PLF∗ rapidly increases with impact parameter for peripheral collisions, it saturates at 4 MeV by b=6 fm. The trends observed for the PLF∗ are also observed for the TLF∗ as depicted in the right column of Fig. 5. It is interesting to note that the E∗/A for small impact parameters attained for both the PLF∗ and TLF∗ is the same despite the smaller size of the TLF∗ (Z15) as compared to the PLF∗ (Z19). This difference of 20-25% in Z corresponds to a similar difference in A (see Fig. 6). Equal partition of E∗ would thus result in a larger E∗/A for the TLF∗ as compared to the PLF∗. An E∗/A=4 MeV for the PLF∗ would correspond to an E∗/A=5 MeV for the TLF∗. The similarity of E∗/A for both the PLF∗ and TLF∗ is indicative that the degree to which thermalization is achieved is large. For the most peripheral collisions, b12 fm, the non-zero value of the (E∗/A) and (E∗/A) is due in part to the mismatch between the binding energy of the projectile and target in AMD and their real binding energies. This error typically ranges from 0.2 to 0.3 MeV. Additional excitation may occur due to the mean field or Coulomb interaction.
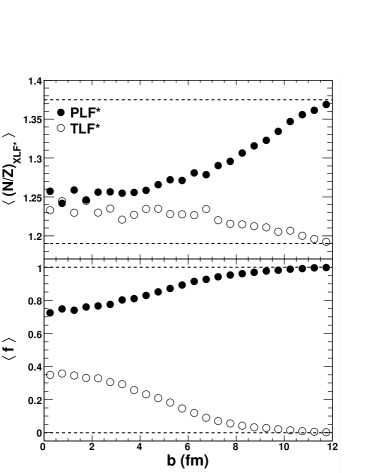
The composition of the excited PLF∗ and TLF∗ that subsequently undergoes decay is indicated in Fig. 6. In this figure the N/Z of both the PLF∗ and TLF∗ are examined as a function of impact parameter. For b6 fm, the N/Z of both PLF∗ and TLF∗ evolves essentially linearly with impact parameter from the initial values of 1.375 and 1.19 for the projectile and target respectively. Over this range of impact parameter, this behavior could be interpreted as equilibration of N/Z. However, the change in N/Z is larger for the PLF∗ as compared to the TLF∗ by a factor of two. This difference reflects the fact that exchange between the PLF∗ and TLF∗ is not the only process occurring thus complicating the interpretation of the change in N/Z in terms of equilibration. For more central collisions, the N/Z remains essentially constant having saturated at a value of 1.24-1.26. The similarity of the average N/Z value for the PLF∗ and TLF∗ could be interpreted as equilibration of this degree-of-freedom. If this is indeed the case, it is interesting to note that for b4 fm, this equilibration is already achieved. For comparison the N/Z of the system is 1.29. The slightly lower N/Z asymptotic value for central collisions as compared to the N/Z of the system suggests either a preferential emission of free neutrons or the production of neutron-rich fragments in the dynamical stage.
We examine the degree to which mixing occurs in the lower panel of Fig. 6. In this figure the dependence of f, the fraction of nucleons in the PLF∗ or TLF∗ that originate from the projectile, on impact parameter is presented. It is interesting to note that for b6 fm, the region in which N/Z changed linearly with b, the fraction of nucleons in the PLF∗ that were originally in the projectile is large, f0.9. Only for smaller impact parameters does the degree of mixing of projectile and target nucleons become larger. Thus, the large change in N/Z does not require large mixing of the projectile and target nucleons. It is instructive to note that the quantity f, appears to saturate for b2 fm with a maximum of 35% of the PLF∗ nucleons originating from the target. For the TLF∗, in the case of small impact parameters, the degree of mixing is similar. It has been experimentally demonstrated that for mid-peripheral collisions the N/Z degree of freedom does not reach equilibrium Tsang et al. (2004). However, the present result indicate that N/Z equilibrium is attained for mid-central collisions, despite the incomplete mixing of the projectile and target nucleons. This result is of significance to future work with radioactive beams, indicating the degree to which the N/Z exotic projectile can be excited while only modestly pertubing its N/Z.
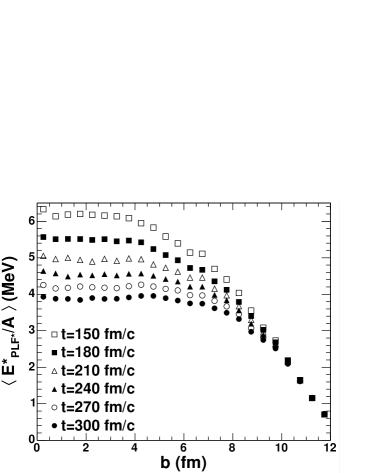
To probe the origin of the saturation in E∗/A of the PLF∗ and TLF∗ for b6 fm observed in Fig. 5, we have investigated the influence of our choice of cluster recognition time on the excitation energy of the PLF∗. We have chosen to recognize the clusters at t= 150, 180, 210, 240, 270, and 300 fm/c and compare the dependence of excitation energy on impact parameter for the different cluster recognition times. As evident in Fig. 7, while for peripheral collisions the average excitation energy is fairly independent of the choice of cluster recognition time, with decreasing impact parameter the average excitation energy deduced depends significantly on the choice of cluster recognition time. For different cluster recognition times one also observes that the onset of the saturation in excitation energy occurs at different impact parameter. For t=300 fm/c the onset of the saturation occurs at b6 fm (25 % of the cross-section) while for t=150 fm/c, the onset occurs at b4 fm (10 % of the cross-section). The events associated with the highest excitation attainable therefore correspond to a significant fraction of the cross-section. For central collisions, the excitation attained is higher the earlier one recognizes the clusters. For an early cluster recognition time, t=150 fm/c, a maximum value of E∗/A6 MeV is attained in comparison to E∗/A4 MeV for t=300 fm/c. Both the trend and magnitude of E∗/A is consistent with the AMD calculations for a more asymmetric system Wada et al. (2004). This rapid decrease in E∗/A is indicative of rapid cooling of the PLF∗. As one may imagine, the choice of a cluster recognition time less than 150 fm/c becomes increasingly problematic due to both the conceptual, as well as practical, problem of distinguishing clusters during the high density phase of the collision.
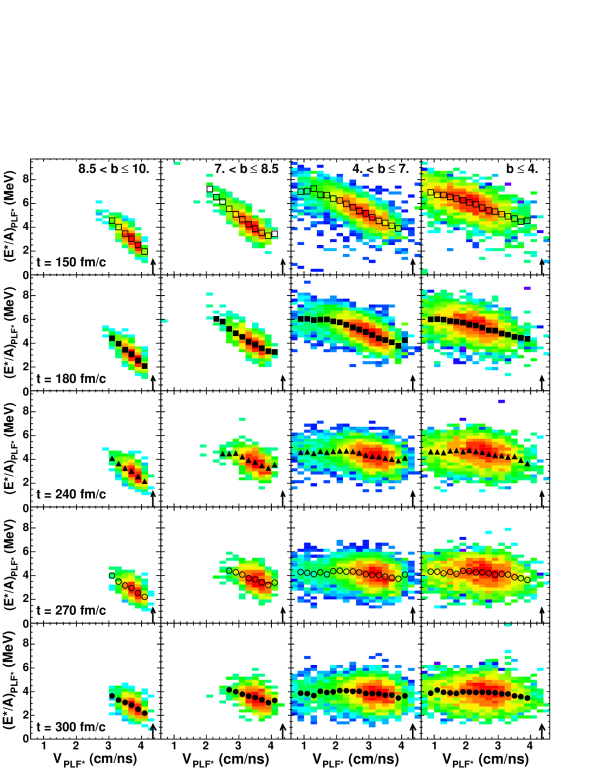
The dependence of V and E∗/A on impact parameter suggests a direct correlation between these two quantities. The correlation between these two quantities as a function of both impact parameter and cluster recognition time is examined in Fig. 8. For peripheral collisions, 8.5b10 fm (leftmost column), at early cluster recognition times, e.g. t=150 fm/c (uppermost panel), a narrow anti-correlated distribution is observed, namely there is a strong dependence of the PLF∗’s excitation, (E∗/A), on its velocity, V. To more easily examine the correlation between the two quantities, the centroid in E∗/A for each bin in V is indicated by the symbol. The significant slope of (E∗/A) with respect to V indicates the strong correlation between PLF∗ excitation and velocity damping. With increasing cluster recognition time, the strong correlation between V and (E∗/A) persists although the width of the distribution increases.
For a fixed cluster recognition time, one observes that with decreasing impact parameter, the dependence of (E∗/A) (symbols) on velocity becomes flatter indicating a weakening dependence on average. The two dimensional distributions also become broader with increasing centrality indicating the growth of fluctuations that attenuate the intrinsic correlation between excitation energy and PLF∗ velocity. Examination of the most central collisions studied (b4 fm) shows that while a modest dependence between E∗/A and V exists at t=150 fm/c, for longer cluster recognition times effectively no dependence of the PLF∗ excitation energy on its velocity is observed. At t=300 fm/c, (E∗/A) does not exhibit any dependence on V. This attenuation of the correlation between excitation energy and velocity of the PLF∗ with increasing cluster recognition time is also observed at intermediate impact parameters.
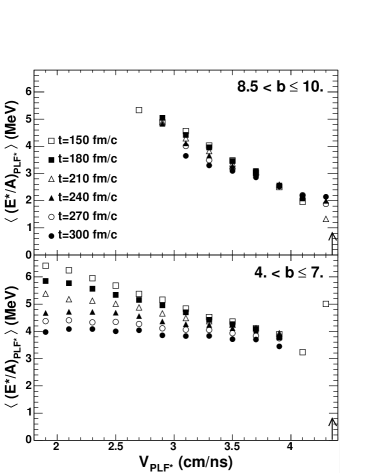
To examine the influence of the cluster recognition time on the most peripheral collisions in a more quantitative manner, we compare in the top panel of Fig. 9 the dependence of the average excitation energy as a function of V for 8.5b10 fm for different cluster recognition times. For low to modest velocity damping, i.e. V3.25 cm/ns, the anti-correlation between the average excitation energy and V is independent of the cluster recognition time. For more damped collisions, however, one does observe a difference between the calculated average excitation energy for different cluster recognition times. For V=4 cm/ns, (E∗/A)=2.15 MeV while for V=3.5 cm/ns, (E∗/A)=3.3 MeV. This average excitation of 3.3 MeV is associated with a velocity damping from beam velocity of 0.86 cm/ns.
In the lower panel of Fig. 9 the dependence of the average excitation energy as a function of V for more central collisions 4b7 fm is shown. In contrast to the more peripheral collisions just discussed, for all values of velocity damping, the average excitation of the PLF∗ depends on the cluster recognition time. Even for the smallest velocity damping (V 3.5 cm/ns) a minimum excitation energy of 3.5 MeV is observed for all cluster recognition times. Cluster recognition times less than 210 fm/c manifest an essentially linear dependence of E∗/A on V while longer cluster recognition times (t240 fm/c) exhibit a significantly non-linear dependence. By t=300 fm/c, E∗/A is essentially independent of V.
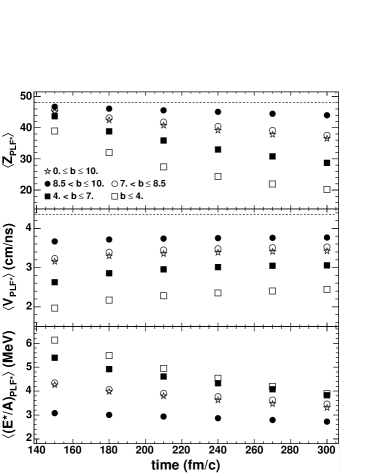
The dependence of some of the average properties of the PLF∗ on both impact parameter and cluster recognition time are summarized in Fig. 10. In the top panel, the average atomic number of the PLF∗, Z, is displayed as a function of cluster recognition time for different impact parameters. For the most peripheral collisions, 8.5b10 fm, and the shortest cluster recognition times, Z47, just below ZBEAM=48 as indicated by the dashed line. Longer cluster recognition times result in a slight decrease in Z to a value of 44 at t=300 fm/c. This reduction in Z corresponds to the emission of charge on a short timescale. For more central collisions a similar behavior is observed although the magnitude of the charge emitted on a short timescale is larger.
In the middle panel of Fig. 10, the trend of V with cluster recognition time and impact parameter is presented. For 8.5b10 fm, essentially no change is observed in V as the cluster recognition time changes from t=150 fm/c to 300 fm/c. For mid-central and central collisions, a small increase in V is discernible as the cluster recognition time increases. This slight increase is attributable to the Coulomb re-acceleration of the PLF∗ following the collision combined with recoil effects due to predominantly backward emission of particles on a short timescale.
The dependence of (E∗/A) on cluster recognition time is depicted in the bottom panel of Fig. 10 for different impact. As previously noted in Fig. 7, for 8.5b10 fm the cluster recognition time has only a weak influence on (E∗/A). Longer cluster recognition times lead to slightly lower (E∗/A), 3.1 MeV for t=150 fm/c as compared to 2.8 MeV at 300 fm/c. More central collisions, however, manifest a more marked dependence. As apparent in Fig. 7, for b4 fm (E∗/A) reaches a value of 6 MeV for the shortest cluster recognition times, while at longer cluster recognition times (E∗/A) is only 4 MeV. This decrease in excitation energy is rapid with most of the decrease occurring from t=150-240 fm/c. This rapid decrease in the excitation energy of the PLF∗ is directly related to the emission of particles over this time interval. As the excited PLF∗ rapidly emits charged particles between t=150-240 fm/c its atomic number decreases while its velocity remains relatively constant. Consequently, the correlation between (E∗/A) and V observed in Fig. 8 is poor for central collisions and long cluster recognition times. Thus, a proper description of this de-excitation of the highly excited PLF∗ requires modeling the statistical decay of the deformed PLF∗.
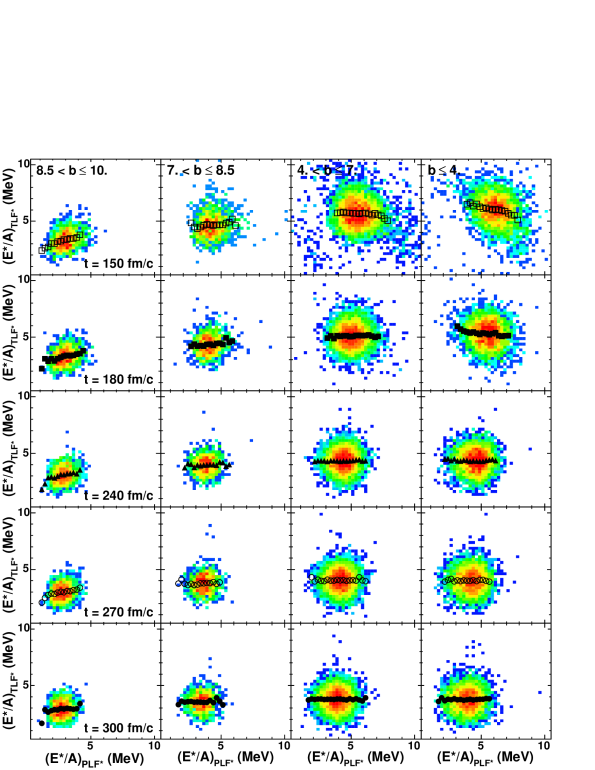
An interesting consequence of this rapid emission from the PLF∗ (and TLF∗) is the amelioration of the correlation between the excitation of the PLF∗ and TLF∗. Displayed in Fig. 11 is the two-dimensional distribution of PLF∗ and TLF∗ excitation energies for different impact parameters and cluster recognition times. For all impact parameters shown, the distribution is broad with the centroid for each (E∗/A) bin indicated by the symbol. For 8.5b10 fm, a slight positive correlation between (E∗/A) and (E∗/A) is evident. Examination of the correlation between the total excitation, E∗, of the PLF∗ and TLF∗ reveals an independence indicating that the observed correlation between (E∗/A) and (E∗/A) is principally due to a correlation between A and A for the most peripheral collisions. In contrast, for the most central collisions, b4 fm, an anti-correlation between (E∗/A) and (E∗/A) is evident. Both E∗ and A of the PLF∗ and TLF∗ manifest the same anti-correlation.
V Emitted Particles
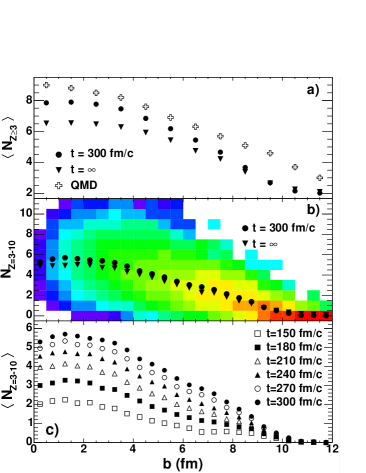
As evident from Fig. 1, as the PLF∗ and TLF∗ separate, clusters are produced. This fragment production as already demonstrated can occur on relatively short time scale impacting the Z, velocity, and (E∗/A) of the PLF∗ and TLF∗. In order to characterize this fast emission process in more detail, we examine the multiplicity of fragments produced as a function of impact parameter in Fig. 12. Displayed in Fig. 12a) is the average multiplicity of fragments, Z3, at t=300 fm/c (solid circles). One observes that this multiplicity increases with decreasing impact parameter and saturates for b3 fm. For the most peripheral collisions the average multiplicity is 2, corresponding to the existence of the only PLF∗ and TLF∗. The average fragment multiplicity reaches a value of 3 at b8-9 fm. For this impact parameter interval, on average, one fragment is produced in coincidence with the PLF∗ and TLF∗. This result is consistent with the asymmetric split of the PLF∗ deduced from the Z distribution (Figs. 3 and 4). For the most central collisions, b3 fm, the average fragments multiplicity is constant and is 8. Following secondary decay (solid triangles) the fragment multiplicity is reduced slightly due to the decay of fragments into particles with Z2. For b7 fm the effect of secondary decay on the fragment multiplicity is negligible while for the most central collisions the average multiplicity decreases from 8 to 6.5. The increased excitation energy associated with more central collisions is no doubt responsible for this increased importance of secondary decay. The multiplicities predicted in the present calculation are compared to those from QMD calculations for the system Xe+Sn Nebauer et al. (1999). Although both systems were simulated for the same incident energy of 50 MeV/nucleon, the Xe+Sn system is 20% larger in A and 15% larger in Z than the present system. The multiplicity deduced by QMD (open crosses) is larger that the ones of the present work at all impact parameters. Given the difference in the system size, the difference between the multiplicities for b6 fm may be reasonable. The most notable feature of this comparison between the two models is the behavior for peripheral collisions, b8 fm. The fragment multiplicities predicted by AMD appear to be more realistic than those predicted by QMD. This difference may be due to spurious decay of the projectile and target in QMD due to the poor description of the ground state properties in that model.
The multiplicity distribution of IMFs (3Z10) as a function of impact parameter is presented in Fig. 12b) for t=300fm/c. While the distribution is narrow for the most peripheral collisions, its width rapidly increases with decreasing impact parameter. The average IMF multiplicity, indicated by the solid circles, evolves from 0 for the most peripheral to 6 for b=3 fm. At an impact parameter of 9 fm, the average IMF multiplicity reaches a value of 1, consistent with Fig. 12a). The average IMF multiplicity is pretty insensitive to secondary decay as indicated by the triangles. Comparison between the fragment multiplicity, Fig. 12a), and IMF multiplicity, Fig. 12b), indicates that even for the most central collisions two fragments with a Z10 are present at t=300fm/c representing a PLF∗ and TLF∗ with approximately 20-25 % of the original projectile and target atomic number. This result contradicts the physical picture of a single source often assumed for central collisions.
Displayed in Fig. 12c) is the average IMF multiplicity dependence on b for different cluster recognition times. The average IMF multiplicity increases with increasing cluster recognition time for all impact parameters . The largest increases are evident for the shortest times, t240 fm/c. For all impact parameters, the IMF multiplicity increases by a factor of 2 to 3 between t=150 fm/c and t=240 fm/c. After t=240 fm/c, the IMF production rate is reduced with an increase of 20-40 % of the IMF multiplicity between t=240 fm/c and t=300 fm/c.
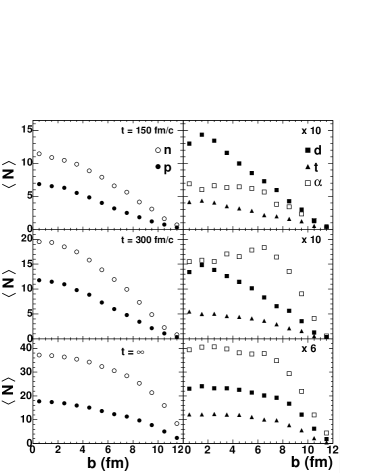
The average multiplicity of light charged particles is examined in Fig. 13 as a function of both impact parameter and cluster recognition time. In the left hand column of Fig. 13 one observes a monotonic increase of the neutron and proton average multiplicities with decreasing impact parameter both at t=150 fm/c and t= 300 fm/c. At t=150 fm/c a slight saturation in the both the neutron and proton multiplicities is observed for the most central collision with maximum average multiplicities of 11.5 and 7 attained. A later cluster recognition time of t=300 fm/c results in approximately a 50% increase in the multiplicities with the saturation of the multiplicities for central collisions being slightly more evident. For this longer cluster recognition time, the average multiplicities associated with central collisions are 19.5 and 12 for neutrons and protons respectively. Following sequential decay (t=), one observes a significant increase in the average multiplicities and a pronounced saturation in the case of the neutrons. This saturation suggests that the total neutron multiplicity, in particular, while providing impact parameter selectivity for peripheral collisions is a poor selector of more central collisions. Moreover, attempting to select central collisions with the neutron multiplicity would on the basis of the cross-section be weighted towards mid-central collisions. This result explains the experimental observation of the persistence of binary collisions associated with large neutron multiplicity Lott et al. (1992). Moreover, these mid-central collisions are associated with the highest average excitation energy attained as presented in Fig. 5.
In the case of the light cluster (d,t, and particle) multiplicities a couple of points are noteworthy. For short cluster recognition time (t=150 fm/c) the average multiplicity of deuterons is relatively linear over the entire impact parameter range and reaches a value of 1.4 for the most central collisions. Alpha particles, in the case of peripheral collisions manifest similar multiplicities, however the average multiplicity of particles saturates for b6 fm. Tritons exhibit lower multiplicities than both deuterons and alpha particles for all impact parameters. For longer cluster recognition time, t=300 fm/c, the deuteron and triton multiplicities remain essentially unchanged as compared to t=150 fm/c. In contrast, the particle multiplicity increases significantly. It is interesting to note that the maximum multiplicity is not associated with central collisions but rather with b7 fm. From this we conclude that significant production/emission, but not deuteron or triton emission occurs on the timescale commensurate with the separation time of the PLF∗ and TLF∗ (150 fm/ct300 fm/c). Following secondary decay (t=) all multiplicities increase significantly. Moreover, only for peripheral collisions, b8 fm, does the average multiplicity of light clusters depend significantly on impact parameter.
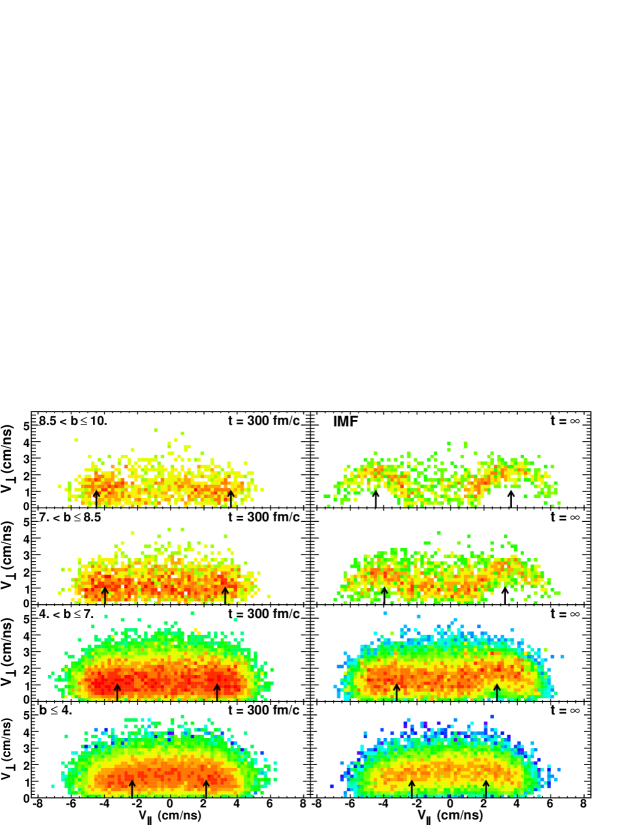
We examine the emission pattern for IMFs (3Z10) in Fig. 14 both at t=300 fm/c and at t= as a function of impact parameter. In examining the most peripheral collisions for t=300 fm/c, we observe two major components which are shifted with respect to the velocity of the PLF∗ and TLF∗ as represented by the arrows in the figure. In addition a minor component is visible centered at the velocity of the center-of-mass i.e. V∥=0. This emission pattern is consistent with anisotropic emission in the frame of the PLF∗ and TLF∗. The most likely origin if the observed backward enhancement, i.e. towards mid-rapidity, is the asymmetry of the collision process itself. With increasing centrality, one observes an increase in this backward yield, as well as an increase in the yield of the mid-velocity component. For b7 fm, this mid-velocity yield becomes considerable. For the most central collisions, the distinct bimodal character evident in more peripheral collisions is replaced by a broad distribution. The impact of Coulomb propagation and secondary decay is shown in the right column of Fig. 14. In contrast to the broad distributions observed at t=300 fm/c, the emission pattern following Coulomb propagation to infinite PLF-TLF separation and secondary decay (right column), reveals a pattern of two semi-circles centered on the PLF∗ and TLF∗ velocities. Such an emission pattern reflects both the Coulomb focusing in the field of the separating PLF∗ and TLF∗, as well as emission of IMFs from the de-exciting PLF∗ and TLF∗. For the most peripheral collisions one observes two distinct Coulomb circles. It is important to note that the intensity pattern along each of these Coulomb circles is not constant but exhibits a significant backward enhancement indicating a memory of the initial angular asymmetry. With decreasing impact parameter, the center of these Coulomb circles shifts toward the center-of-mass and increasingly overlap as the velocity of the PLF∗ and TLF∗ decrease. The Coulomb circles also become less distinct with increasing centrality reflecting both increased excitation of the system and nucleon-nucleon scattering.
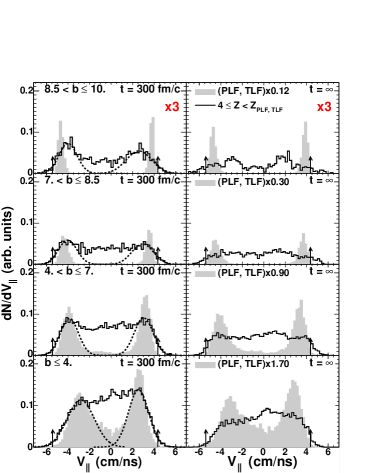
The parallel velocity distributions of the PLF∗, TLF∗, and IMFs and their decay products are shown in Fig. 15 as a function of impact parameter. The velocity distributions of the PLF∗ and TLF∗ (left column) are presented for reference (shaded histogram). For clarity these latter distributions have been scaled relative to the IMF distributions by the factors indicated. In the case of 8.5b10 fm, the PLF∗ and TLF∗ manifest gaussian-like velocity distributions that are relatively narrow and slightly damped from the beam velocity. With decreasing impact parameter, these two distributions move closer in velocity, i.e. exhibit increased damping, and become broader. The parallel velocity distributions of the PLF and TLF (right column) follow the same general trends as those of the PLF∗ and TLF∗. The widths of the secondary large fragments are typically 10-40 % larger than that of the PLF∗ and TLF∗.
For the most peripheral collisions, the IMF velocity distribution (solid histogram) is bimodal with the most probable values of this two peaked distribution displaced toward the center-of-mass velocity as compared to the PLF∗ and TLF∗ velocities, clearly establishing the qualitative trend first observed in Fig. 14. In addition to the two gaussian yields attributable to the emission from the PLF∗ and TLF∗ an additional IMF component, smaller in magnitude, is observed. As previously noted in Fig. 14, this additional component has an average velocity roughly centered at the center-of-mass velocity. For 7b8.5 fm, the relative magnitude of the mid-velocity contribution is increased. With increasing centrality, the shape of the IMF velocity distribution evolves toward a flat distribution reflecting increased fragment production at mid-velocity.
| IMF(PLF∗) | IMF(TLF∗) | |||||
|---|---|---|---|---|---|---|
| b (fm) | V∥ | V∥ | V∥ | V∥ | ||
| 8.5b10 | 3.76 | 2.59 | 1.19 | -4.65 | -4.01 | 0.84 |
| 7b8.5 | 3.51 | 2.93 | 1.01 | -4.31 | -4.03 | 0.86 |
| 4b7 | 2.99 | 3.02 | 0.87 | -3.57 | -3.86 | 0.84 |
| b4 | 2.26 | 2.55 | 0.94 | -2.48 | -2.81 | 1.25 |
We have fit the predicted parallel velocity distributions shown with two gaussians representing the emission from the PLF∗ and TLF∗. The result is depicted as the dashed histogram in Fig. 15. The fit parameters for the PLF∗ and TLF∗ emission are presented in Table 1. With increasing centrality the centroid of the PLF∗ velocity distribution decreases and the centroid of the TLF∗ velocity distribution increases as the reaction is increasingly damped. While for b7 fm, a difference between the average parallel velocity for IMFs and the PLF∗ (or TLF∗) is discernible, for 4b7, the IMF distribution is centered on V. The widths of the distributions are presented for completeness. No consistent trend of significance is evident in the extracted widths.
| b (fm) | MV | P(MV) | ||
|---|---|---|---|---|
| 8.5b10 | 0.09 | 0.09 | 0.06 | 0.26 |
| 7b8.5 | 0.63 | 0.63 | 0.81 | 0.39 |
| 4b7 | 0.99 | 0.94 | 1.53 | 0.44 |
| b4 | 1.61 | 1.77 | 1.51 | 0.31 |
We have also used the two gaussian fits previously described to extract the average multiplicity associated with the PLF∗, TLF∗ and mid-velocity components at t=300 fm/c. The results are tabulated in Table 2. With increasing centrality the multiplicities for each component increases although for the most central collisions, b 7 fm the mid-velocity multiplicity seems to saturate at a value of 1.5. From the peripheral collisions, 8.5b10, to the mid-central collisions, , the average multiplicity of the PLF∗ and TLF∗ components increases by a factor 10 with an increase by 25 for the mid-velocity component. The relative multiplicity of mid-velocity emission as compared to the total PLF∗ and TLF∗ emission increases from 0.26 for peripheral collisions to 0.44 for more central collisions.
The velocity distributions of the IMFs are significantly altered by secondary decay. This influence is most evident for the peripheral collisions where the shape of the primary distribution is nearly completely destroyed. Naturally, the magnitude of this secondary decay is particularly sensitive to the excitation predicted for the primary fragments. The observed influence of secondary decay on the IMF velocity distribution indicates that the IMFs are significantly excited.
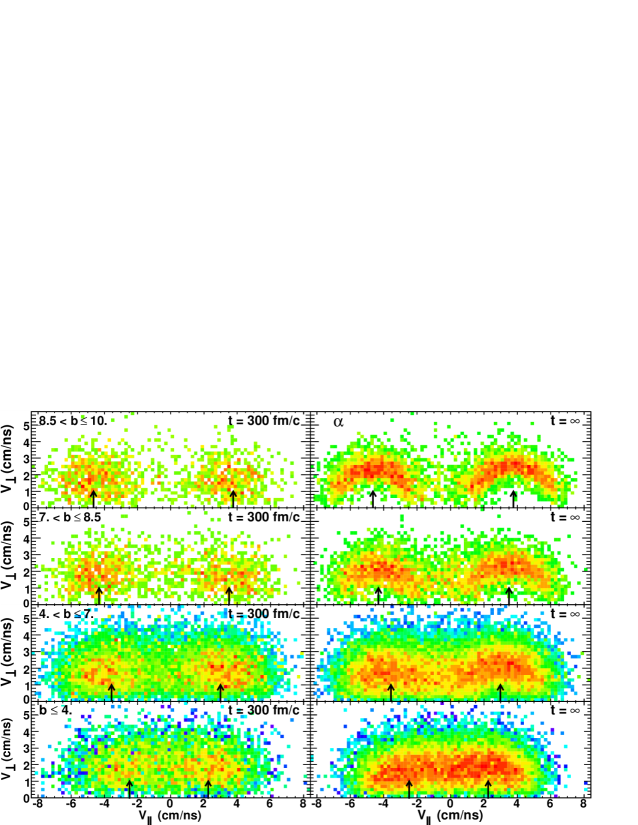
For peripheral collisions, it has been experimentally observed that the emission pattern of particles emitted by the PLF∗ manifests an anisotropic distribution Hudan et al. (2004). This observed anisotropy has been interpreted as the decay of a PLF∗ (and TLF∗) initially deformed by the collision process. To investigate the extent to which such a physical picture is compatible with the AMD model, we have examined the invariant cross-section maps of particles. Depicted in Fig. 16 is the dependence of the invariant cross-section map for particles on impact parameter both at t=300 fm/c and following Coulomb propagation to infinite separation and sequential decay. At t=300 fm/c (left column), for the most peripheral collisions the yield is peaked near the average PLF∗ and TLF∗ velocities (indicated by arrows), though slightly toward the center-of-mass velocity. For these most peripheral collisions one observes that the primary yield centered at mid-velocity is relatively small. With decreasing impact parameter, the primary alpha distributions associated with the PLF∗ and TLF∗ move closer in velocity and increasingly overlap.
Following secondary decay, the Coulomb circles evident for particles are even more striking than those for IMFs. This observation is consistent with the large multiplicity of particles that originate from the de-excitation of the PLF∗ and TLF∗ as compared to the early dynamical stage. The distinct emission pattern observed for 8.5b10 fm is also observed for more central collisions although with increasing centrality the distinct nature of the semi-circles becomes less striking. The ridge of yield which is typically interpreted as Coulomb barrier emission becomes broader and its center moves increasingly toward V∥=0. These trends are consistent with the increased damping, excitation, and reduced size of the PLF∗ (TLF∗) with increasing centrality. For even the most peripheral collisions, the pattern evident in the right column of Fig. 16 is clearly not isotropic, favoring backward emission. As the sequential decay of the PLF∗ following t=300 fm/c is taken to be that of an isolated spherical nucleus without considering the influence of the external Coulomb field of the target on its decay Hudan et al. (2004), it does not contribute to the predicted anisotropy. Within the model calculation, the observed anisotropy has two possible origins: Coulomb focusing of the particles present at t=300 fm/c and the decay of IMFs which are emitted anisotropically.
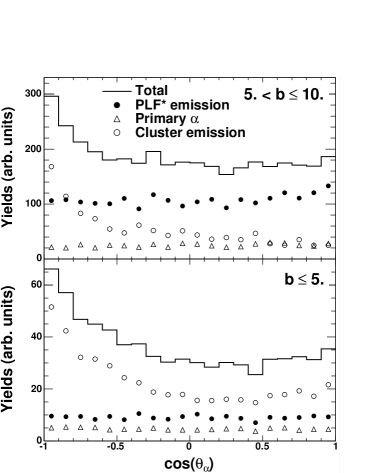
The anisotropic emission of particles along the PLF∗ Coulomb ridge has recently been proposed to be related to the enhanced backward decay of the excited PLF∗ due to the nucleus-nucleus interaction Hudan et al. (2004). Displayed in Fig. 17 is the particle yield along the Coulomb ridge for “peripheral” collisions, 5b10 fm, and “central” collisions, b5 fm. Alpha particles were selected to be “Coulomb barrier” particles by restriction on their velocities, namely Vα 3.5 cm/ns in the PLF∗ frame. In both cases shown, the total particle yield (solid histogram) is not symmetric with respect to emission transverse to the PLF∗ direction, namely cos()=0. Emission in the backward direction cos()0 is enhanced with respect to the forward direction. This enhancement is more pronounced for the central collisions. For the peripheral collisions, the emission yield for cos()= -1 is approximately 1.7 times the yield emitted in the transverse direction. In contrast, the forward emission yield cos()= +1 is approximately the same as the transverse yield. Comparison of the integrated yield with -1cos()0, Ybackward(), to 0cos()+1, Yforward(), reveals that backward emission is enhanced by 19% as compared to forward emission. For more central collisions (bottom panel), comparison of the integrated yield reveals that backward emission is enhanced by 39% as compared to forward emission.
We have investigated the origin of this backward enhancement, by examining the possible sources of particles. Alpha particles are “tagged” as being either a) “primary”, namely those originating at the time of cluster recognition (t=300 fm/c), b) PLF∗ alphas or c) cluster alphas i.e. those that result from the secondary decay of primary IMFs. As expected, PLF∗ emission is essentially isotropic. It is evident in Fig. 17 that for both peripheral and central collisions, primary alphas (open triangles) on the PLF∗ Coulomb ridge are isotropic. Evidently the Coulomb focusing of primary particles by the PLF∗ and TLF∗ does not contribute to the anisotropy observed in Fig. 16. The large backward enhancement observed for the total particle yield is associated with the particles that originate from the secondary decay of primary IMFs. Hence, it is the anisotropy of the primary IMFs that is responsible for the anisotropy of particles associated with Coulomb barrier energies. Quantitative comparison of the the various components reveals that for peripheral collisions the ratio Ybackward()/Yforward() associated with the decay of primary clusters is 2.2, while the same ratio for PLF∗ emission or primary emission is 0.9. In the case of more central collisions, the ratio Ybackward()/Yforward() associated with the decay of primary clusters is 1.7. The yield ratio for PLF∗ emission and primary emission is 1.0 in this impact parameter interval.
The anisotropy observed for the decay of primary clusters is consistent with the emission pattern of IMFs as shown in Fig. 14. This feeding of particles to the PLF∗ Coulomb ridge from IMF secondary decay is also consistent with the fact that IMFs are produced excited, even for the most peripheral collisions. In fact, the average excitation energy of the IMFs is relatively independent of the impact parameter. For the most peripheral collisions, E∗/A of the IMFs is typically 2.5 to 3 MeV with the higher values associated with IMFs produced around the center-of-mass velocity. With increasing centrality, E∗/A becomes independent of the IMF velocity and reaches a typical value of 3 MeV. Such an excitation energy is in agreement with the excitation energy experimentally deduced for IMFs produced in central collisions Hudan et al. (2003). Investigation of the width of the IMF excitation energy distribution reveals that it is large and approximately independent of the impact parameter.
In addition to the anisotropies predicted by the model, in reality the anisotropic emission pattern of particles can have additional origins. Although the PLF∗ is clearly deformed for t300 fm/c (as shown in Fig. 1), the statistical decay of the PLF∗ (and TLF∗) is assumed to be isotropic. However, if the collision dynamics preferentially “prepares” the system in a configuration that favors emission toward the center-of-mass, the observed emission pattern will certainly be anisotropic. An example of such a favored configuration would be a di-nuclear configuration of the PLF∗ decaying into an IMF and residue with the IMF preferentially oriented toward mid-rapidity. If the di-nuclear configuration prepared lies outside the saddle point for such a system, then the excitation energy of the di-nuclear configuration does not influence the decay probability and the decay is clearly non-statistical. However, if the di-nuclear configuration lies inside the saddle point, excitation energy does influence the decay probability and the emission can be considered statistical. In this case, explicit treatment of the deformation within a statistical framework is necessary Charity and Sobotka (2005). The observed anisotropy under such conditions will depend sensitively on the emission time relative to the rotational period of the di-nuclear system. Of course such a schematic description of the binary decay of the PLF∗ could be extended to ternary and quaternary decays. It should also be noted that such short timescale emission when the nuclei are in proximity of each other and can also be influenced by tidal effects Charity et al. (2001).
VI Summary and Conclusions
Using the AMD model, we have examined the dynamical phase of a heavy-ion collision at intermediate energy. We have investigated how observables such as the size (Z), velocity, and excitation of the reaction products evolve during the early stages of the collision. The de-excitation of the initial reaction products is calculated with a statistical decay code and the survival of these initial observables is examined.
We have investigated how the characteristics of the two large remnants in the reaction evolve with impact parameter. Both the Z and V of the PLF∗ and TLF∗ decrease smoothly as centrality increases up to an impact parameter of 4 fm. As the centrality increases from the most peripheral collisions, the PLF∗’s velocity is increasingly damped from the projectile velocity. Concurrent with this damping, the width of the velocity distribution increases. Although the average velocity is largely unchanged by secondary decay, the width of the velocity distribution is typically increased by 10-40 %. For smaller impact parameters, b3-4 fm, the average atomic number and velocity of the two reaction partners are independent of impact parameter. Associated with these changes in the size and velocity and size of the PLF∗ and TLF∗, one also observes that the E∗/A of the PLF∗ and TLF∗ increases as the impact parameter decreases from an initial value of 0.7-1.1 MeV upto 4 MeV. The maximum excitation energy is attained for an impact parameter of 6 fm. Smaller impact parameters do not result in larger values of E∗/A. These observations suggest that the peripheral collisions on one side and the most central collisions on the other side correspond to different dynamics regime although simulated with the same ingredients.
Peripheral collisions, as may be expected, exhibit a binary nature with a strong memory of the entrance channel. In such collisions, a transiently deformed PLF∗ and TLF∗ are recognizable as early as 100 fm/c after the collision. The deformation of these reaction products persists for a considerable time, t300 fm/c. In addition to the PLF∗ and TLF∗, nucleons, light charged particles, and IMFs are also produced in the dynamical phase. The latter clusters, are preferentially located between the PLF∗ and TLF∗. The Z distribution of particles with V∥0 strongly favors asymmetric splits. The population of symmetric splits increases for mid-peripheral collisions reflecting an increase in the excitation energy of the PLF∗. The excitation energy of the PLF∗ is strongly correlated with its velocity damping. Both the E∗/A and V in this impact parameter range are found to be independent of the cluster recognition time. The correlation between the excitation energy of the PLF∗ and velocity damping is the same for the different cluster recognition times studied. The general insensitivity of V to cluster recognition time makes it a robust signal of the impact parameter. The excitation energy of the PLF∗ is slightly correlated with the excitation energy of the TLF∗ for early cluster recognition times. Even the small particle emission that occurs on short timescale is sufficient to destroy this correlation by t=300 fm/c.
In contrast to peripheral collisions which exhibit a strong binary character, the most central collisions do not manifest as much memory of the entrance channel. Such collisions are no longer dominated by two large fragments, namely the PLF∗ and TLF∗. However, if we designate the largest fragment forward and backward of the center-of-mass as the PLF∗ and TLF∗, their characteristics, Z, V and E∗/A, are largely unchanged as b decreases for b4 fm. Therefore, for the innermost 10 % of the total cross-section, the maximum degree of excitation for such collisions is attained. This broad range of impact parameters associated with high excitation underscores the importance of considering the breakup of non-spherical geometries le Fèvre et al. (1999). Moreover, for these small impact parameters, the quantitative characteristics of the PLF∗ and TLF∗, Z and E∗/A, depend on the cluster recognition time. For early cluster recognition time (t=150 fm/c) an average excitation energy of 6 MeV is reached, while a longer cluster recognition time (300 fm/c) results in E∗/A of 4 MeV. This decrease in E∗/A indicates a rapid de-excitation during the dynamical stage, suggesting significant nucleon and cluster emission on a short timescale.
Direct examination of the multiplicities of emitted particles reveals that the IMF multiplicity increases smoothly with increasing centrality and saturates for an impact parameter of 3 fm. At t=300 fm/c, the average IMF multiplicity reaches unity for an impact parameter of 9 fm. At all impact parameters and for t150 fm/c, the IMF emission rate decreases monotonically with increasing cluster recognition time. The velocity distribution of the produced IMFs at t=300 fm/c is bimodal and reveals preferential emission from the PLF∗ and TLF∗ towards the center-of-mass. The emission pattern of particles at t= also exhibits a distinct preferential emission towards the center-of-mass. This anisotropy however, is not due to the anisotropic emission of primary particles or evaporation from the PLF∗ and TLF∗, but arises from the secondary decay of anisotropically emitted primary IMFs. The multiplicity of neutrons saturates for mid-central collisions, making neutron multiplicity a poor selector of central collisions. The geometric cross-section combined together with the saturation of excitation energy for mid-peripheral collisions may explain the observed persistence of binary collisions at intermediate energies even when the largest neutron multiplicities are selected Lott et al. (1992).
The large excitation energy reached in the collision leads to rapid particle emission on the dynamical timescale. However, the present treatment of the short timescale decay involves several simplifications. The role of deformation in the decay is neglected as are both Coulomb and nuclear proximity effects. In addition the excitation energy is calculated relative to clusters that are at the ground-state both in shape and density. These simplifications may have a non-negligible impact on the characteristics of the fragmenting system. This rapid de-excitation emphasizes the need for a hybrid statistical-dynamical model that considers in a more realistic manner the statistical decay of the transiently deformed nuclei from times as short as 100 fm/c. Development of such a hybrid model would represent a new and potentially powerful tool in understanding the dynamics of intermediate energy heavy-ion collisions, as well as cluster formation on short timescales.
Acknowledgements.
This work was supported by the U.S. Department of Energy under DE-FG02-92ER40714 (IU) and in part by Shared University Research grants from IBM, Inc. to Indiana University. In addition, A. O. would like to thank the National Superconducting Cyclotron Laboratory at Michigan State University for the warm hospitality extended to him during his long term stay.References
- Bowman et al. (1991) D. R. Bowman et al., Phys. Rev. Lett. 67, 1527 (1991).
- deSouza et al. (1991) R. T. deSouza et al., Phys. Lett. B 268, 6 (1991).
- Marie et al. (1997) N. Marie et al., Phys. Lett. B 391, 15 (1997).
- Rivet et al. (1998) M. F. Rivet et al., Phys. Lett. B 430, 217 (1998).
- Ogilvie et al. (1991) C. A. Ogilvie et al., Phys. Rev. Lett. 67, 1214 (1991).
- Kim et al. (1991) Y. D. Kim et al., Phys. Rev. Lett. 67, 14 (1991).
- Cornell et al. (1995) E. Cornell et al., Phys. Rev. Lett. 75, 1475 (1995).
- Cornell et al. (1996) E. Cornell et al., Phys. Rev. Lett 77, 4508 (1996).
- Beaulieu et al. (2000) L. Beaulieu et al., Phys. Rev. Lett. 84, 5971 (2000).
- Elliott et al. (2002) J. B. Elliott et al., Phys. Rev. Lett. 88, 042701 (2002).
- Scharenberg et al. (2001) R. P. Scharenberg et al., Phys. Rev. C 64, 054602 (2001).
- Porile et al. (1989) N. T. Porile et al., Phys. Rev. C. 39, 1914 (1989).
- Cussol et al. (1993) D. Cussol et al., Nucl. Phys. A 561, 298 (1993).
- Gross (1990) D. H. E. Gross, Rep. Prog. Phys. 53, 605 (1990).
- Bondorf et al. (1985) J. P. Bondorf et al., Nucl. Phys. A 443, 321 (1985).
- Pochodzalla et al. (1995) J. Pochodzalla et al., Phys. Rev. Lett. 75, 1040 (1995).
- Viola (2004) V. E. Viola, Nucl. Phys. A 734, 437 (2004).
- Tõke et al. (2003) J. Tõke et al., Phys. Rev. C 67, 034609 (2003).
- Sobotka et al. (2004) L. G. Sobotka et al., Phys. Rev. Lett. 93, 132702 (2004).
- Moretto and Wozniak (1993) L. G. Moretto and G. J. Wozniak, Annu. Rev. Nucl. Part. Sci. 43, 379 (1993).
- Viola et al. (2004) V. E. Viola et al., Phys. Rev. Lett. 93, 132701 (2004).
- Bauer (1987) W. Bauer, Nucl. Phys. A. 471, 604 (1987).
- Aichelin (1991) J. Aichelin, Phys. Rep. 202, 233 (1991).
- Danielewicz and F.Bertsch (1991) P. Danielewicz and G. F.Bertsch, Nucl. Phys. A 533, 712 (1991).
- Schnack and Feldmeier (1997) J. Schnack and H. Feldmeier, Phys. Lett. B 409, 6 (1997).
- Morawetz (2000) K. Morawetz, Phys. Rev. C 62, 044606 (2000).
- Wada et al. (2004) R. Wada et al., Phys. Rev. C 69, 044610 (2004).
- Ono et al. (1992a) A. Ono, H. Horiuchi, T. Maruyama, and A. Ohnishi, Phys. Rev. Lett. 68, 2898 (1992a).
- Ono et al. (1992b) A. Ono, H. Horiuchi, T. Maruyama, and A. Ohnishi, Prog. Theor. Phys. 87, 1185 (1992b).
- Ono et al. (2002) A. Ono, S. Hudan, A. Chbihi, and J. D. Frankland, Phys. Rev. C 66, 014603 (2002).
- Ono and Horiuchi (2004) A. Ono and H. Horiuchi, Prog. Part. Nucl. Phys. 53, 501 (2004).
- Dechargé and Gogny (1980) J. Dechargé and D. Gogny, Phys. Rev. C 21, 1568 (1980).
- Ono and Horiuchi (1996) A. Ono and H. Horiuchi, Phys. Rev. C 53, 2958 (1996).
- Ono (1999) A. Ono, Phys. Rev. C 59, 853 (1999).
- Maruyama et al. (1992) T. Maruyama, A. Ono, A. Ohnishi, and H. Horiuchi, Prog. Theor. Phys. 87, 1367 (1992).
- Pühlhofer (1977) F. Pühlhofer, Nucl. Phys. A 280, 267 (1977).
- Charity et al. (2001) R. J. Charity et al., Phys. Rev. C. 63, 024611 (2001).
- Charity and Sobotka (2005) R. J. Charity and L. G. Sobotka, Phys. Rev. C 71, 024310 (2005).
- Bocage et al. (2000) F. Bocage et al., Nucl. Phys. A. 676, 391 (2000).
- Davin et al. (2002) B. Davin et al., Phys. Rev. C. 65, 064614 (2002).
- Colin et al. (2003) J. Colin et al., Phys. Rev. C 67, 064603 (2003).
- Piantelli et al. (2002) S. Piantelli et al., Phys. Rev. Lett. 88, 052701 (2002).
- Montoya et al. (1994) C. P. Montoya et al., Phys. Rev. Lett. 73, 3070 (1994).
- Yanez et al. (2003) R. Yanez et al., Phys. Rev. C. 68, 011602(R) (2003).
- Tsang et al. (2004) M. B. Tsang et al., Phys. Rev. Lett. 92, 062701 (2004).
- Nebauer et al. (1999) R. Nebauer et al., Nucl. Phys. A. 658, 67 (1999).
- Lott et al. (1992) B. Lott et al., Phys. Rev. Lett. 68, 3141 (1992).
- Hudan et al. (2004) S. Hudan et al., Phys. Rev. C 70, 031601(R) (2004).
- Hudan et al. (2003) S. Hudan et al., Phys. Rev. C 67, 064613 (2003).
- le Fèvre et al. (1999) A. le Fèvre, M. Ploszajczak, and V. D. Toneev, Phys. Rev. C 60, 051602 (1999).