Signals in Single-Event Pion Interferometry for Granular Sources of Quark-Gluon Plasma Droplets
Abstract
We investigate two-pion Bose-Einstein correlations of quark-gluon plasma droplet sources in single-event measurements. We find that the distribution of the fluctuation between correlation functions of the single- and mixed-events provide useful signals to detect the granular structure of the source.
pacs:
25.75.-q, 25.75.Nq, 25.75.GzI Introduction
Recently, there has been much progress in the experimental search for the quark-gluon plasma Gyu04 ; Rik04 . While there are many indications suggesting the presence of a very dense matter produced in high-energy heavy-ion collisions Gyu04 ; Rik04 , a very important question is whether the produced dense matter is a quark-gluon plasma. If it is a quark-gluon plasma, it will undergo a phase transition from the quark-gluon plasma phase to the hadronic phase. It is desirable to search for the signature for the phase transition of the quark-gluon plasma.
The signature for the phase transition however depends sensitively on the order of the transition. Previously, it was suggested by Witten and many other workers that a granular structure of droplets occurs in a first-order QCD phase transition, and the observation of the granular structure can be used as a signature for a first-order QCD phase transition Wit84 ; Sei89 ; Kaj91 ; Pra92 ; Cse92 ; Ven94 ; Zha95 ; Ala99 ; Zha00 ; Cse03 ; Ran04 ; Zha04 ; Ran04a .
In a recent analysis, a granular emitting source of droplets was put forth to explain the HBT interferometry puzzle for nucleus-nucleus collisions at RHIC Zha04 . The suggestion was based on the observation that in the hydrodynamical model Ris96 ; Ris98 , the particle emission time scales with the radius of the droplet. Particles will be emitted earlier if the radius of the droplet is smaller, as in a source of many droplets. An earlier emission time will lead to a smaller extracted HBT radius . As a result, the value of can be close to for a granular quark-gluon plasma source Zha04 .
Previously, Pratt studied the HBT interferometry of granular droplets by averaging over many events Pra92 . Methods to detect a granular structure by the single-event intensity interferometry were recently proposed Won04 . It was found that the single-event correlation function from a chaotic source of granular droplets exhibits large fluctuations, with maxima and minima at relative momenta which depend on the relative coordinates of the droplet centers. The presence of this type of maxima and minima of a single-event correlation function at many relative momenta is a signature for a granular structure and a first-order QCD phase transition Won04 .
The difficulty of using the single-event two-pion interferometry at RHIC arises because of the small number of pion pairs with small relative momenta. In a typical single event of a nearly head-on collision at very high energies at RHIC, the number of identical pions is of the order of a few thousand. The number of observed identical pions is only a small fraction of this number. For example, the number of identical pions detected in the STAR Collaboration in the most central Au-Au collisions at RHIC is of the order of a few hundred Ada03 . Although the number of pairs of identical pions in the event varies as , only a small fraction of these pairs have relative momentum small enough to be useful in a HBT analysis. The number of pion pairs in each relative momentum bin may be so small that there can be large associated statistical errors.
Instead of trying to obtain the detailed granular structure of the emitting source in each event at present, it will be useful in the initial stage to have a more modest goal. It is desirable to see whether the correlation functions indicate possible signals for a granular structure. More refined study of the granular structure can follow after the initial stage becomes successful.
Accordingly, we shall try to outline a method to extract the signals for the granular structure. Our idea is to calculate the fluctuations of the single-event correlation function relative to its corresponding mixed-event correlation function. The difference constitutes the “signal” for the event in question. The distribution of these fluctuations (in units of their statistical errors), collected for a large number of single-events to enhance statistics, would have a wider distribution for a granular structure, compared to those from emitting source without the granular structure. The distribution of the correlation function fluctuations provide a useful tool to detect the granular structure of the source. In particular, the root-mean-square fluctuation, in the case of a granular droplet structure, increases when the number of droplets decreases. If the phase transition is accompanied by only a few number of droplets, the signal may be large enough to make it detectable. In what follows, we would like to analyze whether this method may be feasible.
II Single-event and mixed-event two-pion correlation functions
The two-particle Bose-Einstein correlation function for the detection of identical pions with laboratory momenta and is defined as where is the two-particle momentum distribution and is the single-particle momentum distribution with momentum . For a chaotic pion-emitting source, is
| (1) |
where is the magnitude of the amplitude for emitting a pion with 4-momentum at . The two-particle distribution function can be expressed as
| (2) |
where is the two-pion wave function. Neglecting the absorption of the emitted pions by other droplets, is simply Won94
| (3) |
The correlation function is in general a function of the 4-dimensional momentum and . Previous results of the single-event correlation function of granular droplets indicate large fluctuations as a function of the relative 4-momentum , having maxima and minima at locations which depend on the relative coordinates of the droplet centers Won04 . To map out the details of such a multi-dimensional correlation function, it is necessary to have a large number of pion pairs in a single event which may be beyond the capabilities of present detectors and accelerators. With limited statistics as would likely be the case, we can first study the simplifying case by concentrating on a small number of degree of freedom and integrating out other degrees of freedom so that the statistical errors in the correlation function can be smaller. For this purpose, we shall study the correlation function as a function of the variable for which the other degrees of freedom have been integrated out.
In our numerical work for a granular source with droplets, we obtain the single-event and mixed-event two-pion correlation functions for the granular source with the following steps:
Step 1: Generate the space-time coordinates of the droplet centers according to a distribution of the droplet centers.
Step 2: Select the two emitting-pions from the droplets randomly, and get the space-time coordinates and of the pions in the laboratory frame according to the density distribution of the droplets, the coordinates of the droplet centers, and the collective velocities at the emission points .
Step 3: Generate the momenta and of the two pions in the frame in which the source element is at rest according to the distribution , taken to be the Bose-Einstein distribution characterized by the temperature , and obtain their momenta and in the laboratory frame by Lorentz transformation if the source element is boosted in the laboratory frame.
Step 4: Accumulate the event in the bin of the corresponding relative momentum variable with the weight factor for the probability for a pair of uncorrelated pions of relative momentum , and with the weight factor for the probability for a pair of correlated pions of relative momentum ,
| (4) |
| (5) | |||||
where is the energy of the th pion in the frame in which the source element at is at rest, which is obtained from by a reverse Lorentz transformation with the collective velocity .
Step 5: Repeat steps 2 through 4 for pairs of pions in a single event. We label the distributions obtained for for a pair of uncorrelated pions by and the distribution of for a pair of correlated pions by .
Step 6: Repeat steps 1 through 5 for number of different events, and obtain the mixed-event correlated and uncorrelated pion-pair distributions and , by summing and of the different events.
Step 7: Obtain the single-event correlation function by dividing by and the mixed-event correlation function by dividing by .
We first investigate the two-pion correlation functions for static granular droplet sources. The centers of the droplets are assumed to follow a Gaussian distribution with a standard deviation , and the density distribution of each droplet is assumed to be given by a Gaussian distribution with a standard deviation . In our numerical examples, and are taken as 5.0 and 1.5 fm, and the thermal emission temperature of the pions is taken to be MeV. Fig. 1 (a), (b), and (c) show the two-pion correlation functions for the granular sources with 4, 8, and 16, respectively. In each figure the dashed lines give the correlation function for a sample of different single events each of which has a correlated pion-pair distribution calculated with pion pairs within MeV, and the solid line is for the mixed-event obtained by averaging single events. One can see that there are fluctuations for the single-event correlation functions relative to the mixed-event correlation function, and the fluctuations increase as decreases.

III Distribution of the fluctuation of single-event two-pion correlation function
Form the results in Fig. 1, we observe that the correlation function for individual single events fluctuates with respect to the mixed-event correlation function . We can make the fluctuation quantitative and introduce the fluctuation as the difference between the single-event correlation function and the mixed-event correlation function. In order to take into account the error of the measurement, we weigh the fluctuation by the inverse of the corresponding error and define the fluctuation quantitatively as
| (6) |
where is the error in the measurement of given by
| (7) |

We calculate the distribution of the fluctuation for the sources with different numbers of droplets. In these calculations, we take the width of the relative momentum bin as 10 MeV and use the bins in the region MeV. Fig. 2 (a) and (b) show the distributions of for , obtained from 1000 single events each of which has the correlated pion-pair distribution calculated with and pion pairs within MeV. The standard deviations and for the granular sources are 5.0 and 1.5 fm. The results for a non-granular single source with a Gaussian density distribution with 5.0 fm standard deviation are also shown as a reference. It can be seen that the distributions for the granular sources are wider than that for the single source. The width of the distribution for the granular source decreases with .
From the distribution of , one can calculate the root-mean-square values of . Fig. 3 (a) and (b) show the root-mean-square as a function of for sources with 5.0 and 7.0 fm obtained for for the cases of and 1.5 fm, and , and 2.0, 1.5, and 1.0 fm. The double-dot-dashed lines are the root-mean-square for the distribution of the single Gaussian source in Fig. 2. It can be seen that is sensitive to and decreases as and increase. With the values of , one may distinguish the granular source with =16 from the single Gaussian source with pairs of identical pions, and one may even distinguish the granular sources up to with identical pions.

IV Distribution of the fluctuation for hydrodynamical QGP droplet source

We investigate next the distribution of for a granular sources of quark-gluon plasma droplets which evolve hydrodynamically. We assume that all of the droplets in the source have the same initial radius fm and evolve hydrodynamically in the same way. We use relativistic hydrodynamics with the equation of state of the entropy density Bla87 ; Lae96 to describe the evolution of the droplets Ris96 ; Ris98 ; Zha04 , and take the temperature width of the transition as and the initial conditions of the droplets as Ris96 ; Ris98 ; Zha04
| (9) |
| (12) |
where, , , and are the radial coordinate, energy density, and velocity of a fluid element in the droplet-rest frame, Ris96 ; Ris98 is the initial energy density of the droplets. The initial distribution of the droplet centers is taken to be a Gaussian distribution with the standard deviation fm. For the case with an additional collective radial expansion, the droplet centers are assumed to have a constant radial velocity in the center-of-mass frame of the granular source Zha04 . In order to reduce the influence of source lifetime on our observations for the granular structure Pra92 , we use the “side” component of the relative momentum of the two pions (perpendicular to the total momentum of the two pions) as the variable Pra90 ; Ber88 ; Wie99 ; Wei02 for the granular source of hydrodynamic evolution QGP droplets. Fig. 4 (a), (b), and (c) show the correlation function (with MeV) for the dynamical granular sources with and 4, 8, and 16, respectively. In each figure the dashed lines give the correlation function for a sample of different single events each of which has a correlated pion-pair distribution calculated with pion pairs within MeV, and the solid line is for the mixed-event obtained by averaging single events. The freeze-out temperature of the pions is taken to be MeV.
Fig. 5 (a) and (b) show the distributions of for the dynamic granular sources with and , and , , , and . The double-dot-dashed lines are for a dynamical single source with initial radius 5.0 fm as a reference. The number of pion pairs within MeV for one single event is and the number of events is for all the distributions. Because of the radial expansions of the droplets, the two pions emitted from the single-droplet source are boosted along the radial direction of the source and the two pions emitted from the granular source are boosted along random direction when . It leads to a smaller width of the distribution for the single-droplet source than those for the granular sources. When the widths of the distributions for the granular sources decrease because of the additional collective radial expansion .

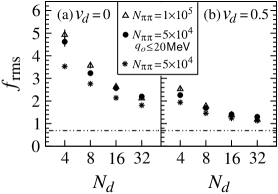
Fig. 6 (a) and (b) show the root-mean-square values of calculated from the distributions of one thousand single-events for the dynamical granular sources with 0 and 0.5, respectively. The symbols of are for the case of the number of the pion-pair within MeV for one single event is . The symbols of and are for the cases of the and with and without the constraint MeV. The double-dot-dashed lines are the result for the distribution of the single-droplet source in Fig. 5. One observes that for the granular sources are larger than that for the single-droplet source, and the root-mean-square for the granular sources increase with . Although the results with the constraint MeV are larger than those without the constraint, our simulations indicate that this constraint is very restrictive and only about 3.5 percent of the pion pairs within MeV satisfy it. As the droplet number decreases, the fluctuation increases. The effect of the increase becomes less pronounced as the collective expansion velocity increases.
V Conclusions and Discussions
Recent experiments at RHIC provide ample evidence for a dense matter produced in high-energy heavy ion collisions. Is the produced dense matter the quark-gluon plasma? If so, what is the order of its phase transition? As a granular structure of droplets occurs in a first-order QCD phase transition, the observation of the granular structure can be used as a signature for a first-order QCD phase transition Wit84 ; Sei89 ; Kaj91 ; Pra92 ; Cse92 ; Ven94 ; Zha95 ; Ala99 ; Zha00 ; Cse03 ; Ran04 ; Zha04 ; Ran04a .
We would like to develop tools to use HBT interferometry to examine the granular droplet structure of the dense matter if they are produced in high-energy heavy-ion collisions. We show previously that the single-event correlation function in HBT interferometry for granular droplets exhibits oscillations, depending on the relative coordinates of the droplet centers Won04 . In realistic experimental situations, the number of identical pion pairs in each single event is limited. We continue our investigation here to find out appropriate measurable quantities that could be used to detect granular structure in HBT measurements.
In our present investigation, we study the fluctuation between the single-event correlation function and the mixed-event correlation function and find that the distribution of the correlation function fluctuation between the single-event and the mixed-event correlation functions can be a measurable quantities that could be used to probe the granular droplet structure. The width of the distribution is greater for a granular source than that for a single source, and the width increases as the droplet number decreases. The effect of the increase becomes less pronounced when the droplets have a collective expansion. These changes of the widths can be quantified in terms of the root-mean-square fluctuation of . The for a granular droplet source increases with the number of identical pion pairs in an event. The detection of the granular droplets becomes more favorable as the number of identical pairs increases.
Our numerical simulated calculations indicate that the correlation function fluctuation leads to detectable differences if the droplet number is small (less than or equal to 16) and the number of identical pairs in each single event is of order or more. At RHIC energies, the multiplicity of identical pion of event is about a few hundreds, and the number of pion-pairs in an event is about . It will be of interest to see whether the correlation function fluctuation can indeed be measured at RHIC. The situation become even more favorable for LHC collisions at higher energies where there can be a greater number of identical pion pairs.
As with the development of many new experimental tools, progress is made by gradually increasing the complexity of one’s scopes of research and the areas of focus. In the present analysis, we have not considered the absorption and the multiple scattering of the pions Won02 ; Zha04a . Investigations on these effects of can be carried out in the future to see how they may modify the distribution of the fluctuations. We have also not considered the fluctuation of the overall size of emission source which clearly depends on the experimental selection and will require an investigation in conjunction with the experimental set-up and selections. An event multiplicity cut may be needed to reduce the fluctuation due to the sizes of the emitting source. Future investigations to refine the tool of HBT measurements for the detection of granular structure will be of great interest to probe the order of the quark-gluon plasma phase transition.
Acknowledgements.
This research was supported by the National Natural Science Foundation of China under Contract No.10275015 and by the Division of Nuclear Physics, US DOE, under Contract No. DE-AC05-00OR22725 managed by UT-Battle, LC.References
- (1) M. Gyulassy and L. McLerran, nucl-th/0405013.
- (2) See also New Discoveries at RHIC: the current case for the strongly interactive QGP, RIKEN Scientific Articles, Volume 9, BNL, May 14-15, 2004.
- (3) E. Witten, Phys. Rev. D 30, 272 (1984).
- (4) D. Seibert, Phys. Rev. Lett. 63, 136 (1989).
- (5) T. Kajino, Phys. Rev. Lett. 66, 125 (1991).
- (6) S. Pratt, P. J. Siemens, and A. P. Vischer, Phys. Rev. Lett. 68, 1109 (1992).
- (7) L. P. Csernai and J. I. Kapusta, Phys. Rev. D 46, 1379 (1992); L. P. Csernai and J. I. Kapusta, Phys. Rev. Lett. 69, 737 (1992).
- (8) R. Venugopalan and A. P. Vischer, Phys. Rev. E 49, 5849 (1994).
- (9) W. N. Zhang, Y. M. Liu, L. Huo, Y. Z. Jiang, D. Keane, and S. Y. Fung, Phys. Rev. C 51, 922 (1995).
- (10) S. Alamoudi , Phys. Rev. D 60, 125003 (1999).
- (11) W. N. Zhang, G. X. Tang, X. J. Chen, L. Huo, Y. M. Liu, and S. Zhang, Phys. Rev. C 62, 044903 (2000).
- (12) L. P. Csernai, J. I. Kapusta, and E. Osnes, Phys. Rev. D 67, 045003 (2003).
- (13) J. Randrup, Phys. Rev. Lett. 92, 122301 (2004).
- (14) W. N. Zhang, M. J. Efaaf, C. Y. Wong, Phys. Rev. C 70, 024903 (2004).
- (15) J. Randrup, nucl-th/0406031.
- (16) D. H. Rischke and M. Gyulassy, Nucl. Phys A 608, 479 (1996).
- (17) D. H. Rischke, nucl-th/9809044.
- (18) C. Y. Wong and W. N. Zhang, Phys. Rev. C 70, 064904 (2004).
- (19) STAR Collaboration, J. Adams et al., nucl-ex/0311017.
- (20) Chapter 17 of C. Y. Wong, Introduction to High-Energy Heavy-Ion Collisions, World Scientific, 1994.
- (21) J. P. Blaizot and J. Y. Ollitrault, Phys. Rev. D 36, 916 (1987).
- (22) E. Laermann, Nucl. Phys. A 610, 1 (1996).
- (23) S. Pratt, Phys. Rev. Lett. 53, 1219 (1984); S. Pratt, Phys. Rev. D 33, 72 (1986); S. Pratt, T. Csörgo, and J. Zimányi, Phys. Rev. C 42, 2646 (1990).
- (24) G. Bertsch, M. Gong, and M. Tohyama, Phys. Rev. C 37, 1896 (1988); G. Bertsch, Nucl. Phys. A 498, 173c (1989).
- (25) U. A. Wiedemann and U. Heinz, Phys. Rept. 319, 145 (1999).
- (26) R. M. Weiner, Phys. Rept. 327, 249 (2002).
- (27) C. Y. Wong, J. Phys. G29, 2151 (2003); C. Y. Wong, J. Phys. G30, S1053 (2004).
- (28) W. N. Zhang, M. J. Efaaf, C. Y. Wong, M. Khaliliasr, Chin. Phys. Lett. 21, 1918 (2004), nucl-th/0404047.