Simple function forms and nucleon-nucleus total cross sections
Abstract
Total cross sections for neutron scattering with energies between 10 and 600 MeV and from nine nuclei spanning the mass range from 6Li to 238U have been analyzed using a simple function of three parameters. The values of those parameters with which neutron total cross-section data are replicated vary smoothly with energy and target mass and may themselves be represented by functions of energy and mass.
pacs:
25.40.-h,24.10.Ht,21.60.CsI Introduction
Total cross sections from the scattering of neutrons by nuclei are required in a number of fields of study which range over problems in basic science as well as many of applied nature. It would be utilitarian if such scattering data were well approximated by a simple convenient function form with which predictions could be made for cases of energies and/or masses as yet to be measured. Recently it has been shown Amos and Deb (2002); Deb and Amos (2003) that such forms may exist for proton total reaction cross sections. Herein we consider that concept further to reproduce the measured total cross sections from neutron scattering for energies to 600 MeV and from nine nuclei ranging in mass between 6Li and 238U. These suffice to show that such forms will also be applicable in dealing with other stable nuclei since their neutron total cross sections vary so similarly with energy Koning and Delaroche (2003).
Total scattering cross sections for neutrons from nuclei have been well reproduced by using optical potentials. In particular, the data (to 300 MeV) from the same nine nuclei we consider, compare quite well with predictions made using a -folding method to form nonlocal optical potentials Amos et al. (2002), though there are some notable discrepancies. Alternatively, in a recent study Koning and Delaroche Koning and Delaroche (2003) gave a detailed specification of phenomenological global optical model potentials determined by fits to quite a vast amount of data, and in particular to the neutron total scattering cross sections we consider herein. However, as we show in the case of the total cross sections from 10 to 600 MeV, there is a simple function form one can use to allow estimates to be made quickly without recourse to optical potential calculations. Furthermore we shall show that the required values of the three parameters of that function form themselves trend sufficiently smoothly with energy and mass suggesting that they too may be represented by functional forms.
II Formalism
The total cross sections for neutron scattering from nuclei can be expressed in terms of partial wave scattering () matrices specified at energies , by
| (1) |
where are the (complex) scattering phase shifts and are the moduli of the matrices. The superscript designates . In terms of these quantities, the elastic, reaction (absorption), and total cross sections respectively are given by
| (2) | |||||
| (3) |
and
| (4) |
Therein the are defined as partial cross sections of the total elastic, total reaction, and total scattering itself. For proton scattering, because Coulomb amplitudes diverge at zero degree scattering, only total reaction cross sections are measured. Nonetheless study of such data Amos and Deb (2002); Deb and Amos (2003) established that partial total reaction cross sections may be described by the simple function form
| (5) |
with the tabulated values of , , and all varying smoothly with energy and mass. Those studies were initiated with the partial reaction cross sections determined by using complex, non-local, energy-dependent, optical potentials generated from a -folding formalism Amos et al. (2000). While those -folding calculations did not always give excellent reproduction of the measured data (from 20 to 300 MeV for which one may assume that the method of analysis is credible), they did show a pattern for the partial reaction cross sections that suggest the simple function form given in Eq. (5). With that form excellent reproduction of the proton total reaction cross sections for many targets and over a wide range of energies were found with parameter values that varied smoothly with energy and mass.
Herein we establish that the partial total cross sections for scattering of neutrons from nuclei can also be so expressed and we suggest forms, at least first average result forms, for the characteristic energy and mass variations of the three parameters involved. Nine nuclei, 6Li, 12C, 19F, 40Ca, 89Y, 184W, 197Au, 208Pb and 238U, for which a large set of experimental data exist, are considered. Also those nuclei span essentially the whole range of target mass. However, to set up an appropriate simple function form, initial partial total cross sections must be defined by some method that is physically reasonable. Thereafter the measured total cross-section values themselves can be used to tune details, and of the parameter in particular. We chose to use results from -folding optical potential calculations to give those starting values.
III Results and discussions
That a function form for total cross sections is feasible has been suggested previously in dealing with energies to 300 MeV from a few nuclei Amos et al. (2002) and by using a -folding prescription for the nucleon-nucleus optical potentials. At the same time, studies of the partial reaction total cross sections for proton scattering Amos and Deb (2002); Deb and Amos (2003) found that a form as given in Eq. (5) was most suitable. A similar form can be used to map the partial total cross sections given by the -folding potential calculations and thence by suitable adjustments for their sums to give the measured total cross sections. Of note is that, with increasing energy, the form of the simple function (Eq. (5)) can be approximated by a sharp fall at giving a triangle in angular momentum space. In that case, the total reaction cross section equates to the area of that triangle and
| (6) |
Then with at high energies, the geometric cross section as required. Furthermore, for high enough energies then, the total cross section is double that value. This is an asymptotic behavior one can assume for the values to be used with the total cross sections.
The function form results we display in the following set of figures were obtained by starting with -folding model results at energies of 10 to 100 MeV in steps of 10 MeV, then to 350 MeV in steps of 25 MeV, and thereafter in steps of 50 MeV to 600 MeV. The -matrices used above pion threshold were those obtained from an optical potential correction to the BonnB force von Geramb et al. (1998) which, while approximating the effects of resonance terms such as virtual excitation of the , may still be somewhat inadequate for use in nucleon-nucleus scattering above 300 MeV. Also relativistic effects in scattering, other than simply the use of relativistic kinematics in the distorted wave approximation (DWA) approach, are to be expected. Nonetheless the DWA results are used only to find a sensible starting set of the function form parameters , and from which to find ones that reproduce the measured total cross-section data. One must also note that the -folding potentials for most of the nuclei considered were formed using extremely simple model prescriptions of their ground states. A previous study Amos et al. (2002) revealed that with good spectroscopy the -folding approach gives much better results in comparison with data than that approach did when simple packed shell prescriptions for the structure of targets were used. That was also the case when scattering from exotic, so-called nucleon halo, nuclei were studied Amos et al. (2000); Lagoyannis et al. (2001).
The results from analyses of MeV scattering of 6He ion from hydrogen targets Lagoyannis et al. (2001) lead to a note of caution for the use of the trends we set out here. Our results are for a range of energies and for a diverse set of stable nuclear targets. Total cross sections with unstable halo nuclei may be considerably larger than one expects if they were assumed adequately described by standard shell model wave functions. Indeed at MeV the total reaction cross section for 6He-hydrogen scattering was 16-17% larger than found using the standard shell model prescription. That and the momentum transfer properties of the 6He-p differential cross section were convincing evidence of the neutron-halo nature of 6He. We proceed then with the caveat that specific structure properties may be needed as variation to the functional forms we deduce. But, given the results found with the diverse (nine) nuclei considered, we believe that such would need be very significant structure aspects, such as a halo, to be of import.
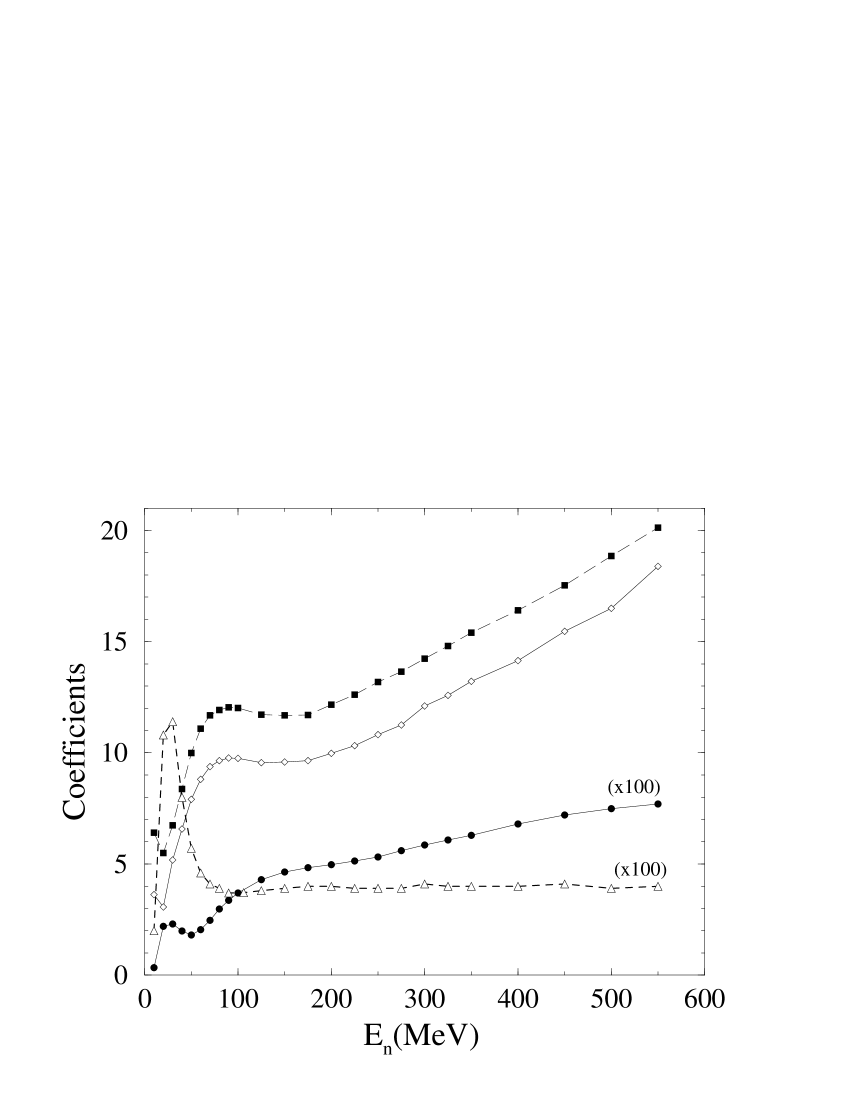
While we have used the partial total cross sections from DWA results for neutron scattering from all the nine nuclei chosen and at all of the energies indicated, only those obtained for 208Pb are shown in Fig. 1. The results from calculations of scattering from the other eight nuclei have similar form. The ‘data’ shown as diverse open and closed symbols in Fig. 1 are the specific values found from the -folding optical model calculations. Each curve shown therein is the result of a search for the best fit values of the three parameters, , , and that map Eq. (5) (now for total neutron cross sections) to these ‘data’.
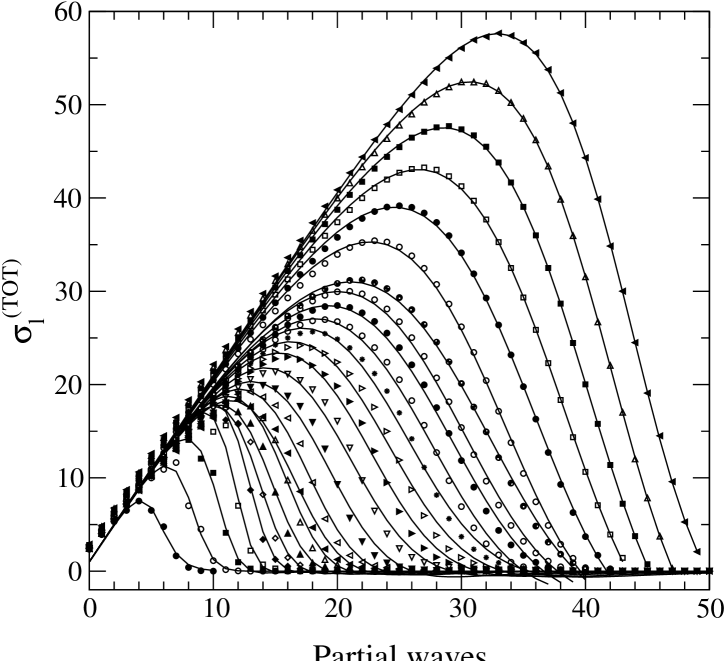
From the sets of values that result from that fitting process, the two parameters and can themselves be expressed by the parabolic functions
| (7) |
where the target energy E is in MeV. There was no conclusive evidence for a mass variation of them. With and so fixed, we then adjusted the values of in each case so that actual measured neutron total cross-section data were fit using Eq. (5). Numerical values for from that process are presented in Table 1.
| E (MeV) | 6Li | 12C | 19F | 40Ca | 89Y | 184W | 197Au | 208Pb | 238U |
|---|---|---|---|---|---|---|---|---|---|
| 10 | 3.330 | 3.650 | 3.838 | 4.925 | 6.297 | 6.916 | 6.883 | 6.892 | 7.397 |
| 20 | 4.016 | 4.974 | 5.573 | 6.088 | 7.657 | 9.838 | 10.059 | 10.169 | 10.508 |
| 30 | 4.292 | 5.589 | 6.677 | 7.675 | 8.671 | 11.013 | 11.337 | 11.578 | 12.241 |
| 40 | 4.432 | 6.039 | 7.329 | 8.898 | 10.141 | 11.993 | 12.212 | 12.393 | 13.184 |
| 50 | 4.447 | 6.200 | 7.672 | 9.822 | 11.602 | 13.418 | 13.526 | 13.635 | 14.392 |
| 60 | 4.435 | 6.296 | 7.873 | 10.331 | 12.791 | 15.001 | 15.143 | 15.181 | 15.950 |
| 70 | 4.404 | 6.348 | 7.979 | 10.718 | 13.629 | 16.439 | 16.632 | 16.634 | 17.506 |
| 80 | 4.353 | 6.305 | 8.000 | 10.922 | 14.221 | 17.591 | 17.857 | 17.996 | 18.884 |
| 90 | 4.324 | 6.255 | 8.003 | 11.036 | 14.631 | 18.438 | 18.808 | 18.982 | 19.940 |
| 100 | 4.292 | 6.259 | 8.040 | 11.071 | 14.891 | 19.058 | 19.459 | 19.541 | 20.726 |
| 125 | 4.261 | 6.284 | 8.067 | 11.241 | 15.190 | 19.924 | 20.427 | 20.596 | 21.900 |
| 150 | 4.303 | 6.315 | 8.189 | 11.404 | 15.461 | 20.432 | 20.960 | 21.167 | 22.584 |
| 175 | 4.387 | 6.436 | 8.362 | 11.597 | 15.771 | 20.871 | 21.441 | 21.843 | 23.129 |
| 200 | 4.515 | 6.686 | 8.610 | 11.981 | 16.256 | 21.567 | 22.125 | 22.304 | 23.870 |
| 225 | 4.648 | 6.847 | 8.921 | 12.307 | 16.850 | 22.313 | 22.910 | 23.112 | 24.735 |
| 250 | 4.767 | 7.113 | 9.226 | 12.756 | 17.543 | 23.255 | 23.866 | 23.981 | 25.745 |
| 275 | 4.883 | 7.369 | 9.593 | 13.196 | 18.250 | 24.226 | 24.866 | 25.076 | 26.814 |
| 300 | 4.974 | 7.621 | 9.967 | 14.008 | 19.071 | 25.249 | 25.894 | 26.297 | 27.961 |
| 325 | 5.143 | 7.850 | 10.312 | 14.501 | 19.794 | 26.262 | 26.962 | 27.221 | 29.069 |
| 350 | 5.265 | 8.131 | 10.658 | 15.069 | 20.569 | 27.277 | 27.966 | 28.236 | 30.180 |
| 400 | 5.456 | 8.677 | 11.399 | 15.915 | 22.015 | 29.255 | 30.007 | 30.319 | 32.327 |
| 450 | 5.656 | 9.159 | 12.102 | 17.091 | 23.482 | 31.173 | 31.946 | 32.202 | 34.398 |
| 500 | 5.966 | 9.674 | 12.751 | 17.953 | 25.011 | 32.971 | 33.887 | 33.978 | 36.510 |
| 550 | 6.069 | 9.559 | 13.146 | 19.341 | 26.362 | 34.624 | 35.574 | 35.749 | 38.425 |
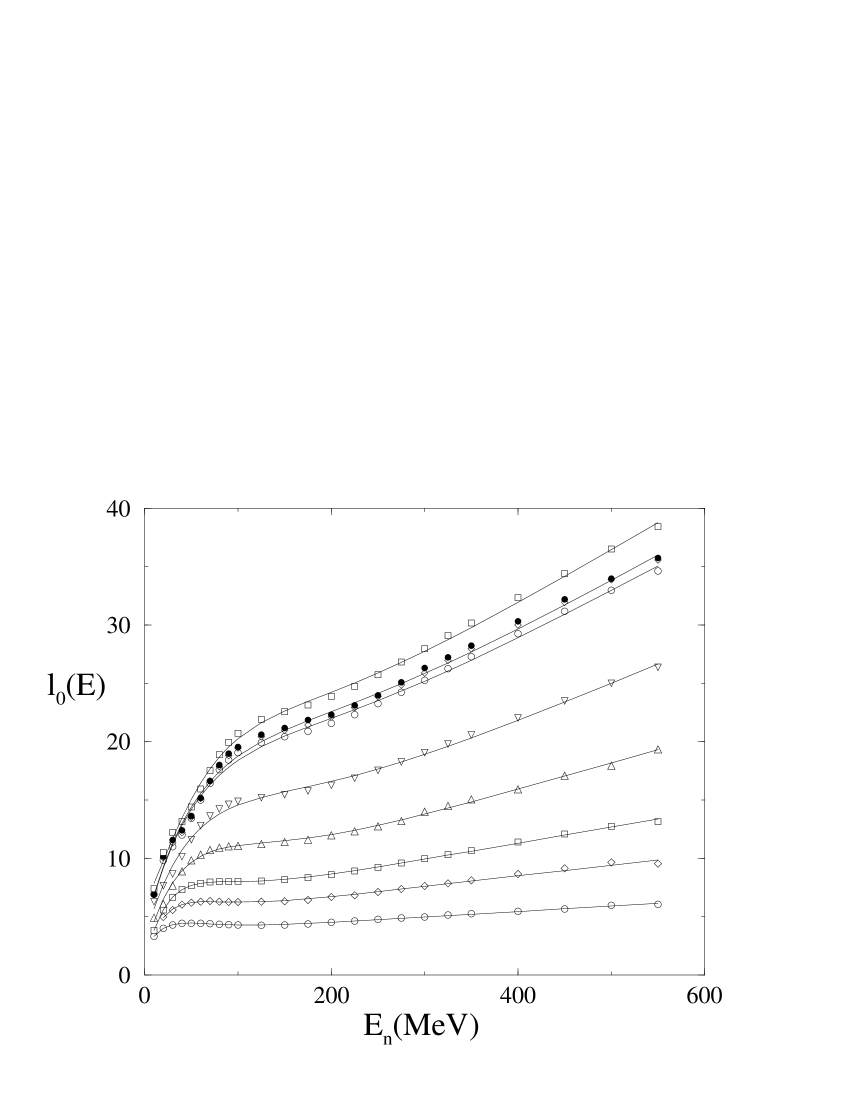
The values of increase monotonically with both mass and energy and that is most evident in Fig. 2 where the optimal values are presented as diverse filled or open symbols. The set for each of the masses (from 6 to 238) are given by those that increase in value respectively at 600 MeV. While that is obvious for most cases, note that there is some degree of overlap in the values for 197Au (opaque diamonds) and for 208Pb (filled circles). The curves are the shapes deduced by a function of energy for the that will be discussed subsequently.
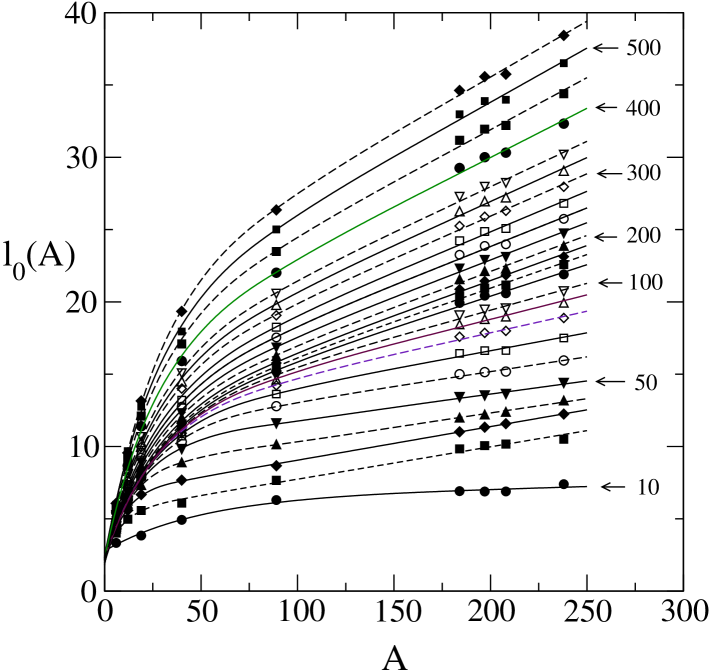
Plotting the values of against mass also reveals smooth trends as is evident in Fig. 3. Some actual energies are indicated by the numbers shown in this diagram. Again the curves shown in the figure are the results found on taking a functional form for at each energy, and that too will be discussed later.
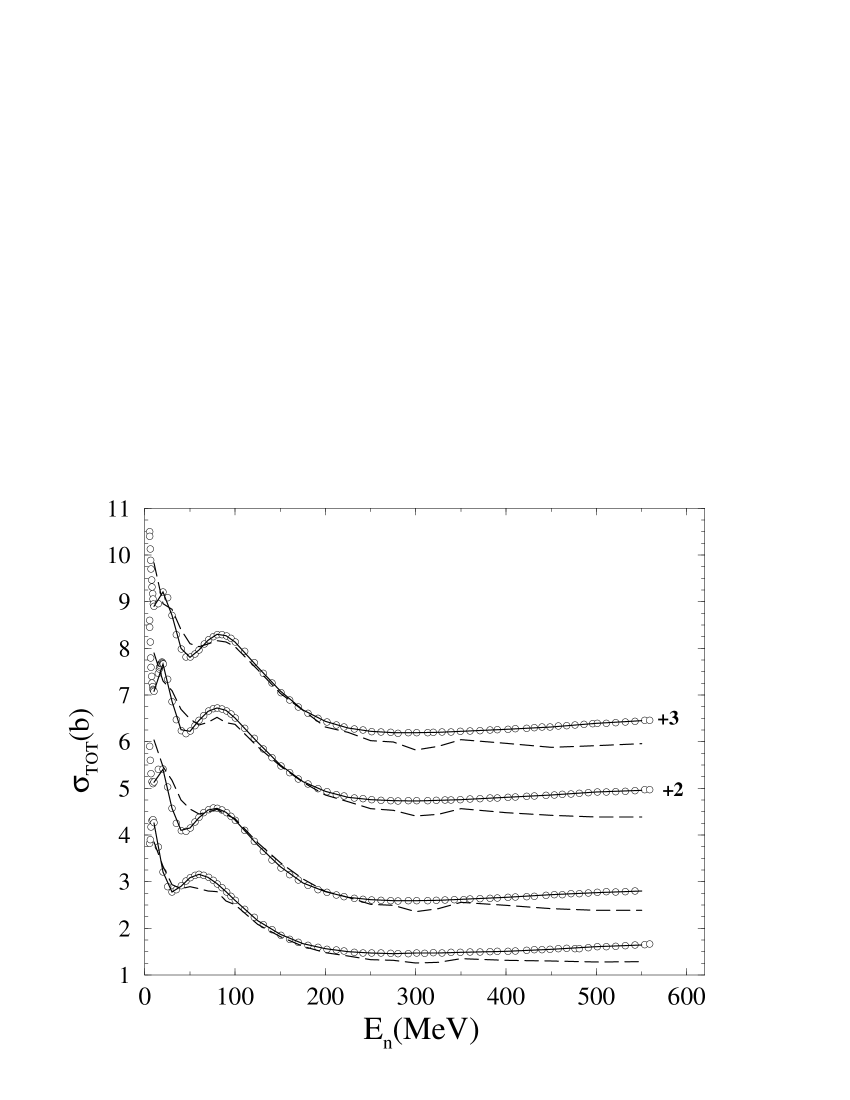
The total neutron scattering cross sections generated using the function form for partial total cross sections with the tabled values of and the energy function forms of Eq. (7) for and , are shown in Figs. 4, 5, and 6. They are displayed by the continuous lines that closely match the data which are portrayed by opaque circles. The data that was taken from a survey by Abfalterer et al. Abfalterer et al. (2001) which includes data measured at LANSCE that are supplementary and additional to those published earlier by Finlay et al. Finlay et al. (1993). For comparison we show results obtained from calculations made using -folding optical potentials Amos et al. (2002). Dashed lines represent the predictions obtained from those microscopic optical potential calculations. Clearly for energies 300 MeV and higher, those predictions fail.
The total cross sections for neutrons scattered from the four lightest nuclei considered are compared with data in Fig. 4.
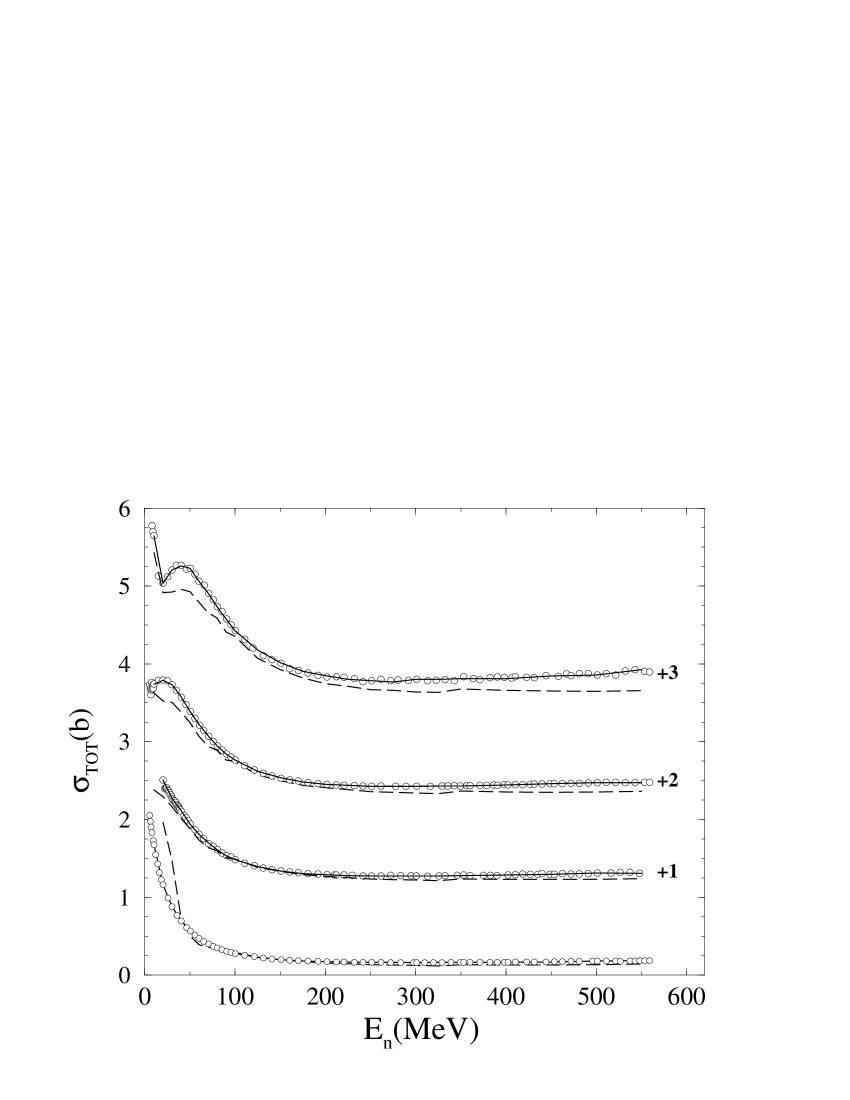
Therein from bottom to top are shown the results for 6Li, 12C, 19F, and 40Ca with shifts of 1, 2 and 3 b made for the latter three cases respectively to facilitate inspection of the four sets. A slightly different scaling is used in Fig. 5 in which the total neutron scattering cross sections from the nuclei 89Y (unscaled), 184W (unscaled), 197Au (shifted by 2 b), and 238U (shifted by 3 b) are compared with the base -folding optical potential results and with the function forms with the optimal parameters. Again the -folding potential results are displayed by the dashed curves while those of the function form are shown by the solid curves.
Finally we show in Fig. 6, the results for neutron scattering from 208Pb. In this case we used Skyrme-Hartree-Fock model (SKM*) densities Brown (2000) to form the -folding optical potentials. That structure when used to analyze proton and neutron scattering differential cross sections at 65 and 200 MeV gave quite excellent results Karataglidis et al. (2002). Indeed those analyzes were able to show selectivity for that SKM* model of structure and for the neutron skin thickness of 0.17 fm that it proposed.
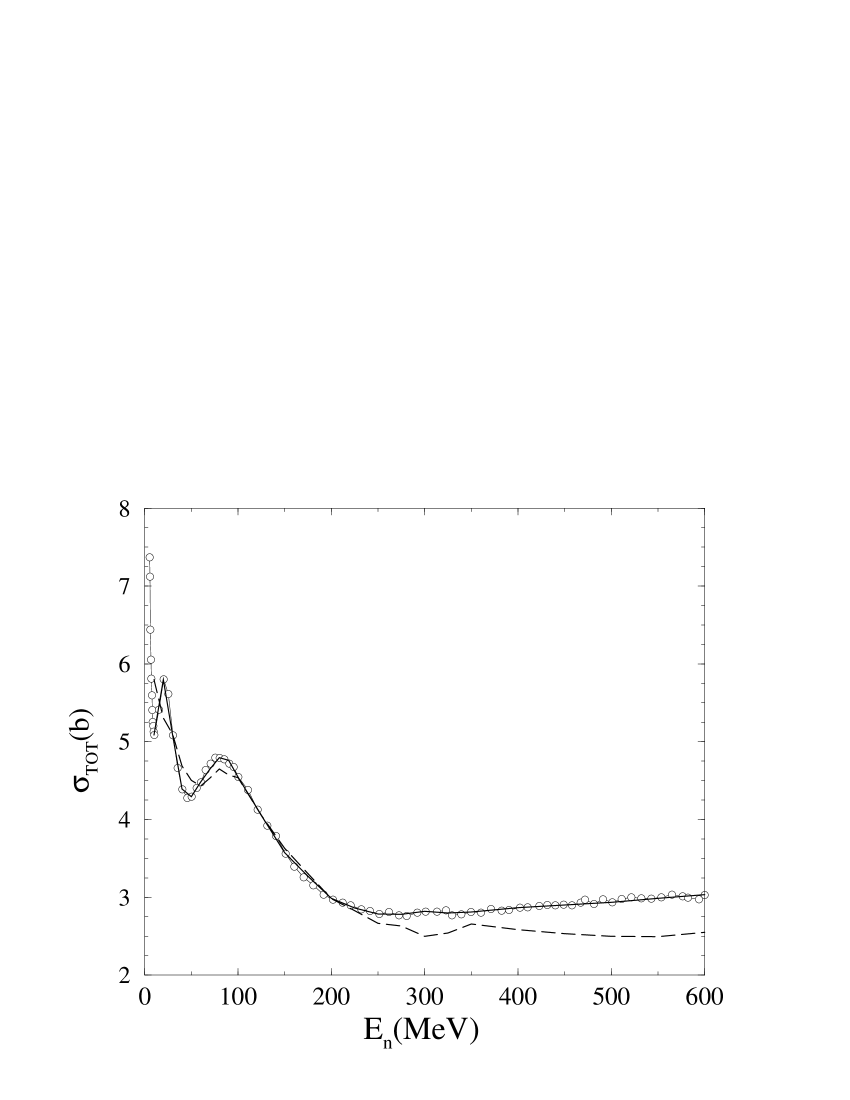
Using the SKM* model structure, the -folding optical potentials gave the total cross sections shown by the dashed curve in Fig. 6. Of all the results, we believe these for 208Pb point most strongly to a need to improve on the -folding prescription as is used currently when energies are at and above pion threshold. Nonetheless, it does do quite well for lower energies, most notably giving a reasonable account of the Ramsauer resonances Koning and Delaroche (2003) below 100 MeV. However, as with the other results, these -folding values serve only to define a set of partial cross sections from which an initial guess at the parameter values of the function form is specified. With adjustment that form produces the solid curve shown in Fig. 6 which is an excellent reproduction of the data, as it was designed to do. But the key feature is that the optimal fit parameter values still vary smoothly with mass and energy.
Without seeking further functional properties of the parameters, one could proceed as we have done this far but by using many more cases of target mass and scattering energies so that a parameter tabulation as a data base may be formed with which any required value of total scattering cross section might be reasonably predicted (i.e. to within a few percent) by suitable interpolation on the data base, and the result used in Eq. (5).
III.1 The parameters as functions of energy
As noted previously, the two parameters and can be chosen to have the parabolic forms in energy as given by Eq. (7). Once they are set the required values of vary smoothly and monotonically with both and in giving the partial cross-section sums that perfectly match measured values of the total cross sections.
For energies above 250 MeV, the values approximate well as straight lines and a likely representation of all of the sets of values is found with the energy dependent function,
| (8) |
The values of the parameters that lead to the curves depicted in Fig. 2 are listed in Table 2. Note that a result for 208Pb is not shown in Fig. 2 to avoid confusion with that for 197Au which is. The result for 208Pb nonetheless is as good a fit as found in the other eight cases.
| A | E0 | ||||||
|---|---|---|---|---|---|---|---|
| 6Li | 4.665 | 3.582 | 1.537 | 13.87 | 3.670 | 0.025 | |
| 12C | 9.103 | 4.865 | 3.449 | 21.35 | 3.285 | 0.30 | |
| 19F | 1.374 | 5.808 | 4.794 | 24.42 | 2.880 | 0.89 | |
| 40Ca | 2.272 | 6.820 | 4.896 | 25.97 | 1.937 | 0.73 | |
| 89Y | 3.31 | 8.357 | 5.256 | 29.47 | 1.470 | 2.59 | 2.0 |
| 184W | 4.27 | 11.50 | 7.574 | 43.73 | 1.310 | 4.2 | 3.0 |
| 197Au | 4.41 | 11.65 | 7.635 | 43.96 | 1.277 | 4.5 | 3.2 |
| 208Pb | 4.067 | 13.43 | 9.402 | 62.51 | 1.400 | 5.0 | 3.3 |
| 238U | 4.75 | 12.56 | 8.081 | 46.51 | 1.235 | 4.1 | 2.9 |
In Table 2, the last two columns give values of which in this case are defined by
| (9) |
with the sum extending over the 24 energies used. For the heavier masses the values of that result when the sums are restricted to energies below 100 MeV (10 points) are given in the last column. They reveal that the mismatch occurs at those low energies particularly. Note however, the function for the parameter variation was chosen solely by inspection. No particular physical constraint was sought and so alternate function forms are not excluded. This is one reason why we have not proceeded further and sought a mass dependence in the coefficients themselves.
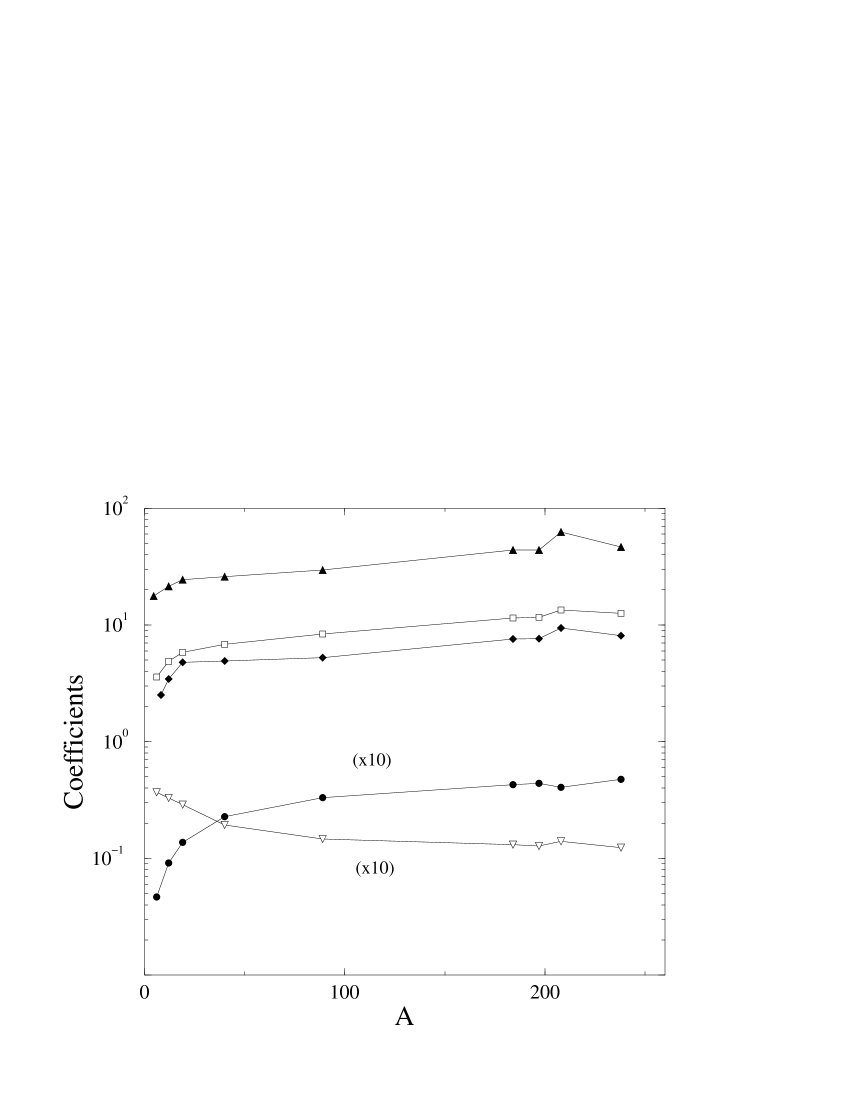
Of the parameter values for the , those for 208Pb differ most from smooth progressions in mass as is evident in Fig. 7. Therein the values of the parameters defining are plotted with the connecting lines simply to guide the eye. The values for (filled circles) and of (open down triangles) have been multiplied by 10 for convenience of plotting. The other parameter values are identified as (open squares), (filled diamonds), and (filled triangles). Clearly there is a smooth mass trend of these values with the exception of the entries for 208Pb. But the 208Pb values are based only on achieving the smallest value as defined by Eq. (9). Using parameter values consistent with the smooth mass trend, the for the fit to the 208Pb values doubles at most.
But use of the function form of Eq. (8) for , along with those of Eq. (7) for and , with Eq. (5), as yet do not replicate the measured total cross sections well enough at all energies; another reason why we do not as yet seek mass dependent forms for the coefficients in Eq. (8). We consider that an appropriate criterion is that the measured cross sections should be replicated to within 5%. The percentage differences in cross sections for each nucleus considered are displayed in the top two segments of Fig. 8. In the top segment, those differences for 40Ca and heavier nuclei are shown. Curiously these variations look sinusoidal with argument proportional to . In the middle segment the differences for the three light mass nuclei are given with the solid, dashed and long-dashed curves depicting the values for 6Li, 12C, and 19F respectively. Clearly the reasonable fit criterion has been met for the light masses for all energies. That is so also for the heavier nuclei but only for energies above 100 MeV. There is too large a mismatch for the heavy nuclei at lower energies however. This mismatch reflects the differences between the actual best fit values of and those defined by the function form Eq. (8), and which differences for just the heavy nuclei are shown in the bottom segment of Fig. 8.
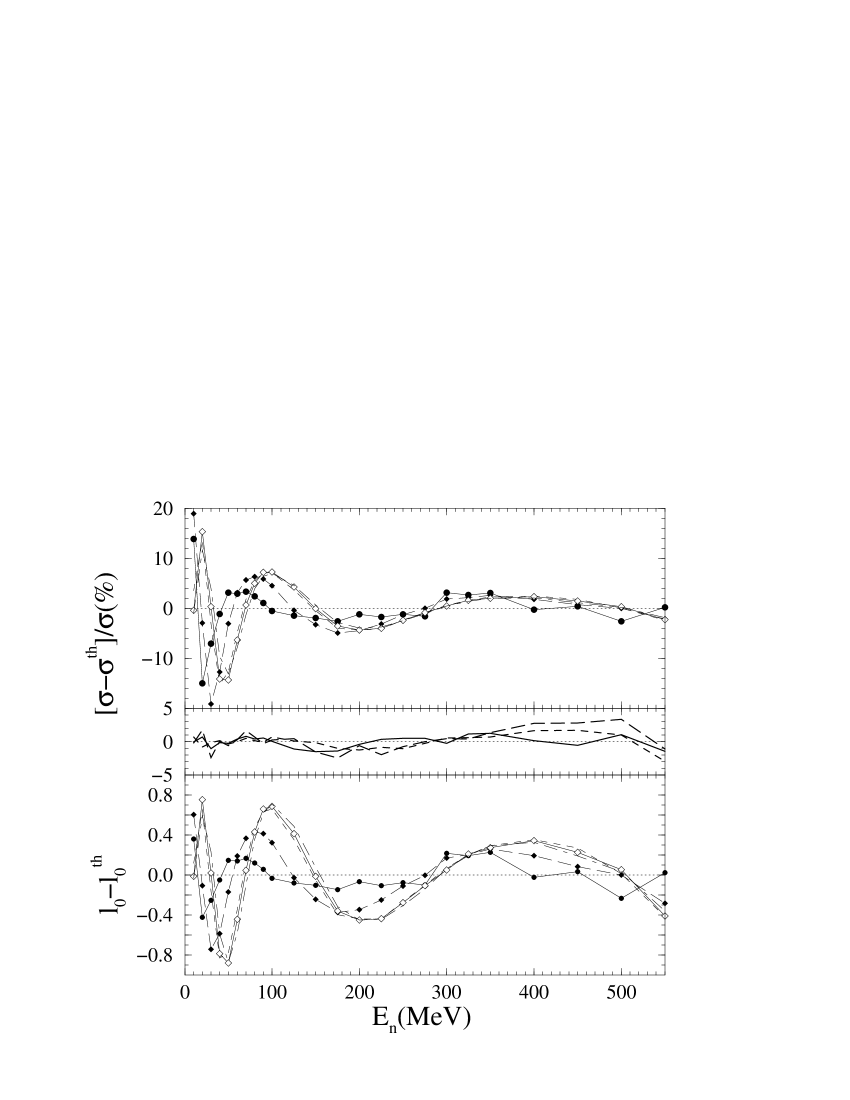
Only the values for 40Ca and heavier nuclei are shown as the differences for the light mass nuclei are very small for all energies, being less than and usually less than . The results for each nucleus, 40Ca, 89Y, 184W, 197Au, and 238U are shown in the bottom segment respectively by the solid curve connecting filled circles the long-dashed curve connecting filled diamonds, the dashed curve, the solid curve connecting opaque diamonds, and the dot-dashed curve. Of particular note is that the differences between these fit and function values of the mirror those of the total cross section differences shown in the top segment, both in energy and with different mass. It is most likely then that the function form Eq. (8) is a first order guess and may be improved to meet the reasonable fit criterion we have set. That is the subject of ongoing study in which many more targets and more numerous values of energy in the region to 100 MeV are to be used.
III.2 The parameter as a function of mass
As noted above, the parameter values vary smoothly with mass. In fact we find that a good representation of those values is given by
| (10) |
With this mass variation form, the coefficients are as set out in Table 3.
| Energy | ||||
|---|---|---|---|---|
| 10 | 0.0034 | 6.4 | 3.62 | 0.020 |
| 20 | 0.0224 | 5.51 | 3.06 | 0.108 |
| 30 | 0.023 | 6.74 | 5.18 | 0.114 |
| 40 | 0.0198 | 8.37 | 6.57 | 0.080 |
| 50 | 0.018 | 9.99 | 7.91 | 0.057 |
| 60 | 0.0205 | 11.08 | 8.81 | 0.046 |
| 70 | 0.0247 | 11.68 | 9.38 | 0.041 |
| 80 | 0.0297 | 11.92 | 9.64 | 0.039 |
| 90 | 0.0337 | 12.05 | 9.77 | 0.037 |
| 100 | 0.037 | 12.02 | 9.75 | 0.037 |
| 125 | 0.043 | 11.71 | 9.56 | 0.038 |
| 150 | 0.0464 | 11.68 | 9.58 | 0.039 |
| 175 | 0.0484 | 11.70 | 9.64 | 0.040 |
| 200 | 0.0497 | 12.17 | 9.97 | 0.04 |
| 225 | 0.0514 | 12.62 | 10.32 | 0.039 |
| 250 | 0.0532 | 13.19 | 10.82 | 0.039 |
| 275 | 0.056 | 13.65 | 11.25 | 0.039 |
| 300 | 0.0585 | 14.23 | 12.11 | 0.041 |
| 325 | 0.0607 | 14.81 | 12.59 | 0.040 |
| 350 | 0.0628 | 15.41 | 13.22 | 0.040 |
| 400 | 0.068 | 16.40 | 14.14 | 0.040 |
| 450 | 0.072 | 17.53 | 15.47 | 0.041 |
| 500 | 0.0748 | 18.85 | 16.50 | 0.039 |
| 550 | 0.077 | 20.13 | 18.39 | 0.040 |
That mass equation with those tabled values of the coefficients gave the nine values of for each energy that are connected by a spline curve in Fig. 3. The optimal values for these parameters (listed) are shown by the diverse set of open and closed symbols. The coefficients defining are portrayed by the various symbols in Fig. 9. Specifically the coefficients are shown by the filled circles (), by the filled squares connected by the long-dashed lines (), by the opaque diamonds (), and by the opaque up-triangles connected by dashed lines (). Again for clarity the actual values found for and have been multiplied by a scaling factor. This time that factor is 100. These mass formula coefficients vary smoothly with energy and one might look for a convenient function of energy to describe them as well. However, as we noted earlier with the energy function representation, the choice of this mass equation resulted solely from inspection of the diagram and so alternate formulas are not excluded. Therefore it was not sensible to seek a function form for the coefficients themselves. In any event, one needs results from a much larger range of nuclei to study further such mass variations.
IV Conclusions
We have found that a simple function of 3 parameters suffice to fit observed neutron total scattering cross sections from diverse nuclei, 6Li to 238U, and for energies ranging from 10 to 600 MeV. That function was predicated upon the values of partial total cross sections evaluated using a -folding optical potential for scattering. The patterns of the calculated partial cross sections suggested that two of the parameters, and , could be set by parabolic functions of energy for all masses. Then allowing the third parameter to vary, values could be found with which the appropriate sum over partial cross sections given by the function form exactly match measured data. The optimal values of varied smoothly with both energy and target mass. The energy variations could be characterized by yet another simple function form as could the mass variations . However, the reasonable fit criterion that final results remain within 5% of observation showed that refinement of the functional dependencies of the parameter in particular awaits results of a far more complete study involving as many target masses as possible and for many more energies, particularly below 100 MeV where the total cross-section data show large scale oscillatory structure.
Nonetheless on the basis of the limited set of nuclei and energies considered, there is a three parameter function form for partial total cross sections that will give neutron total cross sections as required in any application without recourse to phenomenological optical potential parameter searches. One may use tabulations of and interpolations on that table, or indeed a better data base formed by considering many more energies and many more nuclear targets, to get cross sections satisfying the reasonable fit criterion. A caveat being that any special gross nuclear structure effect, such as a halo matter distribution for example, must be separately considered.
Acknowledgements.
We are grateful to Dr. Steven Karataglidis for many useful discussions had, as well as critical comments made, during the preparation of this manuscript. This research was supported by a research grant from the Australian Research Council and also by the National Science Foundation under Grant No. 0098645.References
- Amos and Deb (2002) K. Amos and P. K. Deb, Phys. Rev. C 66, 024604 (2002).
- Deb and Amos (2003) P. K. Deb and K. Amos, Phys. Rev. C 67, 039306 (2003).
- Koning and Delaroche (2003) A. J. Koning and J. P. Delaroche, Nucl. Phys. A 713, 231 (2003).
- Amos et al. (2002) K. Amos, S. Karataglidis, and P. K. Deb, Phys. Rev. C 65, 064618 (2002).
- Amos et al. (2000) K. Amos, P. J. Dortmans, H. V. von Geramb, S. Karataglidis, and J. Raynal, Adv. in Nucl. Phys. 25, 275 (2000).
- von Geramb et al. (1998) H. von Geramb, K. Amos, H. Labes, and M. Sander, Phys. Rev. C 58, 2249 (1998).
- Lagoyannis et al. (2001) A. Lagoyannis et al., Phys. Lett. B518, 27 (2001).
- Abfalterer et al. (2001) W. P. Abfalterer, F. B. Bateman, F. S. Dietrich, R. W. Finlay, R. C. Haight, and G. L. Morgan, Phys. Rev. C 63, 044608 (2001).
- Finlay et al. (1993) R. W. Finlay, W. P. Abfalterer, G. Fink, E. Montei, T. Adami, P. W. Lisowski, G. L. Morgan, and R. C. Haight, Phys. Rev. C 47, 237 (1993).
- Brown (2000) B. A. Brown, Phys. Rev. Lett. 85, 5296 (2000).
- Karataglidis et al. (2002) S. Karataglidis, K. Amos, B. A. Brown, and P. K. Deb, Phys. Rev. C 65, 044306 (2002).