Quantum chaos and nuclear mass systematics
Abstract
The presence of quantum chaos in nuclear mass systematics is analyzed by considering the differences between measured and calculated nuclear masses as a time series described by the power law . While for the liquid droplet model plus shell corrections a quantum chaotic behavior is found, errors in the microscopic mass formula have , closer to white noise. The chaotic behavior seems to arise from many body effects not included in the mass formula.
pacs:
21.10.Dr, 05.40.-a, 24.60.Lz, 05.45.TpThe importance of an accurate knowledge of nuclear masses to understand diverse processes in nuclear physics and astrophysics is well known Rol88 . Though tremendous progress has been made in the challenging task of measuring the mass of exotic nuclei, theory is necessary to predict the mass of nuclei very far from stability Lunn03 . Understanding of the properties of complex nuclei in terms of the actual forces between nucleons is a basic question which at present nuclear is unable to answer Lunn03 . For this reason nuclear masses are predicted using phenomenological models. The finite range droplet model (FRDM), which combines a macroscopic droplet with microscopic shell and pairing corrections Moll95 , has become the de facto standard for mass formulas. A microscopically inspired model was successfully introduced by Duflo and Zuker (DZ)Duf94 . Along the mean field model it is worth to mention the powerful Skyrme-Hartree-Fock (HFB) approach Gor01 . All these mass formulas can calculate and predict the masses (and often other properties) of as many as 8979 nuclides Lunn03 . There is a permanent search for better theoretical models that reduce the difference with the experimental masses and produce reliable predictions for unstable nuclei. At present, the rms error for 2135 nuclei is 674 keV for HFB, 676 keV for FRDM, and 373 keV for DZ. The origin of the differences in rms errors between the models and the possibility of reducing them are the subject of the present investigation.
Recently, the problem of the mass deviations was analyzed from a new angle: in Ref. Boh02 the errors among experimental and calculated masses in Moll95 were interpreted in terms of two types of contributions. The first one was associated with a regular part, related to the underlying collective dynamics (droplet model), plus the shell energy correction, while the other was assumed to arise from some inherent dynamics, possibly higher order interactions among nucleons Boh02 , that lead to chaotic behavior. According to Abe02 the latter could be interpreted as remaining signals of the chaotic dynamics occurring at higher energies, whose magnitude suggests that we have already achieved (within a factor of 2) the maximum accessible precision in the calculation of the masses in mean-field theories Boh02 . It is relevant to ask if this chaotic limit can be confirmed by independent techniques and, if so, if this lower bound is valid also for mass calculations which explicitly include residual correlations, like DZ.
The presence of chaotic motion in nuclear systems has been firmly related with the statistics of high-lying energy levels Wig65 ; Meh90 . Poisson distributions of normalized spacings of successive nuclear or atomic excited levels with the same spin and parity correspond to integrable classical dynamics, while Wigner’s statistics signal chaotic motion in the corresponding classical regime Boh85 . Intermediate situations are more difficult to assess. Very recently a proposal has been made to treat the spectral fluctuations as discrete time series Rel02 . Defining
| (1) |
with the mean level density which allows the mapping to dimensionless levels with unitary average level density, and analyzing the energy fluctuations as a discrete time series, they found that nuclear power spectra behave like noise, postulating that this might be a characteristic signature of generic quantum chaotic systems. In the present work we implement this idea, using the spectral behavior as a test for the presence of chaos in nuclear mass errors.
In Fra03 a systematic study of nuclear masses was carried out using the shell model, in an attempt to clarify the nature of the errors. This was achieved by employing realistic Hamiltonians with a small random component. In Vel03 we have analyzed in detail the error distribution for the mass formulas of Möller et al.Moll95 and found a conspicuous long range regularity that manifests itself as a double peak in the distribution of mass differences Vel03 . This striking non-Gaussian distribution was found to be robust under a variety of criteria. By assuming a simple sinusoidal correlation, we could empirically substract these correlations and made the average deviation diminish by nearly Hir03 .
In the present letter we carry out a study of the mass deviations in the Finite Range Droplet Model (FRDM) of Möller et al. Moll95 , and in the microscopically motivated mass formula of DZ Duf94 ; Duf95 , analyzing their correlations as time series. Two different criteria are employed to organize the data, which render similar and consistent power laws.
To map the mass error data, which depend on the charge and neutron number , in term of variables with the maximum possible number of nuclei along each chain, the following transformation is employed
| (2) |
Both and are, by construction, integer numbers. To avoid introducing artificial noise, the data are softened by the interpolation of mass errors for unphysical values of , i.e. those with even and odd, or vice versa. This process is necessary to eliminate the large number of zeroes which are induced by the transformation, which create artificial high frequency noise in the data.
We found that the best orientation, in order to have as many isotopes as possible with the same , is . With this transformation, e.g., there are 174 isotopes with .
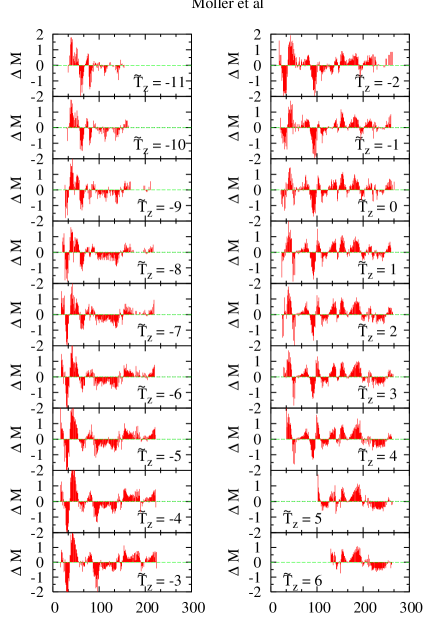
Figure 1 displays the mass errors for 18 values of , from to 6 for the FRDM calculations. The regularities seen in Fig. 2 of Ref. Hir03 as regions with the same gray tone are seen here in the different plots, as groupings of nuclei with similar positive or negative mass differences, for the same region. Besides the two large groups with positive and negative mass errors below , there are evident regions with negative errors close to , and with positive mass differences for .
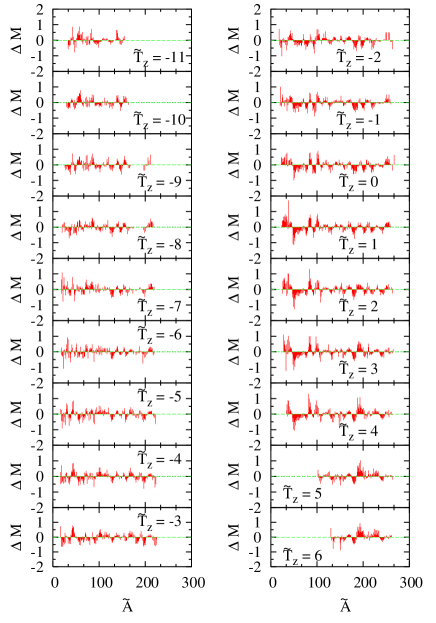
Figure 2 displays the mass errors for 18 values of for the DZ calculations. The deviations are manifestly smaller and exhibit considerably less structure.
The discrete Fourier transforms are calculated as
| (3) |
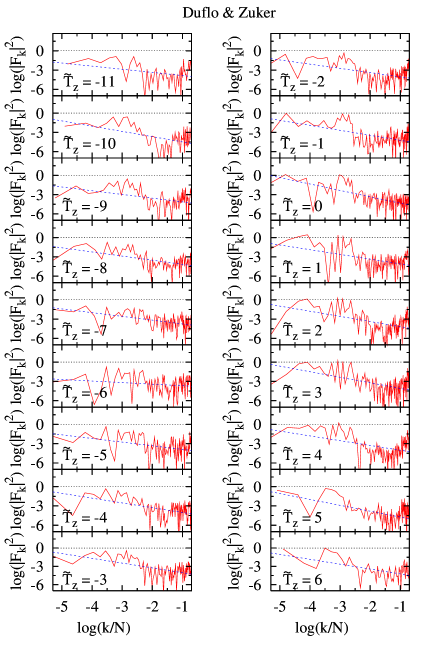
where is the number of mass differences in a given series. The parameter makes dimensionless. Given that it only affects the global scale of the Fourier amplitudes, we made the simple selection MeV. The Fourier amplitudes are plotted as functions of the logarithm of the frequency for the FRDM data in Fig. 3 and for the Duflo and Zuker data in Fig. 4, using a log-log scale.
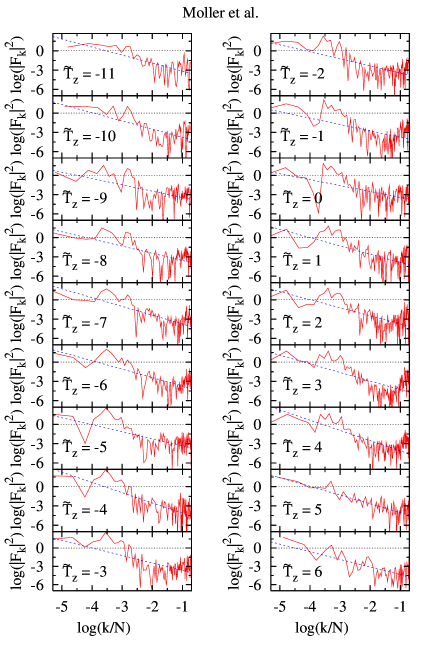
These plots have some remarkable features. As expected from a power law, low frequencies have the larger amplitudes. In most of the plots the largest Fourier amplitudes are those with frequencies between 0.3 and 0.4 (log f = -4 to -3), indicating that oscillations with periods are dominant. This is consistent with the fitted frequencies found in Ref. Hir03 . A slight rise of the amplitudes at the larger frequencies (f 0.5, ) can be seen in many plots. They represent strong fluctuations between some nuclei and their closest neighbors.
The Fourier amplitudes are consistently smaller for the DZ data, which have also a Gaussian-like distribution of the mass differences Vel03 . This indicates that the FRDM mass differences have stronger correlations, which are precisely the ones removed in Ref. Hir03 .
The straight lines correspond to the best fitted slopes, in the log-log plots, of the power spectra, that is, the squared Fourier amplitudes against the frequency. While the fluctuations are large, and the number of nuclei included in each chain range from a few dozen to almost two hundred, the results are striking and correlated with the recently proposed universal features of quantum chaos Rel02 .
For the 18 chains listed, the slopes are
| (4) |
They fluctuate around -1.2 in the FRDM data and around -0.7 for the deviations found by DZ. These slopes convey our main result. The former is consistent with a frequency dependence of characteristic of quantum chaos while the latter suggest a tendency towards a more random behavior characteristic of white noise.
An alternative way to organize the 1654 nuclei with measured masses is to order them in a bustrofedon single list Hir03 , numbered in increasing order. To avoid jumps, we have ordered the nuclei with even A following the increase in N-Z, and those nuclei with odd A starting from the largest value of N-Z, and going on in decreasing order. Fig. 5 exhibits the mass differences plotted against the order number, from 1 to 1654, taken from Möller et al (top) and from DZ (bottom).
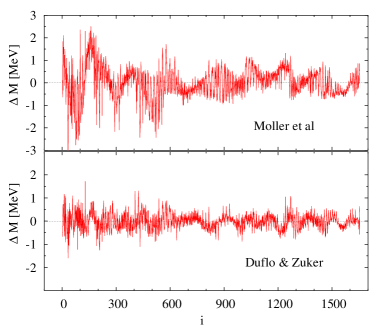
The presence of strong correlations in the Möller at al mass differences is apparent from the plot. Regions with large positive or negative errors are clearly seen. In the data of Duflo and Zuker the distribution of errors is closer to the horizontal axis, and the correlations are less pronounced, although not completely absent.
The ordering provides a single-valued function, whose Fourier transform can be calculated. The squared amplitudes are presented in Fig. 6.
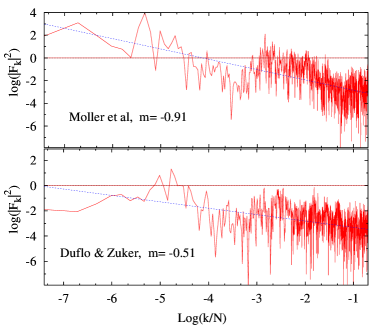
The slopes are
| (5) |
for the FRDM and DZ mass differences.
While this ordering is quite different from the chains, the slopes are very similar.
To understand the possible origin of these spectral distributions, it is worth recalling that, while the FRDM calculations involve a liquid droplet model plus mean field corrections, including deformed single particle energies through the Strutinsky method and pairing Moll95 , the DZ calculations depend on the number of valence proton and neutron particles and holes, including quadratic effects motivated by the microscopic Hamiltonian Zuk94 . The present results show that the DZ formalism produces patterns that are locally smooth approximations to the data, and therefore give some information on the intrinsic nature of the data fluctuations.
We arrive at the conclusion that the chaoticity discussed in Boh02 , according to the criteria put forward in Rel02 , seems indeed to be present in the deviations induced by calculations using the Möller et al. liquid droplet mass formula, while it tends to diminish in the microscopically motivated calculations of Duflo and Zuker. While for the liquid droplet model plus shell corrections a quantum chaotic behavior is found, errors in the microscopic mass formula have , closer to white noise. Given that both models attempt to describe the same set of experimental masses, our analysis suggests that quantum fluctuations in the mass differences arising from substraction of the regular behavior provided by the liquid droplet model plus shell corrections, may have their origin in an incomplete consideration of many body quantum correlations, which are partially included in the calculations of Duflo and Zuker. This interpretation would imply that it is in principle possible to reduce the limits in accuracy mentioned in Abe02 for the calculation of nuclear masses. It remains to be seen whether a robust picture of the coexistence of regular and chaotic motion emerge from these studies and whether a quantitative means to evaluate their relative importance can be formulated.
Acknowledgements: Relevant comments by R. Bijker, O. Bohigas, J. Dukelsky, J. Flores, J.M. Gomez, P. Leboeuf, R. Molina, S. Pittel, A. Raga, P. van Isacker, and A. Zuker are gratefully acknowledged. This work was supported in part by Conacyt, México.
References
- (1) C.E. Rolfs and W.S. Rodney, Cauldrons in the Cosmos, University of Chicago Press (1988).
- (2) D.Lunney, J.M. Pearson, and C. Thibault, Rev. Mod. Phys. 75, 1021 (2003).
- (3) P. Möller, J.R. Nix, W.D. Myers, W.J. Swiatecki, At. Data Nucl. Data Tables 59, 185 (1995).
- (4) J. Duflo, Nucl. Phys. A 576, 29 (1994); J. Duflo and A. P. Zuker, Phys. Rev. C 52, R23 (1995).
- (5) S. Goriely, F. Tondeur, and J.M. Pearson, Atom. Data Nucl. Data Tables 77, 311 (2001).
- (6) O. Bohigas, P. Leboeuf, Phys. Rev. Lett. 88, 92502 (2002).
- (7) S. Åberg, Nature 417, 499 (2002).
- (8) M.L. Mehta, Random Matrices, Academic Press, London (1990).
- (9) E.P. Wigner, Statistical Theories of Spectra: Fluctuations, Academic, New York (1965).
- (10) O. Bohigas, R.U. Haq, A. Pandey, Phys. Rev. Lett. 54, 1645 (1985), and references therein.
- (11) A. Relaño, J.M.G. Gómez, R.A. Molina, J. Retamosa and E. Faleiro, Phys. Rev. Lett. 89 (2002) 244102.
- (12) Víctor Velázquez, Jorge G. Hirsch, and Alejandro Frank, Rev. Mex. Fís. 49 S. 4 (2003) 34.
- (13) Víctor Velázquez, Alejandro Frank, and Jorge G. Hirsch, Computational and Group Theoretical Methods in Nuclear Physics, Eds. J. Escher, O. Castaños, J.G. Hirsch, S. Pittel, G. Stoitcheva, World Scientific, Singapore (2004) 51.
- (14) Jorge G. Hirsch, Alejandro Frank, and Víctor Velázquez, Phys. Rev. C 69, 37304 (2004).
- (15) http://csnwww.in2p3.fr/AMDC/theory/du_zu_28.feb95
- (16) A. P. Zuker, Nucl. Phys. A 576, 65 (1994).