[
Spectroscopy of resonance decays in high-energy heavy-ion experiments
Abstract
Invariant mass distributions of the hadronic decay products from
resonances formed in relativistic heavy ion collision (RHIC)
experiments are investigated with a view to disentangle the effects of
thermal motion and the phase space of decay products from those of
intrinsic changes in the structure of resonances at the freeze-out
conditions. Analytic results of peak mass shifts for the cases of
both equal and unequal mass decay products are derived. The shift is
expressed in terms of the peak mass and width of the vacuum or
medium-modified spectral functions and temperature. Examples of
expected shifts in meson (e.g., ) and baryon (e.g., ) resonances that are
helpful to interpret recent RHIC measurements at BNL are provided.
Although significant downward mass shifts are caused by widened widths
of the meson in medium, a downward shift of at least 50 MeV in
its intrinsic mass is required to account for the reported downward
shift of 60-70 MeV in the peak of the invariant mass
distribution. An observed downward shift from the vacuum peak value of
the distinctively signals a significant downward shift in its
intrinsic peak mass, since unlike for the meson, phase space
functions produce an upward shift for the isobar.
PACS numbers: 25.75-q, 25.75.Dw, 13.25-k, 13.30.Eg
]
I Introduction
Decay products from unstable resonances whose lifetimes are smaller than the duration of fm/c of a relativistic heavy ion collision (RHIC) give valuable insights into (a) the ambient conditions of strongly interacting matter (such as its temperature and chemical potential if matter is equilibrated), and (b) the influence of the hot and dense medium on their intrinsic properties (such as their masses and widths). Through their electromagnetic decays, vector meson resonances like etc… enable a direct view into hot hadronic matter, since dileptons and photons escape without further interactions with matter (for recent accounts, see Refs. [1, 2, 3]). In contrast, hadronic decays which occur when the medium is dense and strongly interacting contribute to thermalize matter, since the decay products undergo substantial rescattering before escaping. Hence such hadronic decay products cannot be used to infer the properties of the parent resonances.
An intriguing exception is the case in which resonance decays occur close to the thermal freeze-out of hadrons. If the decay products do not further interact with the hadronic environment, and their total four-momentum can be measured (this requires that the particles in the final state can be identified and their momenta measured), a resonance bump should appear in the invariant mass plots in . Such reconstructed resonances constitute spectroscopic probes of the freeze-out stage of RHIC experiments. Where possible, a comparison of invariant mass plots from or collisions, with those from nucleus-nucleus collisions at the same c.m. energy enables us to establish the extent to which medium effects leave their imprint on resonances. As we demonstrate, shifts in the peak masses for the cases of meson and isobar decays are distinctively different at the expected freeze-out conditions of RHIC collisions.
Thanks to the growing multiplicities of final state hadrons in RHIC experiments, detailed spectral information is beginning to become available. Examples from Au+Au collisions at BNL include the reconstruction of (a) mesons [4] and -mesons [5] at c.m. energy GeV, (b) -decays [6] at GeV (preliminary results), and (c) decays [7] at GeV. Among the results available to date, the MeV downward shift of the meson peak from its vacuum value of 776 MeV is interesting both because such a shift, if confirmed, implies the presence of considerable hadronic interactions at freeze-out and because it provides the opportunity to pin down in-medium properties of mesons that are susceptible to effects of partial chiral symmetry restoration.
Our objective in this work is to point out how to benefit from such detailed information. Toward this goal, we study invariant mass distributions from the hadronic decay of unstable resonances by exploring the combined effects of phase space functions associated with thermal motion and the decay products, and possible intrinsic changes in the properties of resonances in a hadronic heat bath. While phase space modifications can be evaluated without approximation, those induced by intrinsic changes of resonance structure require model dependent considerations. Ongoing debates about medium modifications of spectral functions can be found, for example, in Refs. [8, 9, 10, 11, 12, 13]. In order to highlight the basic trends of in-medium effects on resonance properties, we utilize results of model calculations in vogue in conjunction with the inevitable phase space functions to show how the invariant mass distributions of resonance decay products are modified from their vacuum counterparts.
II Invariant mass distributions from the decay of unstable resonances
In thermalized matter, the number of events in which a resonance is produced and subsequently decays into a final state is given by (see, for example, Ref. [14])
| (1) |
Above, is the total four-momentum of the decay products, is the invariant mass squared, is the thermal phase space (Bose-Einstein or Fermi-Dirac) distribution of the off-shell unstable resonance particle, is the mass of the resonance at its peak, and is the decay width in vacuum. The proper self-energy describes the influence of the heat bath on the properties of the resonance; explicitly,
| (2) |
In general, the resonance mass and the width depend on the temperature , chemical potential , and interactions between the various constituents of the heat bath. Additionally, both and depend on the momentum of the resonance [8]. Eq. (1) applies strictly to the case in which the hadronic decay products do not undergo further interactions within the medium and freely escape to the detectors. Its applicability is therefore contingent on rescattering effects being small at the decoupling or freeze-out conditions.
The thermal distribution of a resonance particle is
| (3) |
where denotes the spin of the resonance, is the temperature, for bosons and for fermions, and is the energy of the resonance with rapidity and transverse mass , in the fluid rest frame.
In what follows, we utilize Eqs. (1), (2), and (3) to study the invariant mass distribution of the decay products stemming from resonances in a mixture of thermalized hadrons. We begin by first considering decays. In vacuum, we take the decay width of the (the decay occurs with an orbital angular momentum of ) to be
| (4) |
for pion c.m. momenta not too far in excess of , the value at the peak of the resonance. The width grows as due to the penetration factor associated with a partial wave of orbital angular momentum . For , the monotonically increasing dependence in this equation should, however, be tamed as noted e.g., in Ref. [15]. Alternative forms for have been used in the literature (see, for example, Ref. [16]). Since our primary interest is limited to the peak region, Eq. (4) provides an adequate representation insofar as these different parametrizations all agree near the Breit-Wigner peak. The invariant mass distribution is obtained from Eq. (1) by integrating out the longitudinal and transverse momenta of the resonance, i.e.,
| (5) |
Equations (1) through (5) enable us to explore the combined effects of intrinsic changes in the properties of the resonance in a heat bath (given by the real and imaginary parts of the self-energy ) and phase space functions associated with thermal motion and decay products. In order to highlight the effects of each, we consider in turn the cases in which the resonance mass and width are (a) not affected by the heat bath, and (b) influenced by interactions with the other constituents in the heat bath.
A Shifts induced by the phase spaces of thermal motion and decay products
In this case, is set to zero (i.e., no intrinsic mass shift) and is taken at its vacuum value. This allows us to cast Eq. (5) as
| (6) | |||||
| (7) |
For , it is advantageous to express above (after performing integrations over and ) as
| (8) |
where the sign refers to bosons (fermions) and is the modified Bessel function. For invariant masses , where MeV, and temperatures in the range , we can retain only the term in the sum above and employ the asymptotic expansion in order to gain a qualitative insight into the shifts caused by phase space alone. Collecting the dependences from Eqs. (5), (6), and (8) together, we arrive at
| (9) | |||||
| (10) |
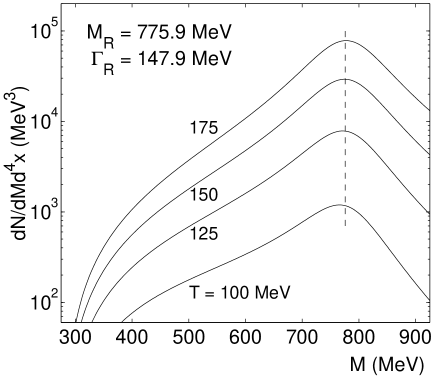
where the factors omitted, including those that depend on and , contribute only to the normalization. The result in Eq. (9) has the appealing physical interpretation that the invariant mass distribution is given by the simple product “Breit-Wigner probability of resonance formation” “Available phase space for decay products” “Density of Boltzmann-like ‘particles’ of mass .” (Such simplicity is lost when effects of interactions and Bose-Einstein enhancement are included.) Note that while the Boltzmann factor tends to pull the peak position of the Breit-Wigner at to lower values of (the lower the , the larger is the downward shift), the power law dependence arising from the phase space of decay products and the pre-exponential factor in the density tend to pull the peak position to . The net result from Eq. (6) is shown in Fig. 1, where we have used MeV and MeV inferred from production in collisions [17] which are free of uncertainties associated with production in hadronic collisions ***The resonant part of the mass spectrum in hadronic collisions is well fit by a Breit-Wigner form with MeV and MeV [17]. Relative to the spectrum observed in collisions, there is MeV downward shift in the peak mass, which is commonly attributed to effects of final state interactions. While it is tempting to use this downward shift to advantage, it is, as yet, unclear if the effects of final state interactions in heavy-ion collisions are the same as in elementary hadronic collisions. Use of such an intrinsic shift is, however, straightforward in the theoretical formalism outlined in Secs. II through IV.. The results shown refer to the case of ; nonzero values of mainly affect the normalization of the distributions, but not their peak positions or shapes. It is clear that the combined effects of thermal and decay product phase spaces are small, and at best produce a downward shift of about MeV at the lowest temperature in the range .
The peak position is determined by locating the value of at which Eq. (6) exhibits a maximum. Setting the derivative of Eq. (6) with respect to to zero, we solve for from
| (11) |
where we have introduced the abbreviations , , and (for the decay, ). For the temperatures chosen in Fig. 1, Table 1 gives results for the peak positions , shifts from the vacuum value , average masses , and variances , where the symbol denotes averages taken over the invariant mass distribution. Together with , the quantities and provide a rough measure of the shape of the distribution. As noted earlier, the shift of the peak mass is largest at the smallest temperature, since in this case the steep Boltzmann spectrum provides a strong bias towards low masses. This leads to the intriguing possibility that a measured shift of the -mass can be used to delimit the freeze-out or decoupling temperature of the disassembling hadronic fireball, provided medium-induced effects on the -spectral function and rescattering of the decay pions are small or under full theoretical control.
The opposite pulls of the falling exponential (due to the Boltzmann factor) and the rising power law (due to the phase space of decay products and the pre-exponential factor in the non-degenerate density) nearly cancel at MeV, leading to . At the highest temperature considered ( MeV is thought to be the chemical freeze-out temperature at RHIC [18]), the power law rise wins over the exponential fall inasmuch as . It is worthwhile remembering, however, that at these temperatures, effects of interactions cannot be ignored, and that the results shown in Fig. 1 and Table 1 refer to the effects of phase space alone. Furthermore, as , the basic structure of a resonance itself would be considerably altered from its vacuum form due to effects of deconfinement and/or chiral symmetry restoration.
| 175 | 777.4 | 1.5 | 778.7 | 123.7 |
| 150 | 774.9 | 765.0 | 120.0 | |
| 125 | 771.3 | 746.4 | 118.9 | |
| 100 | 765.3 | 717.7 | 123.0 |
Table 1: Basic characteristics of the invariant mass distributions in Fig. 1. is the temperature, is the peak position, is the shift from the vacuum value, is the average mass, and is the variance of the distribution (all values are in MeV). The vacuum Breit-Wigner peak mass and width are MeV and MeV, respectively.
B Analytic results to leading order
To better understand the dependence of the shift on the decoupling temperature, peak mass, and width of the resonance, we solve Eq. (11) to linear order in the shift , which is at best of order 10% (see Table 1). Keeping only the first term in the sums in Eq. (11) (the Boltzmann approximation is adequate around the peak mass), we find
| (12) | |||
| (13) |
where the Bessel functions are evaluated at . For , we can simplify the above expression to obtain
| (14) |
In obtaining this result, use was made of the asymptotic expansion . Further linearization of the fraction in Eq. (14) in terms of results in
| (15) |
Note that the second and third terms in Eq. (14) give substantial contributions, which attests to the significance of the power law behaviors of the available phase space (see Eq. (4)) and the pre-exponential term in the density of particles of mass . For example, the first term in Eq. (15) yields a shift of
| (16) |
which is considerably larger in magnitude than –9.8(1.6) MeV given by considering the other terms. The corresponding shift from Eq. (15) is –9.2(1.9) MeV. These shifts are to be contrasted with the full numerical solutions from Eq. (11):
| (17) |
Observe that Eq. (14) implies that for
| (18) |
in excellent agreement with that obtained from Eq. (11). A comparison of versus temperature from the different approximations is shown in Fig. 2. We have verified that effects of Bose statistics are not very significant at these temperatures.

C Shifts induced by in-medium interactions plus thermal and decay product phase spaces
From Eqs. (14) and (15), it is evident that the width of a resonance strongly influences the magnitude of the peak mass shift. Thus, a broad resonance such as the will exhibit a larger shift than sharp resonances such as the or . In-medium interactions with the other constituents of the heat bath, namely mesons such as and baryons such as , will likely modify the spectral function from its vacuum form. The observed distributions are, however, convolutions of such intrinsic changes (pressure broadening and interaction-induced mass shift) with the thermal phase space and the phase space for the corresponding decay products. These intrinsic changes are given by the self-energy (see Eq. (2)), with giving the intrinsic mass shift and giving the in-medium width.
Before turning to detailed model calculations of , it is useful to explore the combined effects of schematic intrinsic changes (such as a broadened, but unshifted resonance or a shifted, but not broadened resonance; the realistic case would include a combination of both) and the thermal and decay product phase space functions. In Fig. 3, we show the invariant mass distribution of the -meson with a fixed peak mass of 775.9 MeV at a temperature of 100 MeV for different widths ( to 200 MeV in steps of 25 MeV). It is evident that an intrinsic broadening of the resonance induces a considerable shift in the peak mass; the larger the broadening, the larger is the shift.
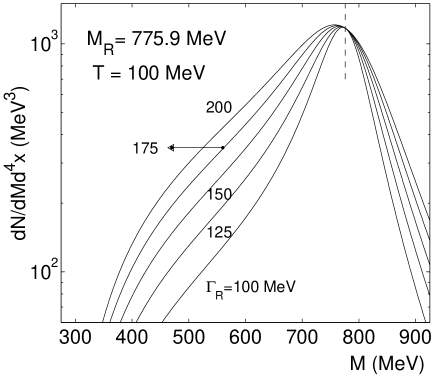
It is noteworthy that for low temperatures and large intrinsic widths, the shape of the invariant distribution is considerably distorted from its symmetric form in vacuum. Consequently, the definition of the “width” as normally used for symmetric shapes loses its utility as shown by the standard deviations in Table 2. The locations of the maxima and the mass-shifts are also listed in Table 2 for the various curves shown in Fig. 3.
| 100 | 771.3 | 732.4 | 107.3 | |
| 125 | 768.7 | 724.3 | 116.2 | |
| 150 | 765.4 | 717.2 | 123.6 | |
| 175 | 761.6 | 710.7 | 129.8 | |
| 200 | 757.2 | 705.0 | 135.1 |
Table 2: Shifts (from Eq. (11)) of the peak mass induced by varying intrinsic widths, , of the resonance. The Breit-Wigner peak mass is at MeV. Also shown are the average mass and the standard deviation of the distribution. All values are in MeV.
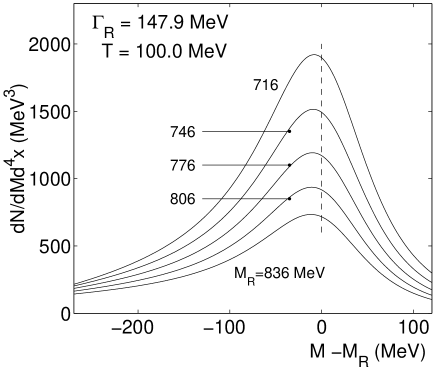
We turn now to the case in which intrinsic changes in the peak mass alone are considered. For simplicity, and because the dependence on the momentum of the resonance is small for low temperatures and baryon number densities at freeze-out (see Fig. 8 of Ref. [8]), we use constant peak mass shifts for illustrative purposes. The results in Fig. 4 and Table 3 confirm our expectations from Eqs. (14) and (15) that the mass shift is largely independent of the peak mass. For the case considered, MeV, the mass shift relative to the peak mass varies from 1.4% for MeV to 1.1% for MeV. Thus, relative to the assumed peak mass, shifts induced by intrinsic mass shifts are smaller than those caused by changes in the width.
| 716 | 707.8 | 674.7 | 111.3 | |
| 746 | 736.7 | 696.4 | 116.9 | |
| 776 | 765.8 | 717.8 | 123.0 | |
| 806 | 795.0 | 738.7 | 129.7 | |
| 836 | 824.2 | 759.1 | 137.0 |
Table 3: Peak mass and shift (from Eq. (11)) versus the Breit-Wigner maximum for a fixed width MeV (all numbers are in MeV). Also shown is the the standard deviation of the invariant distribution.
The results shown in Fig. 4 and Table 3 refer to peak mass shifts caused by the phase space functions on top of the assumed intrinsic mass shifts in the range MeV †††Upward intrinsic mass shifts are also considered to encompass the expectations of Ref. [12].. Compared to the vacuum peak mass, the total shift is given by
| (19) |
Thus, for example,
| (20) | |||||
| (21) |
It is evident that sizeable intrinsic mass shifts are required to generate sizeable peak mass shifts in the invariant mass distributions.
III Contributions to the final state from the and mesons
In the peak region of the invariant mass spectrum, contributions to the final state include those that arise from the (hereafter ) and mesons that are also likely modified by medium effects.
A decays
The decay of the is distinctive, chiefly because of its narrow total width MeV in vacuum. Although the dominant decay channel is the decay (), a small fraction ( of the decays occur via the channel. For the latter case, Eqs. (11) through (15) show that the influence of the phase space functions on the peak mass shift of the is negligibly small. Unless large intrinsic shifts are caused by the medium, the shift in the peak mass in the invariant distribution of its final state is likely to be very small. Calculations to date [8, 9] have found only modest changes in and at the freeze-out temperatures of (100–125) MeV.
B decays
Pinning down the contributions from the decays is more difficult, especially since its vacuum width is rather large and its peak position in vacuum is somewhat uncertain [17]. To encompass the possible variations, we first present results of two illustrative calculations; one in which we take MeV and MeV (this case refers to the average peak mass and the average width, respectively), and the other in which we employ MeV and MeV (these values represent averages from the and decays [17]). The vacuum decay width for the is
| (22) | |||||
| (23) |
as, in this case, the orbital angular momentum . Utilizing this in Eq. (6) with spin , results of invariant mass distributions from the decay are shown by the dash-dotted lines in Fig. 5 for temperatures expected near freeze-out. As is clear from the solid curves in this figure, which show the summed contributions from the (dashed curves) and decays, the maximum near the peak-region of the mass spectrum is barely influenced by the small and exponentially falling contributions from the decays. The contributions from the decays dominate, however, for masses well below the peak.
By setting in Eq. (11), one can straightforwardly obtain a very rough estimate of the peak mass shift in the invariant mass distribution from the decay. The result to linear order in is
| (24) |
This result, however, provides a poor approximation to the numerical results from Eq. (11) chiefly because the shifts are large.
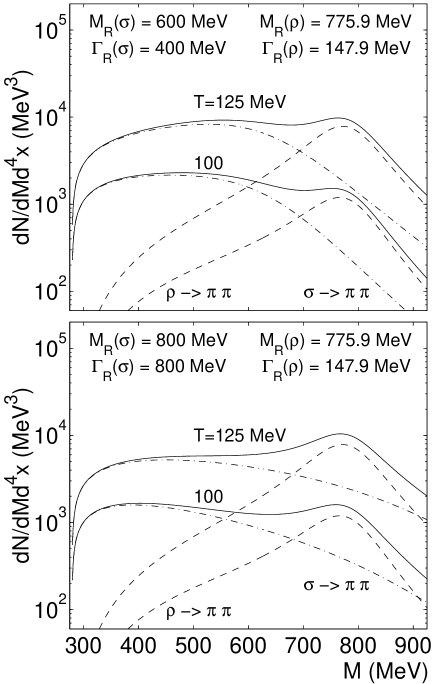
Table 4 lists the peak masses and shifts calculated numerically from Eq. (11) with for the cases 600 (400) and 800 (800) MeV, respectively. Notice that the shifts in the invariant mass distributions from the decay in medium depend strongly on the parameters used to describe the shape of the resonance in vacuum.
| = 600 | 125 | 527.2 | |
| = 400 | 100 | 458.5 | |
| = 800 | 125 | 450.5 | |
| = 800 | 100 | 391.0 |
Table 4: Peak mass and shift (from Eq. (11)) versus temperature for the indicated values of the Breit-Wigner maximum and width (all numbers are in MeV).
C In-medium shifts of the meson
The intrinsic mass shift of the fragile meson is intimately related with chiral symmetry restoration (cf. [19] and references therein). With increasing temperature (or baryon density), is expected to steadily decrease and approach the pion mass as chiral symmetry is fully restored at MeV (the precise number is still a matter of intense debate!). Being a Goldstone boson, remains nearly constant at its vacuum value even as is approached. Thus, at the freeze-out temperatures MeV and rather small baryon densities under consideration here, modest downward shifts of the peak mass from its vacuum value are to be expected. For definiteness, we choose an optimistic intrinsic mass shift of MeV relative to its vacuum value of 600 MeV based on the model calculations reported in [19]. At first, we take MeV. In this case, the shifts relative to MeV are MeV for MeV, respectively. These shifts, relative to the vacuum peak mass of 600 MeV, amount to the total shifts
| (25) | |||||
| (26) |
In addition to its mass, the decay width also decreases with increasing temperature. For illustration, we employ MeV. This results in shifts MeV for MeV. The corresponding total shifts are
| (27) | |||||
| (28) |
In all cases considered, the contributions at the peak mass are given predominantly by the exponentially falling Boltzmann factors and provide small corrections to those from decays. The left-wings of the distributions are, however, destroyed insofar as the summed invariant distributions are relatively flat over a wide range of invariant masses . Note, however, that the decays that essentially occur in vacuum exhibit a prominent peak at MeV and that the decays constitute a background in the vicinity of this peak.
IV Shifts of baryon resonances
Most of the secondary particles produced in RHIC collisions are mesons. However, many baryons and baryon resonances including their anti-particles are also produced. Invariant distributions of hadronic decay products from baryon resonances are best exemplified by considering the decay of the -resonance. In-medium properties of the have been studied earlier through photo-absorption and hadronic reactions on nuclei [20, 21, 22], but has received relatively little attention at temperatures characteristic of RHIC collisions.
A Effects of thermal motion and the phase space of unequal mass decay products
As in the case of decay, the decay, where is a nucleon, occurs with orbital angular momentum . Thus, the invariant mass distribution can be calculated following the procedure outlined in Sec. II, but with
| (29) |
where is the c.m. momentum of either the pion or nucleon, i.e.,
| (30) |
where and is the c.m. momentum with . (Near the peak region, the functional form in Eq. (29) matches that advocated in Ref. [22] in which a more complete discussion of can be found.) In this case, the maximum in the invariant mass distribution is obtained by solving for from
| (31) | |||
| (32) |
where , and . Since for masses near the peak region, , Eq. (31) can be solved for the linear shift as in Sec. II.B by considering only the terms in the second term (the Boltzmann limit). To linear order in , the shift in the peak mass is given by
| (33) |
where
| (34) |
Note that Eq. (33) reduces to Eq. (15) in the limit of identical final state particles. The extent to which the linear shift in Eq. (33) reproduces the numerical results from Eq. (31) is shown in Table 5.
| 175 | 12.6 | 13.8 |
|---|---|---|
| 150 | 11.0 | 12.0 |
| 125 | 8.7 | 9.6 |
| 100 | 5.4 | 6.1 |
Table 5: Comparison of peak mass shifts from Eq. (31)) and Eq. (33)) versus temperature for the decay. The Breit-Wigner maximum MeV and MeV. The shifts are in MeV.
The temperature at which the shift is given by
| (35) |
This temperature, being considerably lower than the freeze-out temperature , implies that an observed downward shift from the vacuum peak value of 1232 MeV from decay distinctively signals an intrinsic downward shift due to in-medium effects ‡‡‡The precise value of depends on the peak mass and width of the resonance. Intrinsic shifts of these quantities considered in Sec. IV.B result in values of MeV. Thus, the main conclusion that remains valid in the presence of medium modifications of the width and peak mass of the resonance.. By the same token, an observed upward shift must be attributed to the predominance of the phase space function associated with the decay products, although the left-wings of higher mass resonances can also contribute in determining the peak position. We turn now to effects of in-medium mass and width modifications on the peak mass shift.
B In-medium shifts of the isobar
In photonuclear reactions, cross-sections per nucleon for nuclei ranging from 9Be to 238U when compared to the average single nucleon total photoabsorption cross-section clearly show that the resonance appears at an energy close to that of the free , but spread over a wider energy range [23]. In nucleus reactions, however, in addition to a widened width, the resonance energy is also shifted downward by about 20–30 MeV. An illuminating discussion of the various effects contributing to in-medium shifts at zero temperature can be found in [22]. The total width arises from a combination of competing effects:
| (36) |
The dominant contribution arises from the so-called elastic broadening of the width, , given by the imaginary part of the matrix element , where stands for a nucleon hole and denotes the pion-mediated interaction between baryons 1 and 2. Coupling to absorptive channels (typically one-quarter to one-third of the total cross-section in the resonance region comes from this source) corresponds to the coupling of hole states to multiple nucleon-hole (nNnh) states and increases the width. In contrast, the width is reduced by the Pauli exclusion principle, since in the decay , occupied nucleon states are inaccessible. The net effect, however, is a net increase in the width of states. For low baryon densities and for temperatures of interest here, however, the dominant contributions arise from and , since Pauli effects are small for non-degenerate baryons. Additional modifications from coupling to higher-lying -resonances remain largely unexplored.
The width modifications are accompanied by dispersive energy shifts (for nuclei, these amount to a few tens of MeV). Such shifts are due to the combined effects of binding in matter, dispersive shifts related to absorption, short-range hole correlations, coupling to higher-lying -resonances, etc. To date, the individual contributions from these various sources have not been resolved in experiments.
| 125 | 14.2 | ||
| = 1192 | 100 | 10.9 | |
| 125 | 11.1 | ||
| = 1212 | 100 | 7.9 | |
| 125 | 6.8 | ||
| = 1252 | 100 | 3.5 | |
| 125 | 5.1 | ||
| = 1272 | 100 | 1.8 |
Table 6: Peak mass shifts from Eq. (31) caused by in-medium Breit-Wigner peak values of and the vacuum value of MeV. The values of bracket the likely temperature at freeze-out. refers to the total shift from the vacuum peak value. All numbers are in MeV.
| 125 | 6.3 | |
| 100 | 3.9 | |
| 125 | 11.5 | |
| 100 | 7.1 |
Table 7: Peak mass shifts from Eq. (31) due to in-medium Breit-Wigner widths and the vacuum peak value of MeV. The values of bracket the likely temperature at freeze-out. All numbers are in MeV.
Tables 6 and 7 show results of shifts and calculated from Eq. (31) with representative in-medium shifts. These results show how medium-induced modifications are reflected in the invariant distribution of final states from decays alone. Viewed together with the results in Table 5, the results in Tables 6 and 7 imply that a downward shift in the peak value of the resonance requires a substantial dispersive energy shift in the medium. Building upon the known physics, an in-depth finite temperature analysis that includes coupling to higher resonances is necessary.
V Discussion
A In-medium spectral functions
In the context of lepton-pair (e.g., ) and photon production from the dense stages of heavy-ion collisions, considerable amount of work has been done on the in-medium spectral functions of vector mesons (see, e.g., Refs. [2, 3] for exhaustive references). The viewpoints that have emerged can be roughly classified into two broad categories:
(1) The masses of the vector mesons, particularly those of the and , decrease substantially with increasing temperature and net baryon density . This view, espoused in Ref. [13] and shared to varying degrees in other works [19, 24], is based essentially on the decreasing behavior of the condensate which in turn is related to the vector meson masses as a function of and . For additional dependences on strong interaction couplings, see Refs. [13, 19, 24].
(2) The peaks of the spectral densities are little shifted from their vacuum positions, but the widths are considerably increased due to medium effects that include collisional broadening [2, 3, 8]. This view stems from many-body calculations that consider the many hadron states (for an extensive list, see Sec. II of Ref. [8], and particularly, Table 1 therein) to which the vector mesons couple in a heat bath. By relating the self-energy to the real and imaginary parts of the forward scattering amplitude, Ref. [8] exploits experimental data where possible to infer the peak positions and widths in medium.
In both scenarios, the largest medium-induced effects, whether it is a mass shift or a widened width, occur for MeV and for , where is the nuclear equilibrium density. However, near freeze-out and . Since our focus here is on the properties of resonances as reflected by their hadronic decay products at the dilute stages of freeze-out, medium-induced effects are expected to be considerably smaller than those for lepton-pair and photon production which occurs dominantly at the dense stages of the collision.
In computing shifts of peaks in the invariant mass distributions in this work, we have utilized the basic trends found in the intrinsic shifts of both the peak masses and widths in both of the above approaches. Specifically, the effects of widened widths and both downward and upward intrinsic mass shifts on the invariant mass distributions were investigated. For temperatures at freeze-out and negligibly small baryon densities under consideration, the momentum dependences of the intrinsic widths are rather weak [8] being significant only for momenta . These weak momentum dependences are washed out upon convolution with thermal and decay product phase space functions. Thus, our discussion has been carried out with momentum-independent in-medium widths. For the decay widths, however, the appropriate orbital angular momentum dependences were considered.
B Flow–related matters
Hadrons of various species () are known to exhibit strong collective expansions (large longitudinal and transverse flows have become a part of RHIC life; see [25] and references therein) as a result of pressure gradients established at a relatively early stage of the collision [26]. Prime examples of collective flow include the “blue-shift” or flattening of the observed transverse momentum spectra [27], and the azimuthal angular anisotropy or elliptic flow [28], of the various particles. Invariant mass spectra, however, do not depend on Lorentz boosts and are thus unaffected by collective flow. Contributions from the various phase space cells can be determined in their rest frames and subsequently summed to give the total distribution. This underscores the importance of spectral function studies that are potentially the only means to delineate the intrinsic properties of resonances at both the dense and freeze-out stages of high-energy heavy-ion collisions.
C Relation to other works
Based on the nonrelativstic expression for the Breit-Wigner peak
| (37) |
Ref. [29] found a downward energy shift of the maximum of the energy spectrum of the mesons to be
| (38) | |||||
| (39) |
This shift differs substantially from the MeV shift at the same temperature obtained in this work. It is easy to verify that shifts to linear order obtained from the use of nonrelativistic and relativistic Breit-Wigner forms both lead to the same result in Eq. (12). We therefore surmise that the substantial positive shift from the third term in the numerator of Eq. (14),
| (40) | |||||
| (41) |
which arises from the phase space of the decay products, was possibly not fully considered in estimating the shift in Ref. [29].
Our work here partly overlaps that in Ref. [30]. Complementary information, including mass shifts through the Brown-Rho scenario, the role of channel resonances in inducing mass shifts of the meson, some aspects of kinetic freeze-out, effects of the heat bath etc., can be found in Ref. [30]. However, the influence of the angular-momentum-dependent decay product phase space, crucial for comparison with experimental invariant mass distributions, was not considered in [30]. Our work, in addition to bracketing the effects of different scenarios concerning medium-induced effects, highlights the importance of the competition between intrinsic shifts and phase space functions related with thermal effects and decay products. The large differences in the peak mass shifts in invariant mass distributions between our work and those of Refs. [29, 30] stem primarily from the fact that the decay product phase space functions were not considered in the latter works.
The results in Secs. II through IV clearly show that qualitative differences exist in the influence of the dependence on the decays of and , insofar as the decay product phase space functions, in conjunction with thermal phase space and expected intrinsic shifts, produce qualitatively different results. In decay, the net result is a downward shift from the vacuum value of the peak mass at freeze-out temperatures. In decay, however, larger than vacuum peak masses are favored unless large modifications in the intrinsic mass and width tip the balance. Our work shares the view with that of Ref. [30] that substantial in-medium collisional and dispersive energy shifts are necessary to produce the substantial mass shift in the reported meson invariant mass spectrum [6].
VI Summary and principal findings
A study of the peak positions of resonances and their shapes is a time-honored spectroscopic tool that is beginning to be used to probe the freeze-out conditions at RHIC collisions and to establish the properties of resonances in a hot and dense medium. The recently reported 60–70 MeV downward shift in the peak of the invariant mass distribution of pions from the decay of mesons is particularly interesting in this regard, since the decay products originate from the dilute freeze-out stage of the collision. In this work, we have investigated in some detail the interplay of thermal motion, the phase space of decay products, and intrinsic changes in the structure of the resonances for temperatures and hadron densities expected at freeze-out. The effects of thermal and orbital angular momentum-dependent phase space functions were evaluated without approximation. Analytic results of shifts to leading order in ( is the temperature and is mass at the peak of the resonance) for the cases of both equal and unequal mass decay products were derived. Medium-induced intrinsic shifts in the width and peak positions were taken from state-of-the-art calculations in order to assess the extent to which such shifts are required to account for the reported shift of the meson peak. The contribution to the final state from the or sigma meson was assessed. The expected shift in the peak of the invariant mass distribution of decay of the resonance was calculated.
Among the important points that emerge from calculations in which resonance peak masses and widths were taken to be at their vacuum values are:
-
The combined effects of thermal and decay product phase spaces on the peak mass are small, and at best produce a downward shift of about MeV (from the vacuum value) at the lowest temperature in the range . Upward shifts occur for temperatures MeV.
-
The invariant distribution is considerably distorted, chiefly because of its large vacuum width. Depending strongly on the parameters used to describe its mass spectrum in vacuum, shifts of hundreds of MeV occur in its peak mass in a much broadened mass distribution.
-
The shift in the peak mass of the resonance is negligibly small because of its small vacuum width.
-
Largely due to the growing phase space of the decay products, the peak of the resonance shifts upward from its vacuum value in the range , where is the freeze-out temperature. Downward shifts are produced only for (unlikely) freeze-out temperatures MeV.
For freeze-out temperatures in the range , calculations in which intrinsic changes in the resonance widths and masses were incorporated led to the following conclusions:
-
Although significant downward mass shifts are caused by widened widths of the meson, a sizeable shift in its intrinsic mass, at least of order 50 MeV, is required to generate a shift of order 60-70 MeV in the peak of the invariant mass distribution of the meson.
-
Downward shifts of hundreds of MeV occur in the invariant distribution with decreasing in-medium masses suggested by chiral symmetry restoration. As a result, contributions from the decay at the peak mass are primarily determined by the exponentially decreasing thermal phase space and provide small corrections to those from decays. The summed invariant distribution is relatively flat in the range . In this region, however, the decays exhibit a prominent peak at MeV and the decays constitute a background to this peak.
-
Unless large intrinsic shifts are caused by the medium, the shift of the peak in the invariant distribution of its final state is very small.
-
An observed downward shift from the vacuum peak at 1232 MeV from decay distinctively signals a downward shift in its intrinsic peak mass due to in-medium effects. (Recall that, unlike for the meson, thermal and decay product phase space functions produce an upward shift for the .) For example, at MeV, the peak mass in the invariant distribution moves down by MeV for an intrinsic downward mass shift of MeV.
VII Outlook
Some points that are naturally raised as a consequence of this work and that merit further study include:
-
The reported shift in the meson peak is surprisingly large. Why and how then are the particles decoupling insofar as freeze-out represents the stage when interactions are at their weakest? The answers to these questions hinge on the extent to which rescattering effects affect the decay distributions at freeze-out (see, e.g., Ref. [29]).
-
A shift as large as 60-70 MeV in the mass at the dilute stages points to considerably larger shifts at the dense stages of the collision. This has far-reaching consequences for dilepton and photon emissions, which occur predominantly at hadron densities and temperatures that are significantly larger than those at freeze-out. Experimental establishment of spectroscopic shifts, both at the dilute stage (through hadronic probes) and dense stage (through electromagnetic probes) at RHIC collisions offers the opportunity to choose between scenarios that have distinctive predictions about the effects of chiral symmetry restoration on resonances in a hot and dense medium.
-
Spectroscopy of resonance decays, particularly those of the meson and -isobar, also offers the means to delimit the temperature and baryon chemical potential of hadronic matter at the decoupling stage (for more details, see Secs. II and IV). This complements our knowledge about freeze-out conditions inferred from stable particle ratios.
-
We cannot refrain from mentioning that it would be marvelous, albeit difficult, to conduct resonance tomography through Hanbury-Brown–Twiss analyses by utilizing the decay products of resonances at RHIC and planned LHC experiments.
Acknowledgements
We thank Gerry Brown, Joe Kapusta, Volker Koch, Ralf Rapp, and Edward Shuryak for enlightening discussions. This work was supported in part by the U.S. Department of Energy under grant No. DE-FG02-88ER40388. PFK acknowledges support from the Alexander von Humboldt Foundation through a Feodor-Lynen Fellowship.
REFERENCES
- [1] P. Huovinen, M. Belkacem, P.J. Ellis, and J.I. Kapusta, Phys. Rev. C66, 014903 (2002).
- [2] C. Gale, Nucl. Phys. A698, 143c (2002).
- [3] R. Rapp and J. Wambach, Adv. Nucl. Phys. 25, 1 (2000).
- [4] C. Adler et al., (STAR Collaboration), nucl-ex/0205015.
- [5] C. Adler et al., (STAR Collaboration), Phys. Rev. C65, 041901(R) (2002).
- [6] P. Fachini et al. (STAR Collaboration), nucl-ex/0211001.
- [7] J. Adams et al., (STAR Collaboration), nucl-ex/0211024.
- [8] V.L. Eletsky, M. Belkacem, P.J. Ellis, and J.I. Kapusta, Phys. Rev. C64, 035202 (2001).
- [9] F. Klingl, N. Kaiser, and W. Weise, Nucl. Phys. A624, 527 (1997).
- [10] R. Rapp, G. Chanfray, and J. Wambach, Phys. Rev. Lett. 76, 368 (1996); Nucl. Phys. A617, 472 (1997); R. Rapp and C. Gale, Phys. Rev. C60, 024903 (1999).
- [11] J.V. Steele, H. Yamagishi, and I. Zahed, Phys. Lett. B384, 255 (1996); Phys. Rev. D56, 5605 (1997).
- [12] R.D. Pisarski, Nucl. Phys. A590, 553c (1995); Phys. Rev. D52, 3773 (1995).
- [13] G.E. Brown and M. Rho Phys. Rev. Lett. 66, 2720 (1991); Phys. Rep. 363, 85 (2002); nucl-th/0206021, and references therein.
- [14] H.A. Weldon, Ann. Phys. 228, 43 (1993).
- [15] G. Bertsch, M. Gong, L. McLerran, P.V. Ruuskanen, and E. Sarkkinen, Phys. Rev. D37, 1202 (1988).
- [16] G.E. Brown, M. Rho, and W. Weise, Nucl. Phys. A454, 669 (1986).
- [17] Particle Data Group, K. Hagiwara et al., Phys. Rev. D66, 010001 (2002).
- [18] P. Braun-Munzinger, D. Magestro, K. Redlich, and J. Stachel, Phys. Lett. B518, 41 (2001).
- [19] T. Hatsuda and T. Kunihiro, Phys. Rep. 247, 221 (1994).
- [20] G.E. Brown and W. Weise, Phys. Rep. 22, 279 (1975).
- [21] E. Oset, H. Toki, and W. Weise, Phys. Rep. 83, 281 (1982).
- [22] T. Ericson and W. Weise, Pions and Nuclei (Clarendon Press, Oxford, 1988).
- [23] J. Ahrens, Nucl. Phys. A446, 229c (1985).
- [24] M. Harada and K. Yamawaki, Phys. Rev. D 64, 014023 (2001).
- [25] Nu Xu and Z. Xu, nucl-ex/0211012; S. Voloshin, nucl-ex/0210033.
- [26] P.F. Kolb, J. Sollfrank, and U. Heinz, Phys. Rev. C62, 054909 (2000); U. Heinz and P.F. Kolb, Nucl. Phys. A702, 269 (2002), nucl-th/0204061.
- [27] E. Schnedermann, J. Sollfrank, and U. Heinz, Phys. Rev. C48, 2462 (1993).
- [28] J.-Y. Ollitrault, Phys. Rev. D46, 229 (1992).
- [29] H.W. Barz, G. Bertsch, B.L. Friman, H. Schulz, and S. Boggs, Phys. Lett. B265, 219 (1991).
- [30] E.V. Shuryak and G.E. Brown, hep-ph/0211119.