Mapping Deconfinement with a Compact Star Phase Diagram
Abstract
We have found correlations between properties of the equation of state for stellar matter with a phase transition at supernuclear densities and two characteristic features of a phase diagram for rotating compact stars in the angular velocity - baryon number plane: 1) the critical dividing line between mono- and two-phase star configurations and 2) the maximum mass line. The second line corresponds to the minimum mass function for black hole candidates whereas the first one is observable by a population statistics, e.g. for Z-sources in low-mass X-ray binaries. The observation of a population gap in the mass distribution for the latter is suggested as an astrophysical verification of the existence of a first order phase transition in QCD at high densities such as the deconfinement.
1 Introduction
At present, the existence of exotic phases of matter at high densities is under experimental investigation in ultrarelativistic heavy-ion collisions [1] the most prominent being the deconfined phase of QCD [2]. While the diagnostics of a phase transition in experiments with heavy-ion beams faces the problems of strong nonequilibrium and finite size, the dense matter in a compact star forms a macroscopic system in thermal and chemical equilibrium for which effects signalling a phase transition shall be most pronounced.
We introduce a classification of rotating compact stars in the plane of their angular frequency and mass (baryon number ) which we will call phase diagram. In this diagram, configurations with high density matter cores are separated from conventional ones by a critical phase transition line. The position and the form of these lines are sensitive to changes in the equation of state of stellar matter [13]. Since the phase diagram of rotating compact objects seems to be a more general approach for investigations of phase transition effects in the interior of the star we assume that the deconfinement transition could be a particular case besides of other possibilities for phase transitions like pion or kaon condensation as discussed, e.g. in [3, 4]. Therefore, our aim is to suggest it as a heuristic tool for obtaining constraints on the EoS at high densities from the rotational behaviour of compact stars.
2 EoS and compact star phase diagram
Our focus is on the elucidation of qualitative features of signals from the high density phase transition in the pulsar timing, therefore we use a generic form of an equation of state (EoS) with such a transition. We use the polytropic type equation of state [5] for different values of the incompressibility [6] at the saturation density, see Ref. [14]. The phase transition between the lower and higher density phases is made by the Maxwell construction [7] and compared to a relativistic mean field model consisting of a linear Walecka plus dynamical quark model EoS [8, 9] with a Gibbs construction [10, 15], see Fig.2.
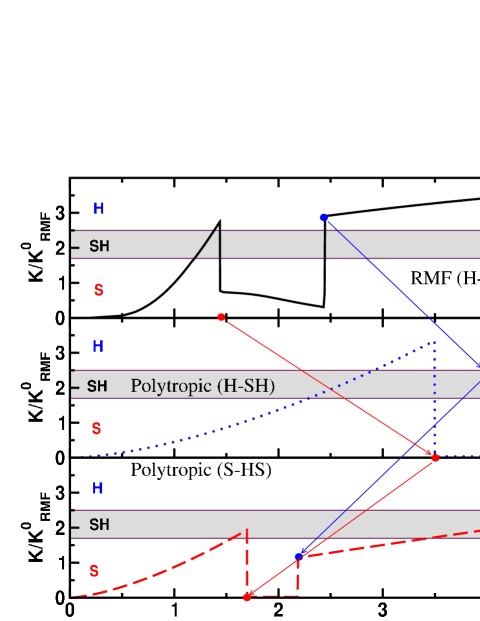
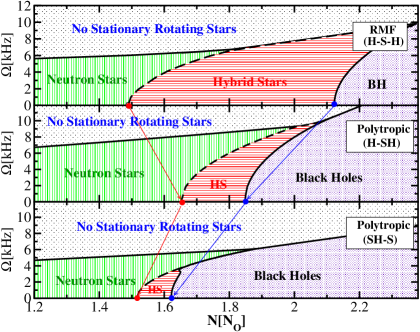
In Fig. 2 we display the phase diagrams for the rotating star configurations, which correspond to the three model EoS of Fig. 2. These phase diagrams have four regions: (i) the region above the maximum frequency where no stationary rotating configurations are found, (ii) the region of black holes , and the region of stable compact stars which is subdivided by the critical line into (iii) the region of hybrid stars for where configurations contain a core with a second, high density phase and (iv) the region of mono-phase stars without such a core.
From the comparison of the regional structure of these three different phase diagrams in Fig. 2 with the corresponding EoS in Fig. 2 we arrive at the main result of this paper that there are the following correlations between the topology of the lines and and the properties of two-phase EoS:
-
-
The hardness of the high density EoS determines the maximum mass of the star, which is given by the line . Therefore is proportional to the parameter , where is the density of the transition to high density phase.
-
-
The onset of the phase transition line depends on the density and where is the density of the transition to the low density phase.
-
-
The curvature of the lines and is proportional to the compressibility of the high and low density phases, respectively.
Therefore, a verification of the existence of the critical lines and by observation of the rotational behavior of compact objects would constrain the parameters of the EoS for neutron star matter. Moreover, we have investigated different trajectories of rotating compact star evolution in the phase diagram in order to identify scenarios, which result in signatures of the deconfinement phase transition. To prove that the appearance or disappearance of a high density phase during the rotational evolution of the star could entail observational consequences for the angular velocity we consider three main representatives different classes of trajectories which could cross the critical line on phase diagram. These classes of tracks are: (a) spindown of isolated (non-accreting, ) pulsars due to magnetic dipole radiation [11, 15], (b) spin up in accreting systems with weak magnetic field [12, 16] (, vertical tracks) and (c) accretion either with strong magnetic field [16] or for accreting binaries emitting gravitational waves [17], for which (horizontal tracks). In the case of (a) the spindown or (b) spinup evolutions (in both cases ) the objects can undergo a phase transition if the baryon number lies within the interval , where is the end piont of the critical line . If the core of compact star is soft enough (as in case (SH-S)) the critical line crosses at some . This means that massive mono-phase configurations with total baryon number rotating with angular velocities in the interval should encounter a transition to a black hole during the spin down evolution. In those cases when the core EoS is harder (H-S-H and SH-H), the region of hybrid stars is a band which separates mono-phase configurations from black holes, see upper two panels of Fig. 2. As it has been shown in [15] for the vertical tracks (a) and (b) in the phase diagram, the braking index changes its value from in the region (iii) to in (iv). This is the braking index signal for a deconfinement transition introduced in Ref. [11]. The third evolutionary track is accretion with strong magnetic fields [16] and/or gravitational wave emission (horizontal tracks) [17].For this case the first decreases as long as the moment of inertia monotonously increases with . When passing the critical line for the phase transition, the moment of inertia starts decreasing and the internal torque term changes sign. This leads to a narrow dip for in the vicinity of this line. As a result, the phase diagram gets overpopulated for and depopulated for up to the second maximum of close to the black-hole line . A population gap in the phase diagram of compact stars is appears as a detectable indicator for hybrid star configurations.
3 Conclusion
We have shown that population clustering of compact stars at the phase transition line could be a signal for the occurrence of stars with high density matter cores and a measure for obtaining constraints on the EoS at high densities. In the case without a phase transition, the moment of inertia could at best saturate before the transition to the black hole region and consequently would also saturate. This would entail a smooth population of the phase diagram without a pronounced structure [18]. The so called Z sources of QPOs in LMXBs are suggested as objects which should predominantly populate the region of the suspected phase border between hadronic stars and quark core stars in phase diagram [15]. The existence of a population gap between the critical line and the black hole limit on the phase diagram is suggested as a signal for a phase transition at supernuclear densities in accreting compact stars [16]. The absence of a such gap does not exclude the existence of deconfined quark matter in LMXBs as we have shown in a study of accreting strange stars [18].
References
- [1] T. J. Hallmann, D. E. Kharzeev, J. T. Mitchell, T. Ullrich (Eds.), Quark Matter 2001: Proceedings, Nucl. Phys. 698 (2002).
- [2] D. Blaschke, F. Karsch, C. D. Roberts (Eds.), Understanding Deconfinement in QCD, World Scientific, Singapore (2000).
- [3] A. B. Migdal, E. E. Saperstein, M. A. Troitsky, D. N. Voskresensky, Phys. Rep. 192, 179 (1990).
- [4] J. A. Pons, S. Reddy, P. J. Ellis, M. Prakash, J. M. Lattimer, Phys. Rev. C 62, 035803 (2000).
- [5] G. E. Brown, Phys. Rep. 163, 3 (1988).
- [6] N. K. Glendenning, Compact Stars, Springer, New York (2000).
- [7] H. Heiselberg, H. Hjorth-Jensen, Phys. Rev. Lett. 80, 5485 (1999).
- [8] A. Bender, D. Blaschke, Yu. Kalinovsky, C. D. Roberts, Phys. Rev. Lett. 77, 3724 (1996).
- [9] D. Blaschke, P.C. Tandy, in [2], p. 218.
- [10] N. K. Glendenning, Phys. Rev. D 46, 1274 (1992).
- [11] N. K. Glendenning, S. Pei, F. Weber, Phys. Rev. Lett. 79, 1603 (1997).
- [12] N. K. Glendenning, F. Weber, in Physics of Neutron Star Interiors, D. Blaschke, N. K. Glendenning, A. Sedrakian (Eds.), Springer Lect. Notes Phys. 578, 305 (2001).
- [13] D. Blaschke, H. Grigorian, G. Poghosyan, in: Physics of Neutron Star Interiors, Lecture Notes in Physics 578, p.285, Springer, Berlin, 2001.
- [14] D. Blaschke, H. Grigorian, G. Poghosyan, [arXiv:astro-ph/0208332].
- [15] E. Chubarian, H. Grigorian, G. Poghosyan, D. Blaschke, Astronomy & Astrophysics 357 (2000) 968.
- [16] G. Poghosyan, H. Grigorian, D. Blaschke, ApJ 551 (2001) L73.
- [17] L. Bildsten, Astrophys. J. 501, L89 (1998).
- [18] D. Blaschke, I. Bombaci, H. Grigorian, G. Poghosyan, New Astronomy 7 (2002) 107.