Normalization of neutron-proton differential cross sections
Abstract
The differential cross section below 350 MeV neutron laboratory energy is studied using the energy-dependent Nijmegen partial-wave analysis PWA93. We analyze in detail three experiments, performed at LAMPF, at TRIUMF, and at the TSL facility in Uppsala. The issue of normalization of cross sections is discussed, where we distinguish between measured and calculated normalizations. This analysis leads to improved treatments of the LAMPF and TRIUMF data over PWA93. It is shown that the LAMPF and TRIUMF data at = 212 MeV are in good agreement with PWA93, that the LAMPF data at = 162 MeV is also in good agreement with PWA93, but that the Uppsala data at 162 MeV is in strong disagreement with PWA93. The reason for the disagreement is, almost certainly, a systematic flaw in the slope of the Uppsala data.
pacs:
PACS numbers: 11.80.Et, 13.75.Cs, 13.75.Gx, 21.30.-xI Introduction
The neutron-proton () differential cross section at neutron laboratory energies below 350 MeV has been a topic of frequent investigations. The relevant data base can be found in NN-OnLine [1] and in SAID [2]. One reason for the special interest in this cross section has been the suggestion made by G.F. Chew [3] in 1958 that the pion-nucleon coupling constant could be determined from the backward data.
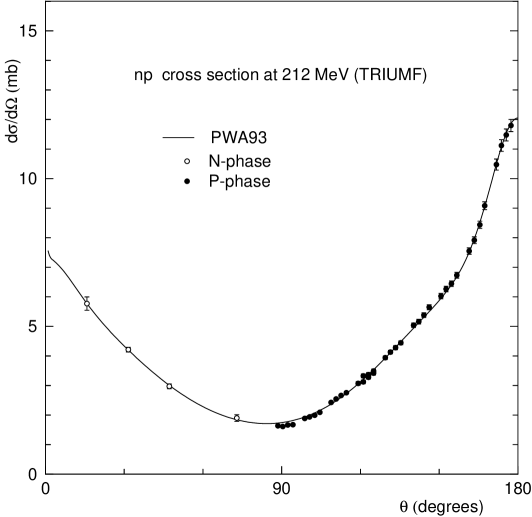
In Fig.1 we show the differential cross section at = 212 MeV as predicted by the energy-dependent Nijmegen partial-wave analysis PWA93 [4], together with absolutely normalized TRIUMF data [5]. The most distinctive features of this cross section are the forward peak, due to the destructive interference between neutral-pion exchange and the rest of the amplitude, and the backward peak, similarly due to the destructive interference between charged-pion exchange and the rest of the amplitude.
The measurement of an differential cross section is notoriously difficult. Especially the determination of the correct normalization often poses problems. These cross sections are most easily measured in the backward direction, because the then forward-going recoil protons have in that case a relatively high energy. In order to cover a larger angular region, often several different settings of the detection apparatus are used. The differential cross section is then measured in different, sometimes overlapping, angular regions. The data base [1, 2, 4] with MeV contains a number of such data sets [5, 6, 7, 8, 9].
In this paper we will analyze mainly the backward cross section data, where we will focus in particular on the way the data sets are normalized. We will study how the sets in different angular regions are normalized ‘relative’ to each other, and how the ‘absolute’ normalizations of the various cross sections are obtained. Sometimes these normalizations (relative or absolute) are actually measured [5, 6], we speak then of ‘measured’ normalizations, but in other cases these normalizations are determined via some model calculation [7, 8, 9], we speak then of ‘calculated’ normalizations. This has consequences for the way the data sets should be treated in partial-wave analyses (PWA’s) of scattering data [1, 2, 4, 10, 11, 12]. ‘Measured’ normalizations are experimental data with an associated error and must be included in the data base. ‘Calculated’ normalizations are not experimental data and therefore should not be included in the data base. In PWA’s calculated normalizations should be floated. Therefore, it would be helpful if the experimentalists would clearly indicate if the normalizations they use are actually measured or merely calculated. ‘Calculated’ normalizations depend on the model used to determine these normalizations. Energy-dependent PWA’s are especially well suited to determine these calculated normalizations. At this moment the Nijmegen partial-wave analysis PWA93 [1, 4] is probably one of the best tools to obtain them. Since we use PWA93 we are restricted to data sets with MeV.
We will study in this paper in detail three different experiments. One of the most important data sets was measured at LAMPF [6]. Next, there is an experiment done at TRIUMF [5], and another one performed at the TSL facility in Uppsala [7, 8, 9]. We will concentrate our efforts on two neutron laboratory energies: 162 MeV and about 212 MeV. The reason for this is that at 162 MeV there are two data sets (LAMPF and Uppsala) available, while at 211.5 MeV there is a set from LAMPF and at 212 MeV a set from TRIUMF. These data sets can then be compared via our PWA93. The LAMPF and TRIUMF data sets were included in PWA93 and in general both sets were fitted very well in this partial-wave analysis. However, it turned out to be impossible for us to get a satisfactory fit to the later measured Uppsala data set, despite large efforts [13, 14] from our side. The reason resides in systematic discrepancies between the Uppsala data and PWA93, which represents in a kind of averaged way the world data base.
This paper is neither a study of all data, nor a study of all differential cross sections. It is a study of the manner in which differential cross sections could be normalized. We consider three different cases, each with its own specific way of normalization. We hope to convince the reader of the high accuracy that can be reached by PWA’s when normalizing differential cross sections.
In Section II we will discuss the various data sets and the way in which they were treated in or with the Nijmegen PWA93. We will allow only the absolute normalization to be adjusted to the data. In Section III we will allow also the relative normalization between the various subsets to be adjusted. This leads to significantly improved fits in all cases considered. Finally, in Section IV we will summarize our conclusions.
II Experimental data and absolute normalization
For each differential cross section the absolute normalization is denoted by and its error by . When this is a measured normalization these numbers are used in the PWA. In PWA93 [4] each differential cross section contributes to as
| (1) |
where is the value of the measured differential cross section with its error. We need to sum over all data points of the data set. In case the absolute normalization has not been measured, but is just a calculated or even a floated normalization, this normalization should not contribute to . This is easily achieved in practice by assigning a very large value to .
A The LAMPF data
At LAMPF [6] a neutron beam with a continuous spectrum was obtained by passing an 800 MeV proton beam through an aluminum production target. This neutron beam was directed on a liquid-hydrogen scattering target. The recoiling protons were detected with a magnetic multiwire proportional chamber (MWPC) spectrometer. The proton laboratory angle varied from 0∘ to about 30∘. The experimental data was divided into 30 MeV/c wide bins for the laboratory momentum of the incident neutrons. These bins were centered in 30 MeV/c steps ranging from 575 MeV/c to 1385 MeV/c. An extra bin was centered at 1429 MeV/c, which contains the data with 1400 MeV/c. This results in a total of 29 energy bins from 162 MeV to about 700 MeV, where 11 of these bins have a central laboratory energy below 350 MeV.
The absolute normalizations of the differential cross sections at the lowest 7 energies were floated. For neutron energies larger than 280 MeV the differential cross sections were absolutely normalized with the help of the simultaneously detected deuterons from the reaction . Via charge independence this reaction is related to the well-known reaction . The overall accuracy of this measured normalization is in the range of 5 to 10%.
Because we want to compare the data with PWA93 we can use only 11 of these 29 cross sections. The results are presented in Table I. In the analysis for PWA93 the data set at 194.5 MeV consisting of 42 data had = 76. This is too large, indicating a more than 3 standard deviation (s.d.) discrepancy. Also the data point at 131.51∘ in the 344.5 MeV set had a too high . Therefore, the data set at 194.5 MeV and the single data point at 344.5 MeV and 131.51∘ were not included in the final data base for PWA93. In the analysis presented here we returned this data in first instance back into our data base. When the analysis was done we noticed that the for the data point at 344.5 MeV and 131.51∘ was still too large. This data point was therefore again removed from the data set.
The 11 differential cross sections contain in total 650 data. After removing the data set at 194.5 MeV and the single data point at 344.5 MeV the data set for PWA93 consisted of 607 points. For these 607 data we expected . We reached , which indicates a good fit. In PWA93 we could determine the absolute normalization of each of the differential cross sections with an accuracy of 0.7% or better. For the sets with 280 MeV the accuracy was even 0.5% or better; see Table I. This is about a factor of 10 to 20 better than the absolute normalizations measured with the help of the reaction . Most of the uncertainties in the calculated absolute normalizations of these data sets comes from the statistical errors in the individual data points. The uncertainty due to the error in our knowledge of the total cross section is much less.
In Fig. 2 we show the difference between the absolutely normalized LAMPF data at 162.0 MeV and PWA93. In Fig. 3 the same is done for the 211.5 MeV data. Several things can be noticed in these Figures. First of all, we see that the data sets can be divided into 7 non-overlapping subsets, each covering a small () angular region. We number these subsets 1 to 7, starting at the smallest neutron angle. Because we have for each energy only 1 overall normalization available we cannot optimally normalize these individual subsets. For the 162 MeV data we see that set 1 (5 points around 124∘) and set 7 (3 points around 177∘) would prefer a larger normalization. When we decrease the normalization of set 6 (6 points around ), 5 points from this set obtain a more satisfactory agreement with PWA93, but the point at 174.32∘ will fit even worse. In our final fit the latter point will be more than 3 s.d. off. We will therefore remove this point already now from our data set. The fit with the remaining 42 data at 162.0 MeV has with .
B The TRIUMF data
At the TRIUMF fast-neutron facility scattering cross sections were measured between 200 MeV and 500 MeV [5]. The neutrons were produced in a liquid-deuterium production target by the inclusive reaction . The quasi-elastic neutrons were used for the analysis. The neutrons produced in the forward direction were collimated on a liquid-hydrogen scattering target.
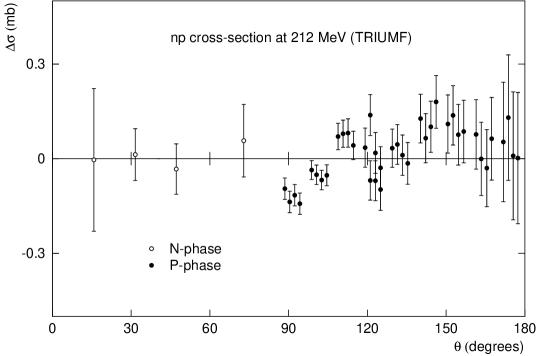
In the ‘N-phase’ of the experiment the neutrons scattered in the forward direction were detected by a carbon plate. The absolute normalization was measured and was said to have a 2% uncertainty. The differential cross section of the scattered neutrons at 212 3 MeV was measured at 4 angles in this N-phase. In Fig. 4 we show the difference between the differential cross section, again normalized by us, and PWA93. The forward data (N-phase) agrees very well with PWA93. The fit is a little too good, indicating that the point-to-point errors are probably not completely of statistical origin. In PWA93 we obtained with for these 4 data points. At 319 3 MeV 7 data points were measured in the N-phase. In PWA93 these 7 points had with .
In the ‘P-phase’ of the experiment the recoil protons were detected either in a magnetic spectrometer or, at the lowest recoil energies, in a thick scintillation counter. At each setting of this spectrometer (or scintillation counter) 4 data points were measured covering a proton angular region in the laboratory of about 4∘, corresponding to a neutron angular region in the center-of-mass system of about 8∘. The absolute normalization in the P-phase was measured with a 3.2% uncertainty.
The differential cross section of the recoil protons at 212 MeV was measured at 39 points in this P-phase; see Fig. 4. This data consists of 9 subsets of 4 data points and 1 subset of 3 points, because the subset at 122∘ had an additional 3 data points measured. The differences between these 2 subsets, measured at different times, is an indication of the accuracy with which the flux of the incident neutron beam could be monitored. It is striking that the statistical fluctuations within each subset of 4 points are smaller than the point-to-point errors indicate. It is clear from Fig. 4 that the subsets at 91∘ and 101∘ can be made to fit excellently, if we are allowed to change the normalization from subset to subset.
In PWA93 these 39 data points had with , while we expected . Closer scrutiny showed that the set of 4 data points around (neutron angles 88.57∘, 90.45∘, 92.34∘, and 94.29∘) contributed 52 to this high value of . We therefore omitted these 4 points from the data set. For the remaining 35 points we reached then the value =44 with , which is quite satisfactory. At 319 MeV the P-phase of the experiment measured 64 data points. In PWA93 these 64 points were fitted with and . Also this is a reasonable fit.
The measured absolute normalizations agree very well with the absolute normalizations calculated by us, except for the N-phase at 319 MeV, where the measured normalization appears to be 8.3%, that is 4 s.d., too high. Our calculated normalizations have a small error. For the N-phase our error is 1.2%, compared to 2% for the measured normalization, and for the P-phase our error is 0.4%, which must be compared to 3.2% for the measured normalization.
C The Uppsala data
At the neutron beam facility at the The Svedberg Laboratory (TSL) in Uppsala the differential cross section was measured at two energies: 96 MeV and 162 MeV. In this paper, we will focus our attention on the 162 MeV data [7, 8, 9]. The neutrons for this reaction were produced by the 7Li()7Be reaction at 0∘. This gave a quasi-monoenergetic neutron beam together with an almost flat low-energy tail. The target consisted of 5 CH2 sheets and 2 carbon sheets interspaced by MWPC’s. The MWPC’s were necessary to determine in which sheet the reaction took place. The carbon sheets were included to measure simultaneously the protons produced on carbon, because the proton production from the carbon nuclei in CH2 needed to be subtracted. The recoil protons were detected in a magnetic spectrometer consisting of a dipole magnet and four drift chambers. In each run the magnetic spectrometer had an angular acceptance of about 15∘. Five different settings of the spectrometer position were chosen to cover the angular range of to 54∘ for the recoil proton. This guaranteed a large angular overlap between the different settings. The relative normalizations between these 5 different angular sets, are calculated normalizations. After the sets were relatively normalized, the data in the overlap regions was averaged point by point. In this way the relative differential cross section between 72∘ and 180∘ was obtained. Next, this relative cross section needed to be absolutely normalized. The integrated cross section in the interval from to is defined by
| (2) |
For the absolute normalization the Uppsala group used the average over several PWA’s of
| (3) |
where is the unnormalized integrated cross section as determined in Uppsala and is the total cross section at 162 MeV. For PWA93 the last fraction on the right-hand side of Eq. (3) is 0.995. This indicates clearly that the absolute normalization factor is essentially the first fraction on the right-hand side of Eq. (3). It shows the importance of the PWA’s in obtaining the calculated absolute normalization of this data.
A few critical remarks can be made about this calculation. First of all, in determining at 162 MeV the Uppsala group did not make use of all available relevant experimental data, and, moreover, the data they did use, was not renormalized. It is striking that the Uppsala group used an interpolated value for the total cross section calculated by themselves, instead of using a value determined in one of the standard PWA’s. Secondly, their way of normalizing does not take account of the measured accuracy of each individual data point. The data points are instead weighted by the factor . A -fit to the differential cross section over the measured interval of a PWA would have been more appropriate. Finally, the Uppsala group has made a big issue of the fact that their differential cross section is different from the PWA’s. But then there is no good reason to assume that their integrated cross section is the same as in the PWA’s. This conclusion casts doubts on their method of normalization. Despite these critical remarks, we think that their calculated absolute normalization is numerically not unreasonable.
In Fig. 5 we show the difference between the differential cross section, normalized by us, and PWA93. Comparison with PWA93 gives for the 54 data and . For 54 data one would expect . Our result is 33 s.d. away from this expectation value, which is an unbelievable large discrepancy. This data set will therefore not be included in our data base for PWA. The reason is not that a large value for the for this data set will give a larger value for the /data point for the whole data base, but such a large value is so unlikely, that our data base would not be a Proper statistical ensemble anymore, when we would include this data set.
We have studied these 162 MeV Uppsala data in more detail. The first time this was done [14] with the originally published data set [7] of 31 data points between 119∘ and 180∘. In a PWA one expects for 31 points the value . PWA93 with a data base of 2514 data gave = 292 for these 31 data with the normalization = 0.9820. When we included the 31 data in the data base and did a refit the on the 31 data dropped with 27.6, while at the same time the on the rest of the data set increased by 7.4. The difference with the expectation value amounts to 29 s.d. The Virginia Tech PWA [15] gives similar huge values for the . Such large values for the for only 31 data are statistically so unlikely that something must be wrong. The Uppsala group has always pointed to the LAMPF data as the culprit and claims [9] that this data dominates our solution and also the SAID solution. To study this claim we omitted all the LAMPF data [6] from our data base and included the 96 MeV and the 162 MeV Uppsala data. Performing a PWA on this data set gave for the 31 data at 162 MeV = 246. This amounts to a 27 s.d. error and is therefore not much of an improvement. It shows clearly that the claim [9], that our data base is dominated by the LAMPF data, is incorrect. Moreover, it shows that the Uppsala differential cross section is in conflict not only with the LAMPF cross sections, but also with the rest of the data base, including asymmetries, spin correlations, etc.
At that time, we had available in Nijmegen the first PWA [10] of the data alone, in which no input from scattering was used. This -PWA94 was moreover different from PWA93, because it went up to 500 MeV and therefore also inelasticities were included. For these reasons, we used also this -PWA94 [10] of 3964 data below 500 MeV to study the Uppsala data. It gives for the 31 data the value = 293. When we include the 31 data in the data base and refit, the for these 31 points drops with 80, while the on the rest increases by 34.7. Finally, we dropped all 1482 differential cross sections with from the data base. Performing next a PWA on this reduced data base gave = 174 for the 31 data points, which corresponds to an 18 s.d. discrepancy. The isovector phases are in this -PWA94 determined by the data and not by the more accurate data. This allows for more freedom in the isovector phases when fitting the data. As a consequence a much larger drop in is possible than in the PWA93 case. However, we still see that all values are very far away from the expectation value . This proves once more that the 31 Uppsala data are in conflict, not only with the LAMPF differential cross section data, but also with the other data, including spin data, contained in the Nijmegen and SAID data bases. The same conclusions can be drawn for the more complete set of 54 data [9].
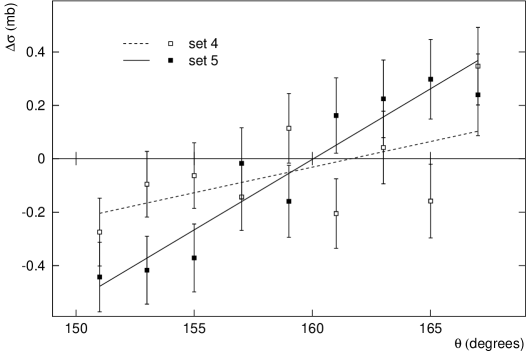
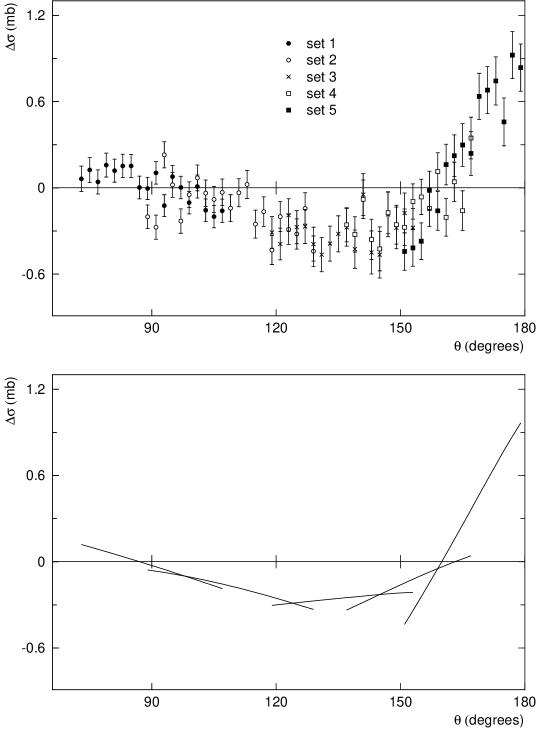
A first hint why the Uppsala data produces such a large value of can be obtained when we look at the data in the overlap region between sets 4 and 5, see Fig. 6. This overlap region runs from 151∘ to 167∘ and contains from each set 9 points. In Fig. 6 we plot the difference . For each data set the function is fitted by a straight line . These fits are statistically quite acceptable. For set 4 = 10.3 and for set 5 = 4.2. In both cases 9 points were used in the fit. For the slopes of the sets 4 and 5 we find = 0.019(9) and = 0.053(9). We see that both slopes are different from 0, therefore the slopes do not agree with PWA93. Especially the slope of set 5 in this overlap region is almost 6 s.d. away from the slope predicted by PWA93. We believe that this is too large a difference to be acceptable.
¿From Fig. 6 we see that these straight lines cross each other at 159∘, which is the middle of the overlap region. This is in agreement with the fact that the Uppsala group took the relative normalization between the sets such, that in the overlap region the differential cross section is as much as possible continuous. They could not require that the slope was also continuous. The slopes and of set 4 and 5 in the overlap region turn out to be rather different. We find = 0.034(13). This is a surprising result, since the difference should be consistent with zero. We think that 2.6 s.d. is too large a difference to be called ‘consistent with zero.’ Therefore, in the overlap region the sets 4 and 5 appear to be in disagreement with each other [16].
III Relative normalizations
In this Section we will look in more detail at the way the relative normalizations in the various data sets are performed, and we will point out the way we think these relative normalizations could be done. It is remarkable that for the various data sets under consideration in this paper each one requires a different treatment of the relative normalization.
A The LAMPF data revisited
In the LAMPF experiment the whole angular region from proton laboratory angle 0∘ to about 30∘ was covered by 7 different settings of the central angle of the spectrometer. Simultaneously the incident neutron flux on the liquid-hydrogen target was measured. This allowed the LAMPF group to determine experimentally the relative normalizations of these 7 angular sets. For the lower energies ( MeV) the angular sets belonging to different central settings can be clearly identified. For the higher energies ( MeV) these angular sets started to overlap. At present, it is not possible anymore to disentangle these overlaps [17]. Therefore, we will divide the LAMPF set of data at 11 energies with MeV into two groups. The group LAMPF-I contains the data at the 7 energies from = 162 MeV to = 266 MeV for which the angular sets can still clearly be identified, while the group LAMPF-II contains the data at those energies for which the central angular settings cannot uniquely be recovered anymore.
The group LAMPF-II contains 312 data and is fitted with = 327. In PWA93 the 4 absolute normalizations at the 4 different energies from = 284.8 MeV to = 344.3 MeV were determined. The results are displayed in Table II. The expectation value is . This shows that in PWA93 the fit to the group LAMPF-II is quite good. We emphasize again the high accuracy with which these calculated absolute normalizations could be determined in PWA93.
The group LAMPF-I contains 337 data. As pointed out before, in PWA93 the data set at 194 MeV with 42 data points was removed from the data base, because it had a too high . We were therefore left with 295 data. This gives the expectation value . In PWA93 we obtained = 303. When we now restored these 42 data points back into the data base, and analyzed the group LAMPF-I, we found that the datum at 162 MeV and the neutron angle of 174.32∘ was more than 3 s.d. off. Therefore, we removed this point from our data set and redid the analysis, now with 336 data points. When we fit only the 7 absolute normalizations , we expect and we obtain = 373.
Next, we introduced relative normalizations , with going from 1 to 7, for each of the 7 central angular settings of the magnetic spectrometer. Here = 1 corresponds to the largest proton angle and therefore the smallest neutron angle, while = 7 is the most backward direction. We normalize = 1. In the experiment these relative normalizations were measured with an error . The exact value of is at present unknown, but probably it was of the order of 1% or less [17]. In our analysis we tried 4 values: 0%, 0.5%, 1.0%, and floated. The value of 0% corresponds to PWA93, where we did not try to study these relative normalizations, so we took exactly the values as given by the experimentalists, with no errors. Thus, the relative normalization in that case was 1.0 0.0. Next to these relative normalizations of the different central angular settings there are of course the absolute normalizations , with going from 1 to 7. Here = 1 corresponds to the lowest energy 162.0 MeV. The contribution to of the differential cross sections with their errors is given by
| (4) |
while the contribution to of the absolute and relative normalizations is
| (5) |
In Table III the -values for the different cases are presented together with the number of data per energy and the number of degrees of freedom. In Table IV we present the relative and absolute normalizations. Our conclusion from Table III is that the case of 1% relative normalization error turns out to be quite good. It is an improvement over PWA93 of 30 in the value of , and of 36 in the value of . What is more important is what happens to the 194.5 MeV data. For these 42 data points the 3 s.d. rule requires that , In the original PWA93 we obtained for this data . This meant that this set had to be removed from the PWA93 data base. In the present analysis we obtain , which is significantly below the 3 s.d. limit and therefore we can keep this set. For the 162 MeV data we see that the drops from 63 for 43 points in PWA93, to 56 for 42 points in the same PWA93, and to 48 for these 42 points when we take the relative normalizations with 1% error into account. This shows that this 162.0 MeV data appears to be quite good. For the 43 data at 211.5 MeV the drop in is from 31 to 27 when we take the relative normalizations with 1% error into account. Thus also this 211.5 MeV data appears to be quite good.
In PWA93 we included 607 of the 650 LAMPF data and obtained with . In the present analysis we included 648 of this LAMPF data and obtained with . The improvement in quality of the present analysis over PWA93, due to the introduction of the relative normalizations, is seen in the fewer data omitted from the data set (2 versus 43) and in the better -ratio (1.025 versus 1.038).
B The TRIUMF data revisited
In PWA93 we discarded the 4 most forward points (neutron angles) of the P-phase of the experiment at 212 MeV. These correspond to the most backward proton angles and therefore to the lowest energies of the recoil protons. These angles are the hardest ones to measure, and it is therefore understandable that these points suffer from the largest systematic errors. Before we study the relative normalizations, we will reinstate these 4 most forward points to the data set. This data set contains then 10 subsets. When we assume the error in the relative normalizations to be very large, i.e. we float these relative normalizations, we obtain on this data. The expected value is and the lower 3 s.d. limit is 12.2. We see that the has become too low, hence in this case this data should be discarded. The reason for this is that the point-by-point errors are not purely statistical, but contain systematic components.
When we assume a relative normalization error of 0.5% and an absolute normalization error of 0.2%, we obtain and . However, looking in more detail at the results we see that the group of 4 most forward data contributes 26.9 to . Therefore, we should float the relative normalization of only this subset. Then we obtain and . The most forward subset of 4 data contributes now only 1.0 to this value of . The 3 s.d. lower limit for the expectation value of is in this case 18.9. The data is therefore statistically acceptable.
What have we gained by taking account of the relative normalizations? First of all, we do not have to discard the most forward subset when we allow the relative normalization of this subset to float. Thus, instead of 35 data in PWA93 we can now use all 39 data of the P-phase. Secondly, we reach now the value for these 39 points, while in PWA93 we reached for 35 points.
C The Uppsala data revisited
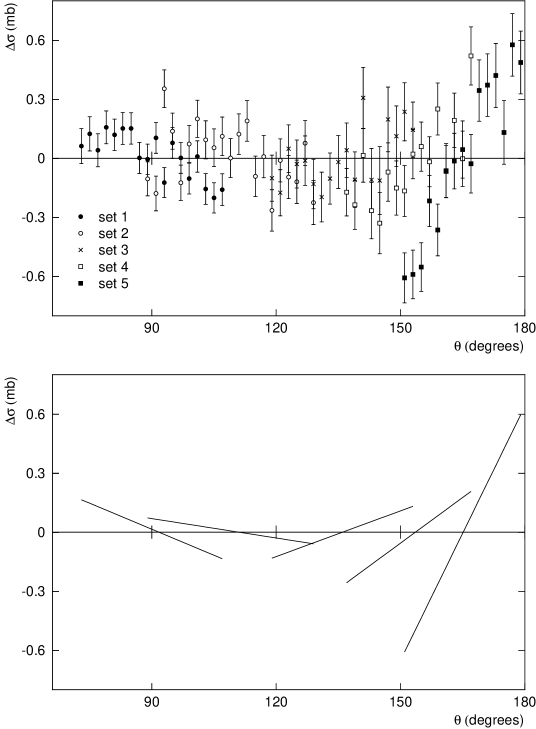
Let us start with studying the individual Uppsala data sets , where , each covering a different angular region. In Fig. 7 to Fig. 11 we plot for each set the difference , where we used PWA93. For each individual data set the value of is given in Table V, together with the calculated absolute normalization and the number of data points . The expectation value for of these sets is approximately . For the 3 s.d. upper bound we actually do not use this formula, but we use an exacter formula, which produces a slightly larger value. The -values of the sets 2, 4, and 5 are more than 3 s.d. away from their expectation values, while set 1 is almost 3 s.d. away and only set 3 has an acceptable -value. Using the 3 s.d. rule we must certainly omit 3 of the 5 sets from the data base. Because the of one of the remaining two sets is also large, it is perhaps advisable to disregard the complete Uppsala data set.
To understand better what is going on, we fitted for each individual data set a straight line through the points of the set. The values for , , and for the straight-line fits are also given in Table V. There is a dramatic improvement in over for the sets 1, 4, and 5. This indicates very large systematic deviations from PWA93 in these 3 data sets. The slopes of these 3 individual data sets disagree strongly with the slopes predicted by PWA93. The straight-line fit to set 2 did not show a marked improvement in the value of . The unacceptably high value for in set 2 indicates that this set should certainly be removed from our data set. The straight-line approximation gives also a definite improvement in the -value of set 3. This indicates that also this set is perhaps infected with systematic effects. Looking at all this we come to the conclusion, that it is perhaps best to disregard all the Uppsala data.
Let us now come to the relative normalization of these data sets in the case that the data is not discarded. In our PWA, we would determine for each individual data set separably an absolute normalization. We have then 5 separate calculated absolute normalizations and no relative normalizations. The result is plotted in Fig. 12. We have also plotted the straight-line approximations to the sets. ¿From Table V we see that for the complete data set we have 88 points with with respect to PWA93. For the expectation value of we find . We could reduce this improbably high value of by omitting individual data points with too high (more than 3 s.d.) values of , that is, omitting so-called outliers. This is an acceptable procedure when these outliers are isolated events. caused by unexplained errors in the measurement. In this case, however, it is not acceptable, because these outliers are caused by systematic effects.
Finally, let us look at the way the relative normalizations were determined by the Uppsala group. We demonstrate this with the straight-line approximations to the individual data sets. We require these straight lines to intersect in the middle of each overlap region. In this way a more-or-less continuous, unnormalized differential cross section is obtained. This unnormalized cross section needs to be absolutely normalized. The result is plotted in Fig. 13. For the original set of 88 points as given by the Uppsala group and as plotted in Fig. 13 we find that .
In this Subsection we have shown that the Uppsala data contains unexplained large systematic deviations from PWA93. The manner in which the Uppsala group performed the relative normalization of their data enhanced the negative effects of these systematic deviations. We found that the value of for these Uppsala data can be reduced from the unacceptably high value of 470 to the much better, but still unacceptably high, value of 257 by just applying another way of relative normalization of this data. Because of the large systematic deviations from PWA93 we cannot prune the data by omitting outliers. This means that, in this way, we cannot reduce the value of any further and that therefore we must omit the Uppsala data set from the data base.
IV Conclusions
We have shown that a more careful study of the relative normalization of differential cross sections leads to a significantly improved treatment of this data. The improvement shows up in several ways. First, less data needs to be discarded in this analysis compared to PWA93 in order to comply with the 3 s.d. rule. For the LAMPF data we need to omit only 2 data points instead of the 43 data points in PWA93. From the TRIUMF data at 212 MeV we could keep all data now, while in the PWA93 one needed to omit 4 data points. We were, in this manner, unable to improve the fit to the Uppsala data so much, that this data becomes acceptable. Secondly, the introduction of relative normalizations, which are fitted to the data, leads to a definite improvement in the values of . For the LAMPF data below 350 MeV we find an improvement in from 1.038 to 1.025, for the P-phase of the TRIUMF data at 212 MeV we see an improvement in from 1.26 to 0.76, and for the 88 Uppsala data at 162 MeV we see an improvement in from 5.34 to 2.92. We would like to point once more to the accuracy with which the relevant normalizations can be determined. Depending on the data set this runs from 0.4% to 0.8%. We would like to recommend to the experimentalists, that when it is too difficult and/or too expensive to determine the absolute normalization for their data, they should consider measuring the unnormalized differential cross section anyway and leave the normalization to the PWA’s. This could save them a lot of headaches.
Acknowledgements.
First of all we thank Dr.R.A.M. Klomp for his contributions in the very beginning of this work. We thank B.E. Bonner for clarifying communications about the LAMPF data, D. Axen and D.F. Measday for helpful discussions regarding the TRIUMF data, N. Olsson for sending us the Uppsala data, and Th.A. Rijken for helpful discussions. Finally, we thank J. Blomgren for his enlightening e-mail. The research of R.T. was made possible by a fellowship of the Royal Netherlands Academy of Arts and Sciences (KNAW).REFERENCES
- [1] Nijmegen NN-Online Facility, see on WWW, http://NN-OnLine.sci.kun.nl.
- [2] VPI/GWU SAID Facility, see on WWW, http://gwdac.phys.gwu.edu.
- [3] G.F. Chew, Phys. Rev. 112, 1380 (1958).
- [4] V.G.J. Stoks, R.A.M. Klomp, M.C.M. Rentmeester, and J.J. de Swart, Phys. Rev. C 48, 792 (1993).
- [5] R.K. Keeler, R. Dubois, E.G. Auld, D.A. Axen, M. Comyn, G. Ludgate, L.P. Robertson, J.R. Richardson, D.V. Bugg, J.A. Edington, W.R. Gibson, A.S. Clough, N.M. Stewart, and B. Dieterle, Nucl. Phys. A377, 529 (1982).
- [6] B.E. Bonner, J.E. Simmons, C.L. Hollas, C.R. Newsom, P.J. Riley, G. Glass, and M. Jain, Phys. Rev. Lett. 41, 1200 (1978).
- [7] T.E.O. Ericson, B. Loiseau, J. Nilsson, N. Olsson, J. Blomgren, H. Condé, K. Elmgren, O. Jonsson, L. Nilsson, P.-U. Renberg, A. Ringbom, T. Rönnqvist, C. Tibell, and R. Zorro, Phys. Rev. Lett. 75, 1046 (1995).
- [8] J. Rahm, Ph.D. thesis, Uppsala University, 1997.
- [9] J. Rahm, J. Blomgren, H. Condé, S. Dangtip, K. Elmgren, N. Olsson, T. Rönnqvist, R. Zorro, A. Ringbom, G. Tibell, O. Jonsson, L. Nilsson, P.-U. Renberg, T.E.O. Ericson, and B. Loiseau, Phys. Rev. C 57, 1077 (1998).
- [10] R.A.M.M. Klomp, J.-L. de Kok, M.C.M. Rentmeester, Th.A. Rijken, and J.J. de Swart, contribution to the XIVth International Conference on Few-Body Problems in Physics, Williamsburg, USA, May 26-31, 1994; Nijmegen preprint THEF-NIJM 94.04. This analysis was performed by R. Klomp.
- [11] M.C.M. Rentmeester, R.G.E. Timmermans, and J.J. de Swart, in preparation.
- [12] R.A. Arndt, I.I. Strakovsky, and R.L. Workman, Phys. Rev. C 62, 034005 (2000).
- [13] M.C.M. Rentmeester, Nucl. Phys. A631, 431c (1998).
- [14] M.C.M. Rentmeester, R.A.M. Klomp, and J.J. de Swart, Phys. Rev. Lett. 81, 5253 (1998).
- [15] R.A. Arndt, I.I. Strakovsky, and R.L. Workman, Phys. Rev. C 50, 2731 (1994).
- [16] Despite their awareness [18] of this large discrepancy in the slopes, the authors of Ref. [9] state: “The agreement in the overlapping regions is generally very good.”
- [17] B.E. Bonner, private communication.
- [18] Private communication to N. Olsson, July 1995; N. Olsson, presentation at the XVth International Conference on Few-Body Problems in Physics, Groningen, The Netherlands, July 22-26, 1997.
| (MeV) | removed | |||
|---|---|---|---|---|
| 162.0 | 1.092(7) | 63 | 43 | |
| 177.9 | 1.083(7) | 47 | 44 | |
| 194.5 | 1.078(7) | 76 | 42 | all |
| 211.5 | 1.063(7) | 31 | 43 | |
| 229.1 | 1.058(7) | 65 | 49 | |
| 247.2 | 1.042(7) | 39 | 53 | |
| 265.8 | 1.029(6) | 59 | 63 | |
| 284.8 | 1.053(5) | 80 | 73 | |
| 304.2 | 1.003(4) | 80 | 79 | |
| 324.1 | 1.057(5) | 92 | 81 | |
| 344.3 | 1.036(5) | 84 | 80 | 131.51∘ |
| total | 716 | 650 |
| (MeV) | |||
|---|---|---|---|
| 284.8 | 1.053(5) | 80 | 73 |
| 304.2 | 1.003(4) | 80 | 79 |
| 324.1 | 1.057(5) | 92 | 81 |
| 344.3 | 1.035(5) | 75 | 79 |
| total | 327 | 312 |
| (MeV) | 0% | 0.5% | 1% | floated | |
|---|---|---|---|---|---|
| 162.0 | 56 | 50 | 48 | 47 | 42 |
| 177.9 | 47 | 41 | 39 | 38 | 44 |
| 194.5 | 76 | 68 | 64 | 61 | 42 |
| 211.5 | 31 | 28 | 27 | 27 | 43 |
| 229.1 | 65 | 62 | 62 | 62 | 49 |
| 247.2 | 39 | 39 | 40 | 42 | 53 |
| 265.8 | 59 | 56 | 57 | 59 | 63 |
| 373 | 344 | 337 | 336 | ||
| 9 | 6 | 0 | |||
| 373 | 353 | 343 | 336 | ||
| 329 | 329 | 329 | 323 |
| 0% | 0.5% | 1% | floated | |
|---|---|---|---|---|
| 1.0 | 1.005(4) | 1.011(7) | 1.018(8) | |
| 1.0 | 1.003(4) | 1.005(6) | 1.007(6) | |
| 1.0 | 0.997(4) | 0.996(6) | 0.996(5) | |
| 1.0 | 1.000(4) | 1.000(7) | 1.000(7) | |
| 1.0 | 0.999(4) | 0.998(6) | 0.997(6) | |
| 1.0 | 0.992(4) | 0.987(6) | 0.984(5) | |
| 1.0 | 1.011(3) | 1.015(5) | 1.018(4) | |
| 1.089(6) | 1.085(6) | 1.083(6) | 1.081(6) | |
| 1.083(7) | 1.080(7) | 1.078(6) | 1.077(6) | |
| 1.078(7) | 1.075(7) | 1.073(6) | 1.071(6) | |
| 1.063(7) | 1.061(6) | 1.059(6) | 1.058(6) | |
| 1.058(7) | 1.055(6) | 1.053(5) | 1.052(5) | |
| 1.042(7) | 1.039(6) | 1.038(5) | 1.036(5) | |
| 1.029(6) | 1.026(6) | 1.024(5) | 1.023(5) |
| set | (data) | |||||
|---|---|---|---|---|---|---|
| 1 | 18 | 38 | 15 | 1.000(8) | 0.81(17) | 0.0088(19) |
| 2 | 21 | 49 | 46 | 1.051(7) | 0.37(19) | 0.0033(18) |
| 3 | 18 | 18 | 12 | 1.062(6) | 1.05(41) | 0.0077(31) |
| 4 | 16 | 35 | 16 | 1.017(5) | 2.37(55) | 0.0155(36) |
| 5 | 15 | 117 | 10 | 0.974(4) | 7.10(70) | 0.0430(43) |