Semiempirical Shell Model Masses with Magic Proton Number
Z = 126 for Translead Elements***Contribution to the 2nd Euroconference on Atomic Physics at Accelerators: Mass Spectrometry, Cargèse, 19-23 September 2000.
S. LIRAN†††Present address: Kashtan 3/3, Haifa 34984, Israel, A. MARINOV and N. ZELDES
The Racah Institute of Physics, The Hebrew University of Jerusalem,
Jerusalem 91904, ISRAEL
Abstract
A highly extrapolatable semiempirical shell model mass equation applicable to translead elements up to Z = 126 is presented. The equation is applied to the recently discovered superheavy nuclei and 289114 and their decay products.
I Introduction
A recent experiment [1] is consistent with the formation of the nucleus 293118 and its sequential decay down to 269Sg (Z = 106). The -decay energies vary rather smoothly along the chain, precluding the traditional macroscopic-microscopic [2, 3] Z = 114 as a major magic proton number in these nuclei. Recent phenomenological studies of B(E2) [4] and Wigner term [5] systematics indicate Z = 126 as a plausible next spherical proton magic number after lead. Recent self-consistent and relativistic mean field calculations [6, 7, 8] variously predict proton magicities for Z = 114, 120, 124 and 126, depending on the interaction used.
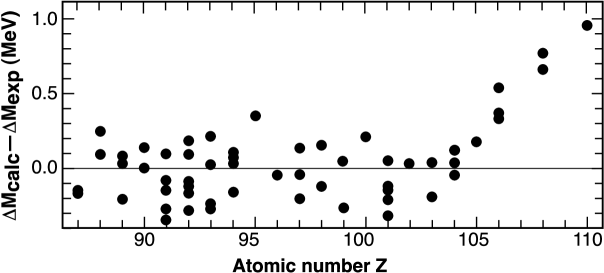
Contrary to most of the above findings, the semiempirical shell model mass equation (SSME) [9] is based on the assumption that Z = 114 is the next proton magic number after lead, and it stops there. Moreover, the quality of its agreement with the data starts deteriorating already beyond Hs (Z = 108). (See fig. 1, and fig. 4 of ref. [1].) One has to find a substitute for the equation in the neighbourhood of Z = 114 and beyond.
In the early stages of developing the SSME [10] both Z = 114 and Z = 126, then considered possible alternative candidates for the postlead proton magic number, were tried as an upper shell-boundary for translead elements. The agreement with the data was about the same for both choices, and considering the prevailing view in the mid nineteen-seventies Z = 114 was chosen for the SSME mass table. We have recently [11] established a high predictive power of the early Z = 126 results in the interior of the shell region with Z 82 and 126 N 184 (called here region B) by comparing them to the newer data measured since then, and proposed using them as a substitute for the SSME [9] in superheavy elements (SHE) research. We have also [12] established a high predictive power for values of the early Z = 126 results in the interior of the shell region with 82 Z, N 126 (called region A). However, the quality of the predicted masses and other mass differences worsened much compared to that of the original adjustment. Therefore we readjusted the coefficients which largely cancel in , and proposed using the resulting equation as a substitute for the SSME [9] in the interior of region A.
In sect. 2 we give the Z = 126 equation in the two regions and briefly discuss its predictive power. In sect. 3 we apply and comment on it in relation to SHE research in region B.
II The Mass Equation and its Extrapolatability
In the SSME the total nuclear energy E is written [9, 13] as a sum of pairing, deformation and Coulomb energies:
| (1) |
| (2) |
| (4) | |||||
for region A, and
| (7) | |||||
for region B,
In eqs. (2)(8) and (11) and ‡‡‡In the as yet unknown odd-odd translead nuclei the ground state (g.s.) is expected to have and seniority zero, whereas eq. (1) with gives the energy of a low excited seniority two state [13]. The respective values of () in regions A and B are (82, 82, 164) and (126, 82, 208). The coefficients multiplying the functions of N and Z are adjustable parameters determined by least squares adjustment to the data, separately for region B [10] and for region A [10, 12]. Their values are given in the table.
We discuss extrapolatability first for region B. The experimental data used in the adjustment [10] included 211 masses. Fig. 2 shows the deviations from the data of the predictions of eq. (1) for the 56 presently known new masses measured after the adjustment [10]. The respective average and rms deviations are 53 and 236 keV, as compared to 2 and 126 keV in ref. [10]. The corresponding deviations of values are and 220 keV, as compared to and 162 keV.
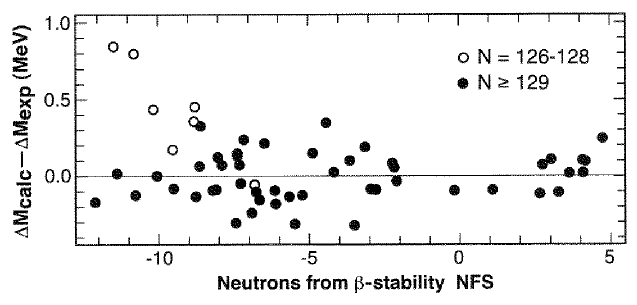
The deviations of the seven N = 126-128 nuclei, denoted by empty circles in the figure, increase when Z increases along the common boundary of regions A and B away from the data. They are related to the increasing discontinuity of the extrapolated mass surface along the common boundary N = 126 of regions A and B away from the data, when the two regions are adjusted separately [9, 10]. The deviations of the remaining 49 nuclei with N 129, which do not follow the N = 126 boundary but extend into the interior of the shell region, seem more random and they are smaller, with respective average and rms deviations of and 155 keV.
The above deviations are as a rule about twice smaller than those of several recent mass models. This is presumably due mainly to the inclusion in eq. (1) of the particle-hole symmetric configuration interaction terms , eq. (11). A more detailed discussion is given in ref. [11].
| Region B [10] | Region A[10, 12] | ||||
|---|---|---|---|---|---|
| Coefficient | Value (keV) | Coefficient | Value (keV) | ||
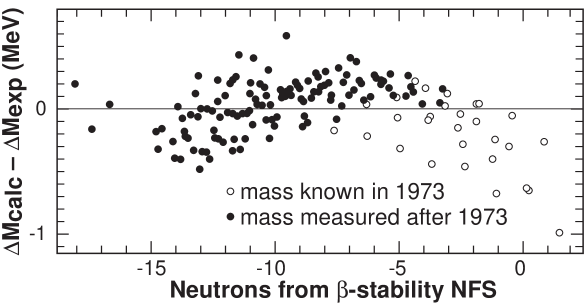
The situation in region A is less simple. The experimental data used in the adjustment [10] included 29 masses and 62 values connecting unknown masses. The respective average and rms predicted deviations for the presently known 121 new masses which became available after the adjustments increase drastically to and 1008 keV, as compared to and 146 keV in ref. [10]. For the 31 new values, though, the respective deviations are only 40 and 89 keV, as compared to 5 and 103 keV.
In order to restore to the new mass predictions the same quality as the old predictions had, while at the same time retaining the high quality of predictions, we made [12] a least-squares adjustment of eq. (1) to all the 150 known masses, with only four adjustable parameters and (eq. (4)) which largely cancel in , while the other seven coefficients were held fixed on their old values [10]. These are the values given in the table.
The readjusted values of and are higher and that of is lower than in ref. [10], indicating smaller overall binding, smaller symmetry energy coefficient, and increased pairing energies in proton-rich nuclei away from stability.
Fig. 3 shows the deviations from the data of the predictions of the readjusted eq. (1) for all the 150 experimentally known masses. The respective average and rms deviations are 2 and 246 keV. The corresponding deviations of the predicted values are 2 and 99 keV.
A more detailed discussion is given in ref. [12].
III Applications to SHE
Panel a of fig. 4 shows the chain of measured -decay energies starting from 293118 [1], and the values predicted for them by eq. (1) when the data are interpreted as g.s. transitions of the assigned nuclei. The figure shows as well the predictions [14] which motivated the search undertaken in [1]. The respective average and rms deviations of the predicted values from the data are and 308 keV for eq. (1) and and 357 keV for ref. [14]. The rms deviation of eq. (1) is consistent with the deviations of the new nuclei in fig. 2 considered above, but the average deviation is too negative. The respective average and rms deviations of the predictions of eq. (1) from those of ref. [14] are and 369 keV.
The variation of the predicted values of eq. (1) along the chain is smoother than that of the data, where there are kinks at Z = 112 and 116 presumably representing submagic numbers or other structure effects. In the SSME such effects are assumed [9, 13] to have been smoothed out by configuration interaction, represented by the terms . The SSME is inadequate to describe non-smoothed abrupt local changes associated with subshell structure [9].
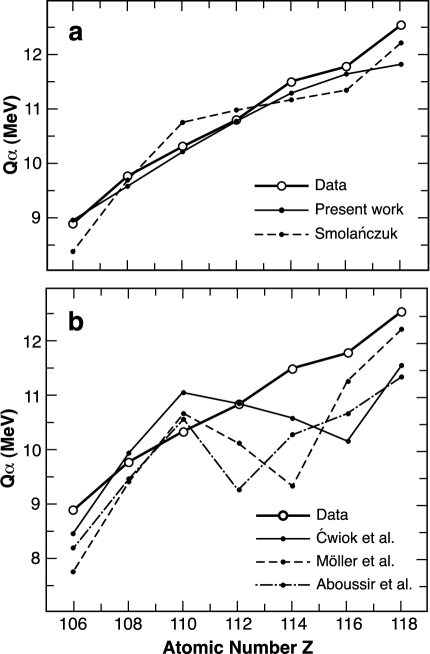
On the other hand, the microscopic energies calculated in ref. [14] are basically sums of (bunched minus unbunched) single nucleon energies, and as such have (magic and) submagic gap effects built in. The corresponding predicted line in fig. 4 has kinks at Z = 110 and 116, corresponding to predicted submagic numbers Z = 108 and 116.
Most of the smoothing effect of configuration interaction is missing in macroscopic-microscopic Strutinsky type and in self-consistent mean field calculations. The included pairing correlations seem not to be enough. This might result in calculated submagic gaps and associated kinks which are too large compared to the data. Panel b of fig. 4 shows such predicted large kinks [17, 16, 15].
As a second application we address the -decay chain observed in ref. [18], which is considered a good candidate for originating from 289114 and its sequential decay to 285112 and 281110. The respective average and rms deviations of the predictions of eq. (1) from the measured energies are 847 and 905 keV, which considerably exceed the deviations expected from fig. 2 for g.s. transitions. If the above assignments are confirmed, the large deviations might indicate that the decay chain does not go through levels in the vicinity of the g.s.
It might also be worthwhile mentioning, that for the conceivable parents 288112 or 291113 which can be obtained from the compound nucleus 292114 by respective or evaporation, the corresponding average and rms deviations of eq. (1) from the measured energies are and 366 keV and and 417 keV, which are more than twice smaller than for the parent 289114.
In conclusion we address the bearing of the Z = 118 results on the question of magicity of Z = 126 versus 114. The energy eq. (1) comprises a part , eqs. (2) and (7), which is a quadratic parity-dependent function of the valence particle numbers, and a part , eq. (11), which is a symmetric function of both particle and hole numbers. For different assumed upper shell boundaries the hole numbers are different and is a different function of N and Z. The superior agreement of eq. (1) with the data in fig. 4, as compared to the deterioration of the SSME [9] near Z = 114 mentioned in the introduction, demonstrates the superiority of proton-hole numbers defined with respect to Z = 126 as a proton magic number rather than Z = 114. This conclusion has also been arrived at in ref. [4] on the basis of B(E2) systematics. It is important to emphasize, though, that the above rather suggestive results are not a proof of superior magicity of Z = 126 as compared to the recently predicted Z = 120 or 124, because no comparative mass studies of this kind were made.
We thank Stelian Gelberg and Dietmar Kolb for help with the calculations.
REFERENCES
- [1] V. Ninov et al., Phys. Rev. Lett. 83 (1999) 1104.
- [2] P. Möller and J.R. Nix, J. Phys. G20 (1994) 1681.
- [3] R. Smolańczuk, Phys. Rev. C56 (1997) 812.
- [4] N.V. Zamfir et al., Phys. Lett. B357 (1995) 515.
- [5] N. Zeldes, Phys. Lett. B429 (1998) 20.
- [6] S. Ćwiok et al., Nucl. Phys. A611 (1996) 211.
- [7] M. Bender et al., Phys. Rev. C60 (1999) 034304.
- [8] A.T. Kruppa et al., Phys. Rev. C61 (2000) 034313.
- [9] S. Liran and N. Zeldes, At. Data Nucl. Data Tables 17 (1976) 431.
- [10] S. Liran, Calculation of Nuclear Masses in the Shell Model, Ph.D. Thesis, Jerusalem, 1973. (In Hebrew. Unpublished.)
- [11] S. Liran, A. Marinov and N. Zeldes, Phys. Rev. C in press, and arXiv: nucl-th/0006045.
- [12] S. Liran, A. Marinov and N. Zeldes, submitted to Phys. Rev. C, July 2000, and arXiv: nucl-th/0008019.
- [13] N. Zeldes, in Handbook of Nuclear Properties, edited by D.N. Poenaru and W. Greiner (Clarendon Press, Oxford, 1996), p. 12.
- [14] R. Smolańczuk, Phys. Rev. C60 (1999) 021301.
- [15] S. Ćwiok, W. Nazarewicz and P.H. Heenen, Phys. Rev. Lett. 83 (1999) 1108.
- [16] P. Möller, J.R. Nix and K.-L. Kratz, At. Data Nucl. Data Tables 66 (1997) 131.
- [17] Y. Aboussir et al., At. Data Nucl. Data Tables 61 (1995) 127.
- [18] Yu.Ts. Oganessian et al., Phys. Rev. Lett. 83 (1999) 3154.