Evidence of hypernuclear production in the reaction
Abstract
The E885 collaboration utilized the 1.8 GeV/c beam line at the Alternating Gradient Synchrotron (AGS) to accumulate greater than 10 times the world’s existing data sample of (K-,K+) events on carbon. A total of about (K-,K+) events were collected and analyzed. hypernuclear states are expected to be produced through the reaction A signal could also result from direct production of without a distinct intermediate state. The measured missing-mass spectrum indicates the existence of a signal below the threshold for free production that cannot be explained by background or effects of limited resolution. Although the resolution was not sufficient to resolve discrete hypernuclear states, the excess of events in the region of missing mass, kinematically inaccessible in free production, can be compared with theoretical predictions for production. Reasonable agreement between the data and theory is achieved by assuming a -nucleus potential well depth of about 14 MeV within the Woods-Saxon prescription.
pacs:
PACS number(s): 21.80.+a, 21.30.FeI Introduction
With the advent of magnetic spectrometers, it became possible to study hypernuclei through the reconstruction of missing mass. Hypernuclei with one strange quark (S=–1 sector) have long been studied using this method quite successfully. Similarly to production of S=–1 hypernuclei in (,K+) and (K-,) reactions, the (K-,K+) reaction can be used to create S=–2 hypernuclei.
Dover and Gal found the -nucleus potential well depth to be 21 MeV – 24 MeV based on their analysis of emulsion data [1]. The and single-particle states are expected to be bound for the values of the potential within that range. Although bound -nucleus states would be broadened by the conversion , calculations have indicated that their widths could be a few MeV or less [2]. Fukuda et al. recently reported evidence for bound hypernuclei produced in the (K-,K+) reaction at = 1.6 GeV/c on a scintillating-fiber target (KEK E224) [3]. Their missing-mass resolution was not sufficient to resolve discrete hypernuclear states but their data seemed to favor a -nucleus potential well depth of 16 MeV. They concluded that a value of 24 MeV for the potential was improbable.
The 1.8 GeV/c K- beam at the AGS was used to create doubly strange (S=–2) systems in E885 via the reaction at = 1.8 GeV/c. A high K- flux and a thick diamond target [4] combined to give a sensitivity to S=–2 states of 1.5 counts per nb/sr as compared to 0.05 counts per nb/sr for E224 [3]. Although the experimental resolution in E885 was somewhat better than the E224 resolution (4.2 MeV/c2 r.m.s. vs. 5.6 MeV/c2 r.m.s. for hydrogen kinematics), it too was insufficient to resolve discrete hypernuclear states. Nevertheless, an estimate of the cross section can be made; the excitation-energy spectrum can be compared to the theoretical predictions for different potential well depths folded with our experimental resolution. 111Excitation energy E is defined as the missing mass minus the combined mass of the 11B(gs) and the (all times c2). With this definition the threshold for free production is at zero excitation energy and bound hypernuclear states have negative excitation energy.
The organization of this paper is as follows. In Sec. II the experimental setup for E885 is described and the event reconstruction is briefly discussed. In order to make cross section estimates and compare the data with theory, the missing-mass spectrum needs to be normalized. This normalization procedure is described in Sec. III. Prior to a comparison with our data, the theoretical cross section calculation must be folded with the experimental resolution function. The determination of the resolution function is described in Sec. IV. The theoretical cross sections for a series of values of the -nucleus potential well depth parameter, folded with the experimental resolution function, are compared with the data in Sec. V. A discussion of background is presented in Sec. VI, followed by our conclusions in Sec. VII.
II Experimental setup
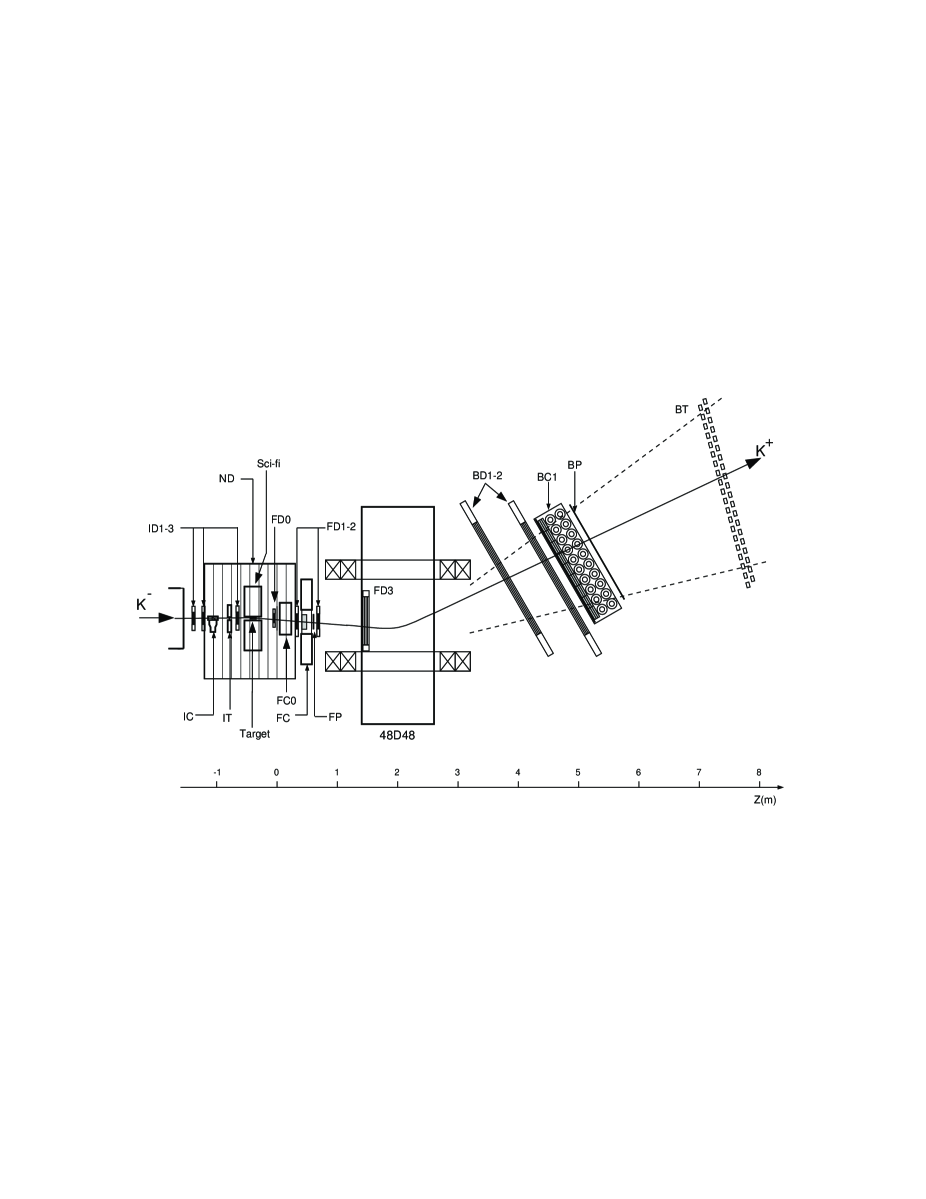
A side view of the E885 detector apparatus is shown in Fig. 1. The K- beam was delivered by the AGS D6 beam line[5] at a rate of K-/spill with a 1:1 K/ ratio. The spill duration and repetition rate were 1.6 s and 1000 spills/hour, respectively (44% duty factor). The purity and intensity of the kaon beam provided by the AGS D6 beam line greatly exceeded that available elsewhere. The beam was focused in the vertical direction by the last beam line quadrupole magnet onto a synthetic diamond target, with a density of . Diamond was used as the target material in order to enhance the stopping rate (a property not important for the direct production discussed in this paper); the resulting compactness of the target also allowed the application of tighter geometric cuts.
The momentum of the incident particle was measured using information from a scintillator hodoscope, MP, located in the beam line at the exit of the first mass slit (not shown in Fig. 1) and information from 3 drift chambers (ID1-3) located downstream of the last beam line magnet. The amplitude in the IC Cherenkov counter, along with the measured particle momentum and the beam line time-of-flight, were used to suppress triggers from pions. Additional details regarding the experimental apparatus can be found in Ref. [6].
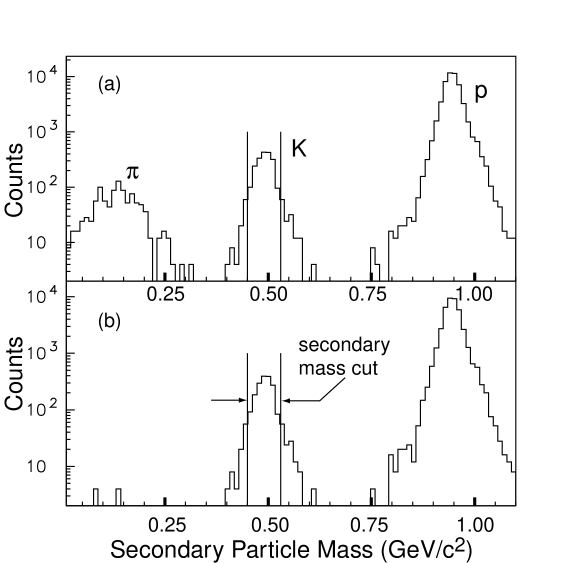
The momentum of the outgoing K+ was measured in the 1.4 T 48D48 magnetic spectrometer. The amplitude in the FC Cherenkov counter, along with the measured momentum and IT-BT time-of-flight, was used to select kaons. In addition to pions, protons were another source of background in the spectrometer. To reduce the hardware trigger rate, an aerogel Cherenkov counter, FC0, was used to suppress protons; its refraction index was selected to be sensitive to kaons but not protons from inelastic events. The measured mass spectrum for a sample of secondary particles is shown in Fig. 2. This shows that the kaons were cleanly separated from the pions and protons that passed the hardware triggers after goodness-of-fit and vertex cuts were applied. The pion peak in Fig. 2a is due to leakage of the hardware FC pion veto. These events were virtually eliminated by an additional software cut on FC pulse height. The results are shown in Fig. 2b. The measured momenta of the incident and secondary particles allow the calculation of the missing mass.
III Normalization
Our data were normalized to the known forward-angle cross section of free production on hydrogen (contained in a CH2 target). Due to the low statistics in the bound region, only angle-averaged differential cross sections could be obtained. These angle-averaged cross sections are denoted here as . We present results averaged over , corresponding to the full acceptance of the spectrometer, and for .
The normalization effectively scaled the diamond target results to agree with the production off carbon in a CH2 target, which was, in turn, normalized to the production off hydrogen in the CH2 target. This procedure corrected for differences in the event reconstruction efficiency between the low-intensity CH2 running and the high intensity diamond target running. These differences were brought about, in part, by tight multiplicity cuts on detector MP.
The scale for the excitation-energy spectrum was set using the equation:
| (1) |
where the normalization factor is given by
The following definitions were used:
-
– angle-averaged double-differential cross section for hypernuclear production on carbon.
-
– number of hypernuclear-production events in an excitation energy interval from the diamond target.
-
– angle- and energy-averaged acceptance for free production on hydrogen.
-
– angle-averaged acceptance for hypernuclear production on carbon. The argument indicates the dependence on excitation energy.
-
– target thickness for hydrogen in CH2 target.
-
– target thickness for carbon in CH2 target.
-
– number of events of free production on carbon in CH2 target.
-
– number of events of free production on hydrogen in CH2 target.
-
– number of events of free production on carbon in diamond target.
-
– angle-averaged differential cross section of production on hydrogen.
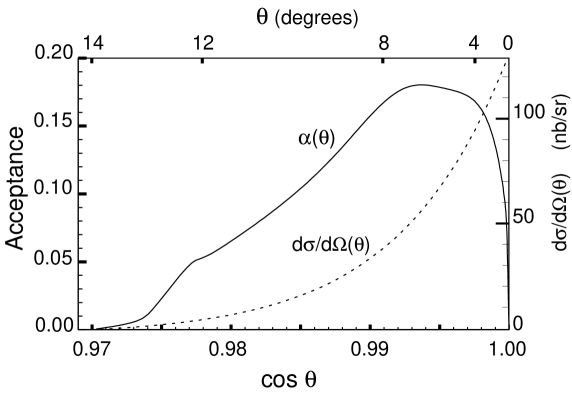
Since the spectrometer acceptance for hypernuclear production varies very little with energy over the small region of interest about zero excitation energy, instead of the energy-dependent acceptance , the acceptance was calculated for a fixed excitation energy of MeV. The angle-dependent acceptance used to determine was generated with a Monte Carlo simulation and is shown as the solid line in Fig. 3.
A summary of the parameters used for normalization in Eq. (1) is given in Table I for two different acceptances; the first one is full spectrometer acceptance () and the second is for limited acceptance () 222Note that in both cases we use the value of 35 b/sr for the elementary production cross section which is compatible with the measured value in Ref. [7]. This factor should be divided out when comparing these results to a calculation of the effective proton number.. The following values for the normalization factor , giving the angle-averaged differential cross section per event were obtained:
This factor relates the counts per MeV to the angle-averaged differential cross section per MeV. The statistical errors given for the normalizing factor were due mostly to the limited amount of calibration data, namely the number of free production events on hydrogen and carbon in the CH2 target. The systematic uncertainty, excluding the uncertainty of the elementary cross section of production on hydrogen, is expected to be below the statistical error. The uncertainty of the elementary cross section for production on hydrogen does not affect the comparison between data and theory because the theoretical DWIA calculations are normalized to the same elementary cross section. Thus the data-to-theory ratio is insensitive to the assumed elementary cross-section.
IV Missing-mass resolution
Data sets were taken with two different CH2 targets and were used to study the missing-mass resolution. The first set used an 8 cm long target and the second set, which was acquired over a shorter time period, used a 13 cm long target. The first data set was used to study the spectrometer’s intrinsic resolution and, in particular, to evaluate the tails of the resolution function. The second set was used to derive the width of the resolution function. The contribution of energy-loss effects to the resolution for the 13 cm long CH2 target is expected to be similar to the contribution from the 5 cm long diamond target.
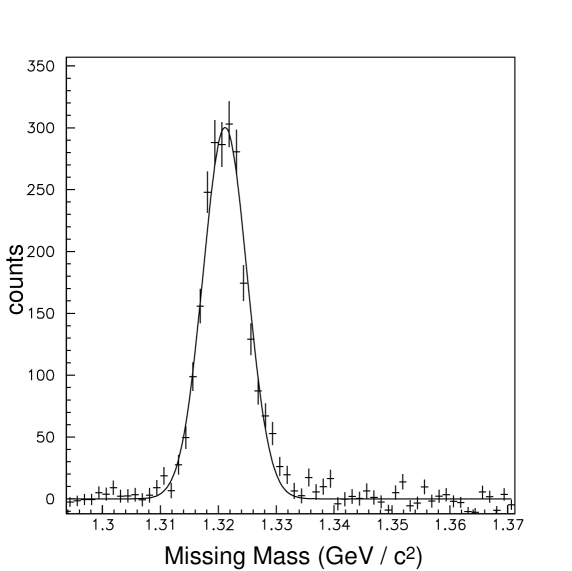
Due to the two-body nature of production on hydrogen, the missing mass spectrum is a peak, whose width equals the experimental resolution, on top of a background from production on carbon. In addition to the peak width, we are also interested in the tail of the resolution. The study of the resolution tails is important; the small hypernuclear-production signal is not well separated in missing mass from the large signal of free production. The background under the hydrogen peak, consisting of production on carbon, is subtracted using the missing-mass spectrum of the carbon target. The resulting background-subtracted spectrum is shown in Fig. 4. The width of the peak from a Gaussian fit is 3.8 MeV/c2 r.m.s.. It can be seen from the plot that the resolution is reasonably close to being Gaussian. The missing mass resolution for the 13 cm CH2 target was measured to be 4.2 MeV/c2 r.m.s. for hydrogen kinematics.
The mass resolution is a function of the target mass. The resolution specific to production on hydrogen (which we measure directly) was used to infer the missing-mass resolution for carbon kinematics using simple kinematical considerations. A factor of 1.45 relates the missing-mass resolutions in carbon and hydrogen kinematics. This value results in a missing-mass resolution for carbon kinematics of 4.2 MeV/c1.45 = 6.1 MeV/c2. The peak of production on hydrogen was also used for the energy-scale calibration. The position of the peak was adjusted to be at the mass value and the accuracy of the energy-scale calibration for the diamond target was estimated to be better than 0.5 MeV.
V Comparison of the data and theory
The theoretical (K-,K+) double differential cross section for production, , was calculated, for both bound and unbound s, in the Kapur-Peirls framework which was developed originally for an estimate of the strength function [8]. The DWIA calculation was performed for a K- momentum of 1.8 GeV/c by assuming the K-N elementary cross sections: =2.90 fm2 and =1.99 fm2. Further details of the calculation can be found in the recent references [2] and [9] in which the (K-,K+) cross sections for the 12C and 16O targets have been estimated for GeV/c.
The calculation was performed for and a series of Woods-Saxon well depth parameter values: V 12, 14, 16, 18, and 20 MeV. The radius and skin depth of the potential were fixed at fm and =0.65 fm. The proton wave function in the target was generated using a Woods-Saxon potential with V = 50 MeV, fm and =0.65 fm. The elementary production cross section was set to 35b/sr to be compatible with the normalization of our experimental data. The kinematic factor , which accounts for the transformation between the two-body and A-body frames, was set to 0.73.
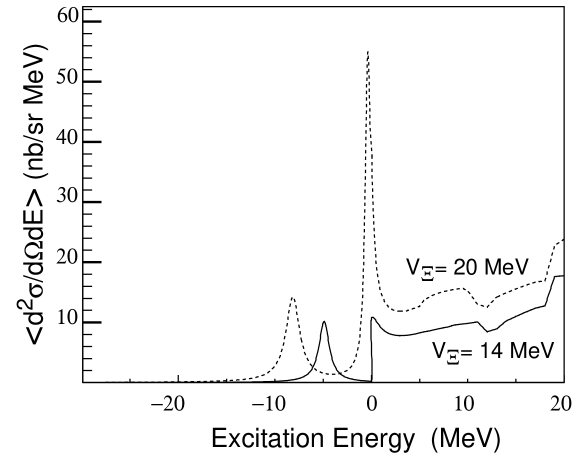
As a typical example of the angular dependence of the differential cross section, the dashed line in Fig. 3 shows the case of the ground state for V=14 MeV. In order to make a comparison between the theory and the data, we calculate the angle-averaged differential cross sections, and fold the results with the experimental resolution. However, we first present theoretical 12C(K-,KBe spectra which have not been folded by the experimental energy resolution but have been angle-averaged over . As shown in Fig. 5, the result for V0Ξ=20 MeV (dashed line) has two bound-state peaks, corresponding to the - and -orbitals. The widths of these peaks are determined using a one-boson-exchange model to estimate the rate for the conversion. For the case of V0Ξ=14 MeV, the state is not bound but it is calculated as a resonance state in the continuum; therefore a sudden rise is seen just above the threshold in Fig. 5.
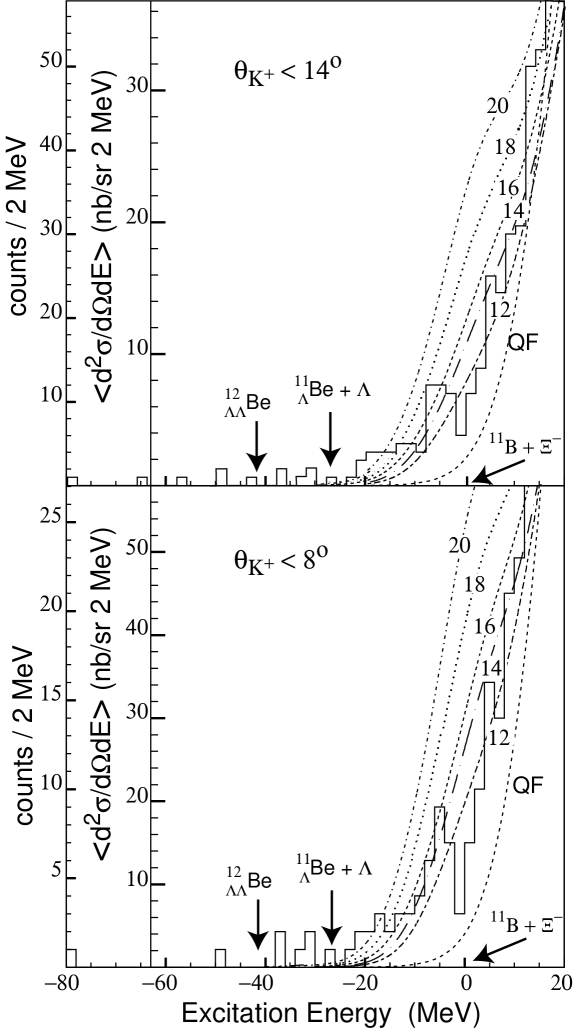
Figure 6 shows experimental excitation energy histograms for 12C(K-,K+)X for two different limits on the scattering angle of the outgoing K+, and . The data clearly show an enhancement around zero excitation energy when compared to a Monte Carlo simulation based on quasi-free production which has been normalized to the total number of 12C(K-,K+)X events (curve QF).
In the same figure, the production theoretical curves for several potential well depths, folded with the 6.1 MeV r.m.s. experimental resolution, are shown for comparison with the data. The expected location of the ground state of Be (assuming a total binding energy of the ’s, , of 25 MeV) and the thresholds for and production are indicated. The normalization calculation for the case is less sensitive to the model of angular dependence because the spectrometer acceptance is fairly flat over this region but drops rapidly for as shown in Fig. 3; we present the results for both the entire acceptance and for in Fig. 6.
Visual inspection shows that the theoretical curve for the value of the -nucleus potential well depth V = 14 MeV agrees with the data reasonably well in the region of excitation energy -20 MeVE0 MeV and much better than the curve for V = 20 MeV. If any of the observed signal results from direct two- production without an intermediate state, the discrepancy between the V = 20 MeV results and the remaining experimental signal becomes even larger. The comparison of data to theory in the bound region can be quantified by considering the results for the angle-averaged cross section integrated over the -20 MeVE0 MeV excitation region. The results are presented in Table II. It can be seen that the DWIA calculation predicts a yield more than a factor of two larger than the measured cross section in this region when a -nucleus potential well depth of 20 MeV is used.
VI Background
Events due to production off the hydrogen contained in the target and target-area scintillators produce a small peak at +90 MeV in excitation energy; this peak represents only a few per cent of the total events and thus this contamination does not affect the analysis near zero excitation energy. Background in the region of negative values of excitation energy can be divided into two groups:
-
Flat background caused by particle misidentification, severe tracking errors, etc. Such background might have some structure over a wider region of missing mass, but on a small, 100 MeV scale, it should be flat. This was confirmed when observing the background in the bound region obtained by using a loose set of cuts (hence considerable background contamination).
-
Leakage from E0 due to finite missing-mass resolution.
Background of the first kind can be easily estimated by observing the region further below zero where leakage becomes negligible. There are 6 events in the interval of excitation energy [-80 MeV,-40 MeV] for (see Fig. 6). Since the flatness of the background was confirmed by loosening the cuts, an extrapolation can be made that the number of background events of the first kind in the excitation-energy region [-20 MeV,0 MeV] is about 3. It can be concluded then that the background of the first kind contributes only a small fraction of the total signal in the hypernuclear production region, and it is ignored when comparing the data to theory.
Background of the second kind is taken into account when the theoretical cross section is folded with the experimental resolution. The number of events in the E0 region that leak from the E0 region depends on the shape and magnitude of the excitation-energy spectrum for E0 and on the resolution function shape. We found that the signal observed in the bound region cannot be explained by leakage from the E0 region. This is already evidenced by the good agreement between the data and theory for V = 14 MeV in the E0 region, since non-zero cross section of hypernuclear production is essential to explain the events in the bound region. We, however, made two additional checks to demonstrate it. First, a Monte Carlo excitation-energy spectrum, where only free production is simulated and no events in the E0 region are produced, was folded with the measured experimental resolution. It was found that only 10 events are expected to have E0 for (the observed number is 67). Second, a different resolution function was tried with very large tails added to the basic Gaussian resolution function. Even with those large tails, which are clearly ruled out by the resolution measurement, the signal in the bound region due to leakage was still a few times below the observed level.
VII Conclusions
The measurement of the missing mass in the (K-,K+) reaction on carbon in E885 allowed the determination of the excitation-energy spectrum of directly produced S=–2 systems. The signal in the missing-mass region below the threshold for free production was examined in order to extract information on the existence of hypernuclei and the strength of the -nucleus potential. Our analysis has shown that the events in the bound region of the missing-mass spectrum could not be explained by non-S=-2 background or effects of limited resolution, and these events are consistent with hypernuclear production. Possible sources of the signal in the bound region are the production of one or two s in the continuum or double- hyperfragments. The threshold for Be + is estimated to be at E -27 MeV. This channel may dominate the other two- channels since the two-step (K-,),(,K+) process involves one low-momentum and one high-momentum . Its cross section is expected to be several orders of magnitude larger than the production cross section for double- hypernuclei[10, 11]. No quantitative estimate of the contribution of these processes in this kinematic regime has been made and final interpretation of the excitation spectrum in terms of one-step -hypernuclear production verses two- production without an intermediate -state requires additional theoretical work.
A comparison of the data and the theoretical calculations for the cross sections of hypernuclear production, folded with the experimental resolution, shows a reasonable agreement of the data and theory for V = 14 MeV in the region of excitation energy -20 MeVE0 MeV and a significant disagreement between the data and theory for V = 20 MeV. These results are consistent with the conclusions of Ref. [3]. If a significant portion of the events in this region correspond to two- production without an intermediate hypernucleus, the discrepancy between the calculation using this well depth and our results would be even larger. We conclude that the results are consistent with the theoretical predictions when a potential depth of 14 MeV or less is assumed.
The accuracy of DWIA, which was used for the cross section calculation, was nominally assumed to be 30% in Ref [3]. Although the DWIA framework has been successful in describing the production of single- hypernuclei using the (,K+) and (K-,) reactions, it is possible that that the DWIA accuracy for the (K-,K+) reaction is worse due to the higher momentum transfer. Therefore a value for the -nucleus potential well depth as high as 20 MeV, though less favored, cannot be completely ruled out. Additional theoretical calculations of the complete excitation spectrum are needed to determine the parameter space that is compatible with our results.
This work is supported in part by the U. S. Department of Energy under contracts DE-FG02-91ER40609, DE-AC02-76H00016, and DE-FG03-94ER40821, by the German Federal Minister for Research and Technology (BMFT) under contract No. 06 FR 652, by the United Kingdom SERC, by the Natural Sciences and Engineering Research Council of Canada, and by the Japanese Society for the Promotion of Science.
REFERENCES
- [1] C. B. Dover and A. Gal, Annals of Phys. 146, 309 (1983).
- [2] Y. Yamamoto, T. Motoba, T. Fukuda, M. Takahashi and E. Ikeda, Prog. Theor. Phys. Suppl. 117, 281 (1994).
- [3] T. Fukuda et al., Phys. Rev. C 58, 1306 (1998);
- [4] D. E. Alburger and M. May, to be published.
- [5] P. H. Pile et al., Nucl. Instr. Meth. A321, 48 (1992).
- [6] R. W. Stotzer et al., Phys. Rev. Lett. 78, 3646 (1997).
- [7] T. Iijima et al., Nucl. Phys. A546, 588 (1992).
- [8] T. Motoba, H. Bandō, R. Wünsch, and J. Žofka, Phys. Rev. C 38, 1322 (1988).
- [9] K Ikeda, T. Fukuda, T. Motoba, M. Takahashi and Y. Yamamoto, Prog. Theor. Phys. 91, 747 (1994).
- [10] C. B. Dover, Nuckleonika 25, 521 (1980).
- [11] R. E. Chrien, C. B. Dover, and A. Gal, J. Czech. Phys. 42 1089 (1992).
| maximum | ||||||
|---|---|---|---|---|---|---|
| (degrees) | () | |||||
| 14 | 8.1% | 14.8% | 2 | 1/125.6 | 35 | 480 |
| 8 | 14.4% | 15.3% | 2 | 1/127.9 | 35 | 240 |
| This Work | KEK E224 | ||
| 8∘ | 14∘ | ||
| Counts | 42 | 67 | 3 |
| Sensitivity (counts per nb/sr) | 0.47 | 1.6 | 0.05 |
| Experiment (nb/sr) | 8914 | 425 | 6045 |
| V=12 MeV (nb/sr) | 67 | 26 | - |
| V=14 MeV (nb/sr) | 92 | 37 | - |
| V=16 MeV (nb/sr) | 115 | 46 | 75 |
| V=18 MeV (nb/sr) | 166 | 68 | - |
| V=20 MeV (nb/sr) | 226 | 93 | 170 |