Measurement of in the Resonance
Abstract
We have measured the reaction at a proton beam energy of 980 MeV, which is 88.5 MeV above threshold using the new “germanium wall” detector system. A missing–mass resolution of the detector system of 2.6 was achieved. The angular distribution of the meson is forward peaked. We found a total cross section of (573 83 (stat.) 69 (syst.) ) nb. The excitation function for the present reaction is described by a Breit Wigner form with parameters from photoproduction.
The production of –mesons is interesting because it opens the possibility of studying the interaction between the lightest isoscalar particle and the nuclear environment. Haider and Liu were the first to show that even bound -nucleus systems, i.e. –mesic nuclei, could be possible [1]. Based on the results of Bhalerao and Liu [2] they found an attractive –N interaction which in their calculations leads to bound states for nuclei with mass number A 10 [3]. Rakityanski et al. [4] even relaxed this condition to A 2. The widths of such states were predicted to be narrow enough to be observable for nuclei with A 4. Wycech et al. [5] also predicted the formation of mesic nuclei in , but not in . In contrast, Abaev and Nefkens [6], as well as Wilkin [7] showed that the formation of quasi–bound – states in the reaction should indeed be possible.
In addition, the reaction is of interest due to its surprisingly large cross section close to threshold making this reaction a prime candidate for the source of –mesons in tagged –facilities [8].
A detector system called the “germanium wall” [9] was built at the COSY facility in Julich (see Figure 1).

In its complete setup, the germanium wall is a stack of four position sensitive high–purity germanium detectors having a conical acceptance with an opening angle of mrad. In the centre of each detector is a hole with a size of mrad allowing the primary beam to pass through. Two types of detectors are used, one 1.3 mm thin diode (“quirl–detector”) for determining the reaction vertices through its good position resolution given by the crossing of two counterrotating spirals and three 17 mm thick diodes for measuring the particle energies (“energy–detectors”). For further details see Ref. [9]. The setup used for the present measurement consisted of one quirl and two energy–detectors (Quirl, E1 and E3, see Figure 1).
First measurements with the “germanium wall” showed the good missing–mass resolution of the system. The reaction was studied at a proton beam energy of 980 MeV (88.5 MeV above threshold) leading to almost 4 acceptance of the detector system for the product –particles. We performed two runs at different times.
The target was a cell filled with liquid deuterium with 6 mm diameter and thicknesses of 2.40.2 mm (run A) and 4.40.2 mm (run B), respectively [10]. The COSY extracted proton beam was focussed onto the target yielding a spot with a radius and a divergence of 6 mrad. These parameters together with the short distance between target to detector yields a total angular uncertainty of 16 mrad, where the individual contributions are linearly added. This uncertainty is much larger than that resulting from the position resolution of the detector, which is in the order of 2 mrad. The beam had a momentum spread of [11].
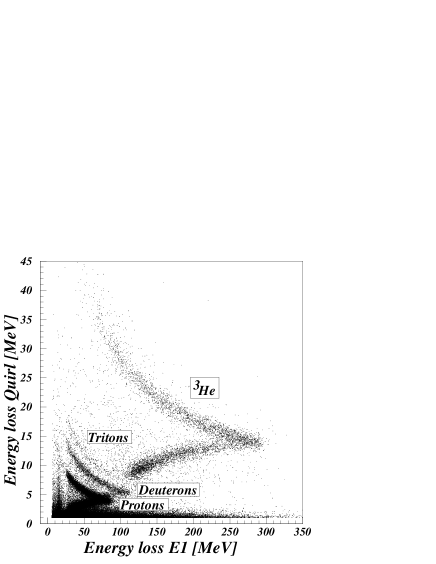
The energy and direction of the emerging –particles were measured by the “germanium wall”. Figure 2 shows a E–E spectrum demonstrating the capability of the detector system for particle identification. Through energy and emission direction measurement of –particles, the missing–mass was calculated. A missing–mass spectrum for run B is shown in Figure 3. The –peak is clearly visible with a resolution of . Background is mainly caused by multi–pion production (e.g. , , etc.). Low–energy background events at small angles were not detected, because of the minimum opening of the detector system. These events correspond to large relative energies between the pions and thus to large missing–mass values. Therefore, the spectrum is truncated at 600 MeV/. For run A a missing–mass resolution of is obtained. The whole body of data was divided into 5 and 6 angular bins for run A and run B, respectively. For each bin a Gaussian together with a background function were fitted to the corresponding missing–mass spectrum above 450 . For run B, two different shapes for the background were assumed: a polynomial of third order and a function with the missing–mass and parameters to be fitted. Both functions lead to the same results. For run A, the background is not so clearly separated for large missing–masses from the peak as it is in run B. Therefore, several functions were tested. Polynomials were fitted to the range lower than the peak and only the first point above the peak. Alternatively a step like function (cummulative Lorentzian) was fitted to all data. The peak was always assumed to be a Gaussian. Finally the number of events was obtained by integrating the Gaussians and weighted means were deduced. Further details of the data analysis procedure are given elsewhere [12].

Due to beam halo during the experiments the intensity of the beam had to be reduced to a level of protons per second. Thus pile up and detector damage were avoided, but event statistics was strongly reduced. The measured angular distribution is shown in Figure 4.
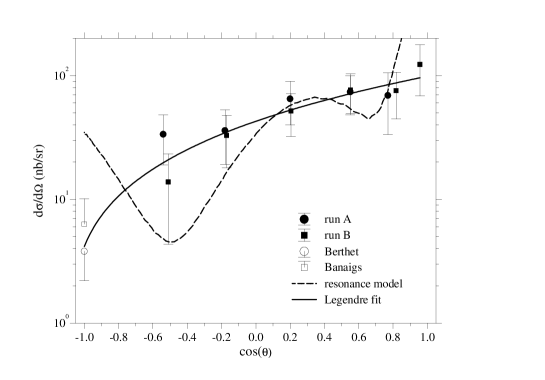
The error bars shown represent the statistical errors only. In addition, there are systematic uncertainties: target thickness and in the different runs, respectively, luminosity calibration , corrections due to trigger and detector inefficiencies due to nuclear interactions in Germanium (see Ref. [13]) . The total systematic error of and (when added in quadrature) for the two runs, respectively is smaller than the statistical error. The efficiency of the data analysis () was studied by Monte Carlo simulations. The simulated detector response was found to be in excellent agreement with the experiment [14]. Before and after each run the detector was checked with radioactive sources. No significant deviations in the amplifier gains were found as expected, since the electronic circuits were kept at a constant temperature. Since both runs were performed under different experimental conditions with respect to beam halo, target thickness and distance between target and detector [12], different systematic errors lead to an enhancement of run A compared to run B which is slightly above the statistical error given above. The halo was 2.2 times more intense during run A than in run B thus leading to a larger combinatorial background than in run B and hence to larger error bars of the integrated Gaussians for the peak.
The angular distribution is forward peaked. This is in contrast to the results of Mayer et al. [8] reporting almost isotropic distributions close to threshold. The cross sections of Banaigs et al. [15] measured through at a slightly higher excitation energy (corresponding to an equivalent proton kinetic energy of 1047 MeV) agree with our data. When we fit Legendre polynomials to the present data, an unphysical negative value for is obtained. In order to overcome this deficiency we have added one data point at =-1 from Ref. [16], who had measured an excitation function for this angle. This point is also shown in Fig. 4. In order to take into account the fact that the point was measured at a slightly different energy of , we have doubled its statistical error. Another data point in the literature taken at a somewhat higher beam energy (see Ref. [15]) is also shown in Fig. 4. Again its error bar was doubled. A Legendre polynomial fit to all points of the angular distribution, i.e. the present ones from both runs as well as the one from Ref.’s [16, 15] weighted by their total errors, yielded parameters , and all given in nb/sr, and with a from which a total cross section of (573 74) nb follows. In addition to this statistical error the systematic error is assumed to be 69 nb. The result is insensitive to the added point, because the differential cross section is small for the backward angle emission. Including higher degrees in the fit procedure does not improve the fit, a lower degree gives an unphysical negative value for .
Kingler [20] has extended a model originally developed for pion production [21] to include higher–resonances. The original model was limited to only pion exchange, resonance excitation as well as non resonant contributions. The extension treats other meson exchanges as well as higher nucleon resonances than the . The vertex function for the different baryon–baryon–meson couplings were calculated in a simple quark model and are momentum dependent. For the present reaction the largest contribution to the cross section comes from the and interactions while the contribution due to interaction is one order of magnitude smaller. The contributions of other resonances like , , and are even smaller. However, the form factor is calculated only for harmonic oscillator wave functions with the frequency being a free parameter varied to fit the experimental data. The model predictions are shown in Fig. 4 as dashed curve. Obviously, the calculation shows structures not observed in the present data.
The extracted total cross section together with earlier data from Mayer et al. [8] is shown in Figure 5. From the angular distributions given by Banaigs et al. [15], Loireleux [17] and Kirchner [18] we extracted total cross sections by fitting Legendre polynomials. The results are also shown in Figure 5. Kirchner claimed that the data from Ref. [17] suffer from important electronic problems. No further details are given. The data from Mayer et al. [8] indicate a strongly rising cross section close to threshold.
Also shown in the Figure is a normalized calculation within a two–step model developed by Kilian and Nann [19]. Within this model a pion is produced in a first step through . In a second step, this pion produces the in an interaction with the neutron. A kinematical velocity matching yields the maximum close to threshold. The present data do not support this model as the dominant reaction mechanism.
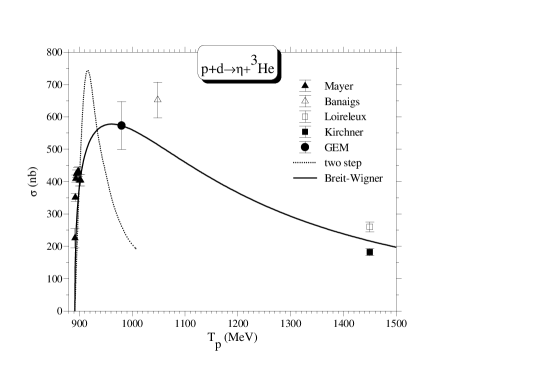
The energy region from 900–1100 MeV corresponds to the centre of the resonance ( 200 MeV) known to couple strongly to the – channel [22]. One may therefore attempt to describe the cross section by an intermediate (1535) resonance excitation. The cross section is calculated as
| (1) |
with the excitation energy and the matrix element. All momenta are in the centre of mass system. This is calculated as in photoproduction on the proton [23]
| (2) |
with
| (3) |
Similar to Ref. [23], we applied a width at the resonance of =200 MeV, a Breit-Wigner mass of =1540 MeV/c2. The branching ratios were set to =0.47 for the decay, =0.48 for the pion decay and =0.05 for the two pion decay [22]. The momenta at the resonance position are indicated by the index . The only free parameter is the strength taken to be 241 nb in order to fit to the present data point. The calculation is shown in Figure 5 as a solid curve. The trend of the data is reproduced, which may be taken as an indication that production of the (1535) resonance is the dominant reaction mechanism and that the product of kinematics and form factor changes only very little over the present energy range. The overall shape of the calculation slightly underestimates the data of Mayer et al. [8] close to threshold. For a more detailed investigation of fine structure, additional data in this region is needed. An enhancement close to threshold was also seen in production in NN interactions [24, 25] and was attributed to a strong final state interaction. The agreement between the excitation functions for and reactions excludes strong FSI between the nucleus and the except for the near threshold region.
We gratefully acknowledge the COSY crew for their efforts providing us with a good beam. We are thankful for support by BMBF Germany (06 MS 882), Internationales Büro des BMBF, SCSR Poland (2P302 025 and 2P03B 88 08), NATO Scientific Affairs, and COSY Jülich.
References
- [1] Q. Haider and L.C. Liu, Phys. Lett. B 172 (1986) 257.
- [2] R.S. Bhalerao and L.C. Liu, Phys. Rev. Lett. 54 (1985) 865.
- [3] Q. Haider and L.C. Liu, Phys. Rev. C 34 (1986) 1845.
- [4] S.A. Rakityanski et al., Phys. Rev C. 53 (1996) R 2043.
- [5] S. Wycech et al., Phys. Rev. C 52 (1995) 544.
- [6] V.V Abaev and B.M.K. Nefkens, Phys. Rev. C 53 (1996) 385.
- [7] C. Wilkin, Phys. Rev. C 47 (1993) R 938.
- [8] B. Mayer, Phys. Rev. C 53 (1996) 2068.
- [9] M. Betigeri et al., Nuclear Instruments and Methods in Physics Research (A 421) (1999) 447.
- [10] V. Jaeckle, K. Kilian, H. Machner, Ch. Nake, W. Oelert, P. Turek, Nucl. Instruments and Methods in Physics Research A 349 (1994) 15.
- [11] GEM collaboration, M. G. Bettigeri et al., Nucl. Instruments and Methods in Physics Research A 426 (1999) 249.
- [12] K. Grewer, Ph. D. Thesis, Univ. Münster 1999.
- [13] H. Machner and B. Razen, Nuclear Instruments and Methods in Physics Research A (in press)
- [14] W. Garske, Ph. D. Thesis, Univ. Münster 1999.
- [15] J. Banaigs et al., Phys. Lett. 45B (1973) 394.
- [16] P. Berthet et al., Nucl. Phys. A443 (1985) 589.
- [17] E. Loireleux, Ph. D. Thesis, Université Paris, Orsay 1990.
- [18] T. Kirchner, Ph. D. Thesis, Université Paris, Orsay 1993.
- [19] K. Kilian and H. Nann, Particle Production Near Threshold, AIP Conf. Proc. 221 (1990) 185.
- [20] J. Kingler, Ph. D. Thesis, Univ. Bonn 1995 and private communications to H. M.
- [21] M. Harzheim et al., Z. Physik 340 (1991) 399.
- [22] Particle Data Group: C. Caso et al., The European Phys. J. 3 (1999) 1.
- [23] B. Krusche, Acta Phys. Polonica 27B (1996) 3147.
- [24] H. Calén et al., Phys. Lett. B 366 (1996) 39.
- [25] H. Calén et al., Phys. Rev. Lett. 80 (1998) 2069.