Light Fragment Yields from Central Au + Au Collisions at 11.5 A GeV/c
Abstract
Inclusive double differential multiplicities of deuterons, 3H, 3He, and 4He measured by E877 for 11.5 A GeV/c Au+Au collisions at the AGS are presented. Light fragments at beam-rapidity are measured for the first time at AGS energies. Beam rapidity deuteron and 4He yields and transverse slope parameters are found to be strongly dependent on impact parameter and the shape of the deuteron spectra is not consistent with that expected for a simple thermal distribution. The deuteron yields relative to proton yields are analyzed in terms of a simple coalescence model. While results indicate an increase in source size compared to collisions of lighter systems at the same energy, they are inconsistent with a simple coalescence model reflected by a rapidity dependence of the coalescence parameter . A new approach utilizing an expanding thermalized source combined with a coalescence code is developed for studying deuteron formation in heavy-ion collisions. The strong dependence of deuteron yields on collective motion implies that deuteron yields relative to those of protons can be used for constraining source parameters.
pacs:
PACSnumber: 25.75.+rIntroduction
The study of heavy-ion collisions at ultra-relativistic energies has been pursued with the intent of observing matter at extreme temperatures and densities, the eventual goal being the production and study of deconfined and/or chirally restored matter. Although the relativistic heavy-ion program has developed over a number of years, and various hadronic observables have been studied, a complete characterization of the state formed during the high density phase of the collision is still outstanding.
Measurements of light nuclei produced in the participant region of heavy-ion collisions are of interest since model calculations can be used to deduce measures of the source volume from the yield of nuclear fragments relative to that of protons [1, 2, 3, 4, 5]. The yield of light nuclei is closely related to the two particle correlation between nucleons induced by final state interactions [4]. This can be incorporated into a theoretical framework from which one can deduce the density of the interaction region at freeze-out.
In this publication we will report on investigations of the characteristics of spectra of light nuclei utilizing the E877 spectrometer, located at Brookhaven National Laboratory’s (BNL) Alternating Gradient Synchroton (AGS). Spectra and yields of light nuclei, including deuterons, 3H, 3He, and 4He will be presented and compared to similar measurements at other beam energies and for various colliding systems.
Experimental Apparatus
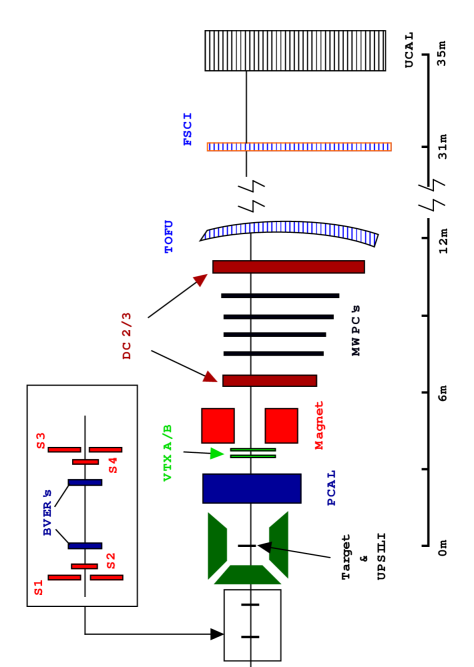
The E877 apparatus has already been described in [5]. Global observables, single particle spectra of protons, pions[6] and kaons [7] and two particle correlations [8, 9] as well as collective flow [10] have been studied by E877 at the AGS. The experimental setup primarily consists of three components: (1) a set of scintillators and silicon detectors for beam definition; (2) a near calorimetric coverage and a large acceptance charged particle multiplicity measurement, providing global event properties; and (3) a forward spectrometer, allowing measurements of identified charged particles. Figure 1 shows schematically the E877 experimental setup for the 1994 run. The direction is defined to be along the beam and the axis is defined to be out of the page (vertical).
The data presented here were collected in the fall of 1994. After event selection cuts were applied, approximately events for the 4% highest collisions were available for analysis.
Beam Definition
The beam in the C5 beam line at the AGS for the 1994 run had approximately particles per spill with a 1s spill length. To verify the beam composition and direction, and provide the start time of the experiment a number of detectors were placed upstream of the target.
A series of four plastic scintillators (S1, S2, S3, S4) were used for the time reference definition in the experiment. Scintillators S1 and S3 were ring-shaped veto detectors while scintillators S2 and S4 were ellipsoidal detectors placed at relative to the beam. Fast rise time phototubes were utilized on S2 and S4 providing the interaction time with a typical Gaussian standard deviation of ps.
Two silicon microstrip detectors (BVER’s) measured the beam angle in the -plane and were located between S2 and S4. The detectors were 300 m thick and composed of 320 strips with a 50 m pitch. This provided a measurement of the beam angle with a resolution of about rad and determined the coordinate of the beam at the target to 300 m. The BVERs were also used to tag and reject those events in which two or more particles traversed the experiment within the same 1 s time interval.
To eliminate beam components with incorrect nuclear charge number, a silicon semiconductor counter (SILI) 87 microns thick was placed cm upstream of the target to measure the energy loss of the beam particles. This detector provided a unit charge resolution of the incoming beam particles.
Event Characterization
For the 1994 run we used a AU target having a thickness corresponding to 1% of an interaction length. Two large, highly segmented calorimeters were used to quantify the centrality and reaction plane of the collisions. Together these detectors cover nearly 4 in the center-of-mass frame.
The Target Calorimeter (TCAL) [11] consists of 832 NaI(Tl) crystals surrounding the target with a polar angle coverage of (). Each crystal has a depth of 13.8 cm, or about 5.4 radiation lengths (0.34 hadronic interaction lengths).
The Participant Calorimeter (PCAL) [11] is a finely segmented lead/iron/scintillator calorimeter consisting of 16 azimuthal, 8 radial, and 4 depth sections. It covers a polar angle region of (). There is a small opening in the PCAL ( mrad; mrad) with iron wedges along the inside which define the acceptance of the forward spectrometer.
Events are characterized by their centrality as determined by the transverse energy measured by the calorimeters.
| (1) |
where is the energy deposited in one cell of the calorimeter and is the polar angle of the cell with respect to the beam axis; the sum is performed over all PCAL cells. As was noted in [11], the overall systematic error associated with the measurement of was determined to be less than 4% for all collisions considered in this analysis.
The transverse energy is then used as a measure of the centrality of the collision by noting that
| (2) |
where is the cross-section, is the incident number of beam particles, is the trigger down-scale factor (), and is the number of target atoms per unit cross-sectional area. For the experiment we used a Au target with an areal density of 540 mg/cm2. This corresponds to a 1% interaction probability for incident Au ions at an calculated inelastic cross section of = 6.1 b. Central collisions of a certain percentage () of the inelastic cross section were then selected by adjusting the lower limit E such that [10]:
| (3) |
Forward Spectrometer
The momentum and time-of-flight of all charged particles accepted into the forward region are measured using two drift chambers, four multiwire proportional chambers and two time of flight hodoscope walls. These detectors are also shown schematically in Figure 1.
In addition, a set of multiwire proportional chambers was placed 2 m from the interaction region; the two chambers were separated from each other by 25cm (VTXA and VTXB). They were not used in this analysis.
The analyzing magnet, situated downstream of the vertex chambers and spanning from cm to cm, could be run in two polarities in order to study possible systematic errors in the momentum measurement and to optimize the acceptance for positive and negative particles. The magnet had a maximum field of Gauss with a polarity that bent positive particles in the negative direction and an integrated of .3487 Tm [8].
Two drift chambers (DC2 and DC3), located at cm and cm from the target, respectively, provided track x and y information and were used to determine the rigidity of each track; each drift chamber was composed of six planes of wires which measured the position in the bending plane of the magnet, i.e. the xz-plane, with a resolution of m ( m) for DC2 (DC3). The anode wires in DC2 and DC3 were parallel to the y-direction, and the cathode planes in both chambers were segmented into chevron shaped pads. The signals from the pads provided y measurements of charged particles with a resolution of typically a few percent of the pad size. Each drift chamber had two segmentation size regions, resulting in -resolutions of 2.3 mm (15 mm) in DC2 and 4.3 mm (36 mm) in DC3 depending on the pad size.
The multi-wire proportional chambers (MWPC’s) with vertical anode wires space 5.08 mm apart were situated between the two drift chambers. The MWPC’s were used to ease tracking in the high multiplicity environment of Au+Au collisions.
An array of 160 plastic scintillators (TOFU) [13] aligned vertically and placed behind DC3 was used to measure time-of-flight with a time resolution in conjunction with the beam start counters of about ps. It also provided an additional y-measurement with a precision of about 1 cm in the y-direction. The FSCI (Forward Scintillator) was a second hodoscope which also measured the time-of-flight at a distance of 31 m from the target with a resolution of 350 ps. It was utilized in this analysis only to study of TOFU systematics since it had a lower resolution and smaller acceptance than the TOFU.
Data Analysis
Particle rigidity was determined from the radius of curvature of a track () through the magnet and the value of the magnetic field :
| (4) |
where is the charge of the particle. The vertical momentum component, , is calculated from the vertical position of the track at the TOFU. The reconstructed mass of each particle is then given by
| (5) |
where and are calculated from the time-of-flight measurement coupled with the calculated path length to the associated TOFU scintillator. After all momentum calculations, Fig. 2 shows the E877 acceptance for protons and deuterons as a function of transverse momentum and rapidity for the 1994 run.
The charge of each particle is determined from the energy deposition in the TOFU slat. Shown in Figure 3 is the distribution of pulse-heights for those particles corresponding to the deuteron mass peak at beam rapidity. A clear peak is visible as well as a peak corresponding to , from two tracks striking the same TOFU slat. In addition, the peak corresponding to 4He is clearly visible. The resulting distribution is fit to three Landau functions with a non-linear response due to the saturation of the photomultiplier tubes associated with the TOFU. The standard E877 analysis cut on the TOFU pulse-height distribution at times the 1 MIP pulse height corresponding to about a % loss in the yield with no contamination from .
Deuterons
Since and since the momentum and time of flight measurements worsens at larger momenta, deuteron selection is complicated by the tail of the proton peak at high momenta. To account for this effect, a systematic background subtraction technique was developed[14]. In each rapidity and transverse momentum bin the yield of deuterons is calculated by fitting the mass distribution in this region to the proton and deuteron mass peaks plus a background between these peaks due to misidentified protons from resonance decays.
Shown in Figure 4 is the reconstructed distribution of mass-squared in several and bins, where the rapidity was calculated assuming the deuteron mass. At low momenta, the deuteron and proton peaks are clearly distinguishable. In this region of phase space, the mass-squared distribution is described by two Gaussians and either an exponential or linear background***The systematic error associated with the choice of the background function has been found to be less than 5% .. At higher momenta, the proton and deuteron mass-squared distributions broaden, due to the momentum resolution of the apparatus, and the background is minimal. In this region of phase-space, shown in Figure 4B, the mass-squared distribution is described by two Gaussian distributions. In the region, the momentum resolution smearing coupled with the approximately equal particle yields for protons and deuterons, causes the peaks to overlap (Figure 4C), resulting in a loss of separation of deuterons from protons in this region. However, at deuteron rapidity the contamination of protons is minimal because the proton would need to be traveling at twice the beam momentum. Thus, a deuteron peak is again identifiable (Figure 4D) and the yield can be determined with a single Gaussian. The widths of the proton and deuteron mass peaks were found to be consistent with the known time of flight and momentum resolution of the experiment.
The yield of deuterons () in each small bin of phase space is determined from the parameters of a Gaussian fit to the deuteron peak:
| (6) |
where and are the variance and amplitude of the Gaussian distribution fit to the deuteron peak, and is the bin width. Those regions of momentum space that fall between the first two regions outlined above, Figure 4A and B, respectively, have been fit with both two Gaussians as well as two Gaussians plus a background in order to determine the systematic error due to the choice of fit funcion. The resulting yields of deuterons agree within 5%.
Tritons
The extraction of a triton signal is complicated by the fact that its mass-squared distribution is wider than the deuteron’s due to multiple scattering and its yield is 1-2 orders of magnitude lower than that of the deuteron. However, a technique similar to that used for the deuterons can also be utilized to measure the yield of tritons in the collisions studied here. In Figure 5 is shown the reconstructed mass-squared distribution in various bins for GeV/c. A clear triton peak is visible. The yield of tritons was calculated for each rapidity and bin by fitting this distribution with a Gaussian at the mass of the triton with an exponential background from the deuteron tail; the choice of an exponential or Gaussian background was found to have less than a 5% effect on the resulting yields. Several examples of these fits are also shown in Figure 5.
Helium Isotopes
Helium isotopes can be separated from species by cutting on energy deposition in the scintillators as described earlier. 3He are identified by recalculating the mass-squared according to eqn. 5 assuming . This will cause all particles which pass the scintillator pulse-height cut to be found at double their actual mass. The 3He peak in this case is found between, and clearly differentiated from, the proton and deuteron residual peaks, respectively located at and (GeV/c)2, as shown in Figure 6. The 3He peak is buried under the proton tail for and, in the other rapidity bins, the yield of 3He may be extracted by fitting the mass-squared distribution by two Gaussians corresponding to the 3He and proton peaks.
The method described above, i.e. cutting on the energy loss in the TOFU and, subsequently, fitting the peak in the spectrum, was used to determine the deuteron, triton and 3He yield. However, this method cannot be used to determine the yield of 4He because the 4He peak in space is buried under the significantly larger deuteron peak. We therefore use a complimentary approach to identify 4He: we first cut on the peak and then fit the peak in the TOFU pulse height distribution. As described earlier, this distribution has two peaks, corresponding to one and two particles, at all but beam rapidity where an additional peak is evident as shown in Figure 3. These peaks are fit, at beam rapidity for GeV/c, to Landau distributions and the yield is then determined from the integral under the fit to the distribution. The overall systematic errors from this procedure is estimated to be less than 10%.
Results
Mid-rapidity
Shown in Fig. 7 are deuteron invariant multiplicities for the 4% highest collisions as a function of and with bin widths of 20 MeV in and 0.1 in . The invariant multiplicity is flat as a function of and over most of the measured range.
In Figure 8 are shown the measured invariant multiplicities of 3H and 3He for the same centrality. Plotted is the differential cross section at the center of the bin assuming an underlying thermal distribution with a shape similar to what is measured †††The resulting slope and magnitude of the spectra was found to be insensitive to a wide range or reasonable assumptions of the true distribution in the acceptance correction.. The resulting measured cross section is not affected significantly by the assumed distribution. The distributions are presented as a function of rapidity for two regions. The error bars reflect the statistical uncertainty in the fit procedure and do not include the systematic errors, estimated to be about for both 3He and 3H, dominated by the uncertainty in the assumed background.
Beam-rapidity
In Figure 9 are shown invariant multiplicities for deuterons at beam rapidity () for the 4% and 10-20% highest events. As noted above, deuterons at beam rapidity are easily extracted from the mass-squared distribution. The transverse momentum distribution of beam rapidity deuterons for the 4% highest are distinctly harder, i.e. show a larger inverse slope parameter, than deuterons from the lower collisions. Over the range in in which we measure, a fit to an Boltzmann distribution in the 3.0-3.1 rapidity bin gives MeV and MeV for the 4% and 10-20% bins, respectively. However, the reduced of each of these fits is greater than 4, implying a Boltzmann shape does not describe the measured distributions well.
In beam rapidity 4He spectra are shown in Figure 10. In the lower range (10-20%), the 4He yield is a factor of 10 higher than for the higher (4%), indicating that beam rapidity 4He are primarily produced by projectile fragmentation.
Model Comparisons
Light nuclei from heavy-ion collisions have historically been studied via a coalescence model [2, 15] which assumes cluster formation takes place at freeze-out. Since the binding energy of the deuteron is MeV, it is easily broken apart in the fireball region where current models estimate the temperature to be 120-150 MeV [16, 17]. In the coalescence formulation [15] the probability of forming a deuteron is greatest when a proton and neutron at freeze-out have a small relative momentum. Assuming that the proton and neutron distributions are similar, the deuteron momentum distribution is then given by
| (7) |
where the particle momenta obey which can be easily generalized to heavier fragments with mass number as
| (8) |
where . In eqns. 7 and 8, ( in the case of the deuteron) is a phenomenological parameter known as the coalescence constant. In proton-nucleus collisions has been related to the interplay between the binding energy of the deuteron and the optical potential of the target nucleus [15]. For nucleus-nucleus collisions it was recognized that the idea of a nuclear optical potential was no longer meaningful and Schwarzschild and Zupančič [2] expressed the coalescence parameter in terms of a momentum difference . A proton and neutron would coalesce to form a deuteron if, at freeze-out, their momenta differ by less than . More generally, for the case of a source of Z protons and N neutrons with mass number of the cluster A,
| (9) |
where is the spin of the cluster and is the neutron to proton ratio in the source. Therefore, the coalescence parameter in these models is simply related to the momentum difference between corresponding protons and neutrons and is described by a simple step function in the coalescence probability at . Note that no dependence on the colliding system exists in this model which described deuteron and 3H/3He production very well in nucleus-nucleus reactions at Bevalac [18, 19] energies (about GeVA) and in p-nucleus collisions, at FNAL [20] energies. For all of these energies, only a single constant was needed to describe the light fragment distributions based on proton spectra in minimum bias collisions. However, for nucleus-nucleus collisions at AGS energies and above a dramatic drop below the Bevalac values in the coalescence parameter and a strong dependence on the centrality of the collision [5, 21] was observed. For beam energies where nuclear collisions produce a large number of secondary particles, i.e. AGS energies and above, was no longer independent of beam energy or composition presumably because the source decoupled at a size larger than the mean size of a deuteron, fm [22]. In this case, was theoretically deduced to be inversely proportional to the volume of the source at freeze-out. In the model of Sato and Yazaki [1], for example,
| (10) |
where is the Gaussian wave function parameter for a deuteron and is directly related to the radius of the system at freeze-out by
| (11) |
where , and are the Gaussian radii. Other models [3] also utilize a wave-function description and a density matrix formalism to describe deuteron formation. With the exception of large cascade codes [22, 24] as well as recent hydrodynamically motivated source parametrizations [25], however, none of them explictely account for transverse collective expansion. Though such an approach is not excluded from the Sato and Yazaki approach [1], nothing beyond sources with no space-momentum correlations were considered in their presentation. Further, though there have been some attempts at a fully relativistic treatment of coalescence [26], this generalization is non-trivial because of difficulties in the proper relativistic treatment of bound states [3].
Coalescence Parameter
The coalescence parameter, as defined in Eq. 7, can be calculated from E877 measurements of protons [6] and deuterons. To properly calculate for our data set, the fraction of protons from decays must be subtracted from the measured proton spectra in order to obtain the proton distribution at freeze-out. This correction was performed utilizing the measured yield in Au+Au collisions [27] and knowledge of the acceptance and reconstruction efficiency of the experimental apparatus. Over the measured acceptance region, the hyperon contribution to the proton spectra was found to be no more than 10%.
After correcting for hyperon contributions, can be calculated as a function of and y. We notice, within the acceptance of the present measurement, no variation of as a function of . However, there is a significant rapidity dependence of the average for all measured as shown in Figure 11. If is related to volume at freeze-out, such a result may imply a changing effective freeze-out volume as a function of rapidity. The measured change in of nearly a factor of two from mid-rapidity to would correspond to a decrease in the effective source radius of .
Figure 12 shows a comparison of the coalescence parameter deduced from experiments at Bevalac [18, 19] energies with those obtained at the AGS in in Si + Al [5], Si + Pb [28], Au + Pt [29], and Au + Au [30] collisions. The error on the Au+Au data point corresponds to the minimum and maximum range of values shown in Figure 11 including the statistical error bars. All presently measured values of for high Au+Au collisions are significantly lower than the results for Si+Al and Si+Pb. This is consistent with the interpretation that depends on the volume at freeze-out. Two proton and two pion correlations measurements have found that the effective nucleon source size is larger for the Au+Au system than for lighter systems [8, 9].
The coalescence parameter measured in these collisions is nearly one-tenth of that measured in central Au+Au collisions at Bevalac, implying in the models of [1, 23] that the volume at feeze-out in AGS Au+Au collisions is five to ten times that at Bevalac energies. Such a simple geometrical interpretation would be inconsistent with two particle correlations measured at the AGS [9, 8].
A possible reason for such an inconsistency is that the models which deduce an inverse volume dependence [1, 23] do not account for collective motions in the source. As has been shown in [32], the yield of deuterons is highly dependent on the amount of collective motion in the source. Hence, is not simply related to the volume but also the position-momentum correlations at freeze-out. If the source is perfectly correlated, then proton-neutron pairs that freeze-out near one another in space will have similar momentum vectors. The deuteron yield would be larger in this case than for a random source. As such, any consistent model of deuteron production must account for correlations in the source.
Therefore, in order to completely describe deuteron production, a more sophisticated model of the source that includes dynamical correlations must be formulated. In large cascade codes it is difficult to study the influence of the source parameters. We thus used a simple dynamical model in the following section to study such effects.
In Fig. 13 is the corresponding coalescence parameter for 3H and 3He extracted from this data set compared with Bevalac [18], AGS [5, 30], and SPS [31] values. Similar to what is observed in , the three nucleon coalescence parameter drops dramatically at AGS energies, consistent with an increase in the effective source size.
A Dynamical Model for Deuteron Formation
An analytic, hydrodynamically motivated model, devised by Chapman, et al. [33] has been implemented to describe the particle source distribution in heavy ion collisions [34]. This model uses an emission function () for a finite, expanding, locally thermalized source
| (12) |
where and are the position and momentum 4-vectors, respectively. The source includes longitudinal and transverse collective motion with an underlying temperature, given by
| (13) |
where
In this model is the freeze-out position four vector, and and are the longitudinal velocity and transverse mass, respectively. is the transverse momentum and is the transverse flow velocity. Furthermore, , and describe the respective Gaussian widths of the proper time, longitudinal velocity and one dimensional Gaussian radius. For more information on the source function, see [33, 34].
To determine deuteron yields with this framework, a program devised by R. Mattiello [32, 36] was implemented. It utilizes a method that has been applied to bombarding energies from 1 GeV per nucleon in association with the the intranuclear cascade model and QMD [37] up to AGS and SPS energies with the cascade models RQMD [32, 36] and ARC [24]. In this approach, the number of deuterons is given by a summation over all proton and neutron pairs at freeze-out accounting for the Wigner density of the Hulthén deuteron wave function [22]. This method is equivalent to the density matrix formalism of Sato and Yazaki [1] in the case of a static source. Therefore, by projecting the neutron/proton position-momentum distribution on the deuteron wave-function via this Wigner method, we may determine the distribution of deuterons in phase-space given any particular source of nucleons.
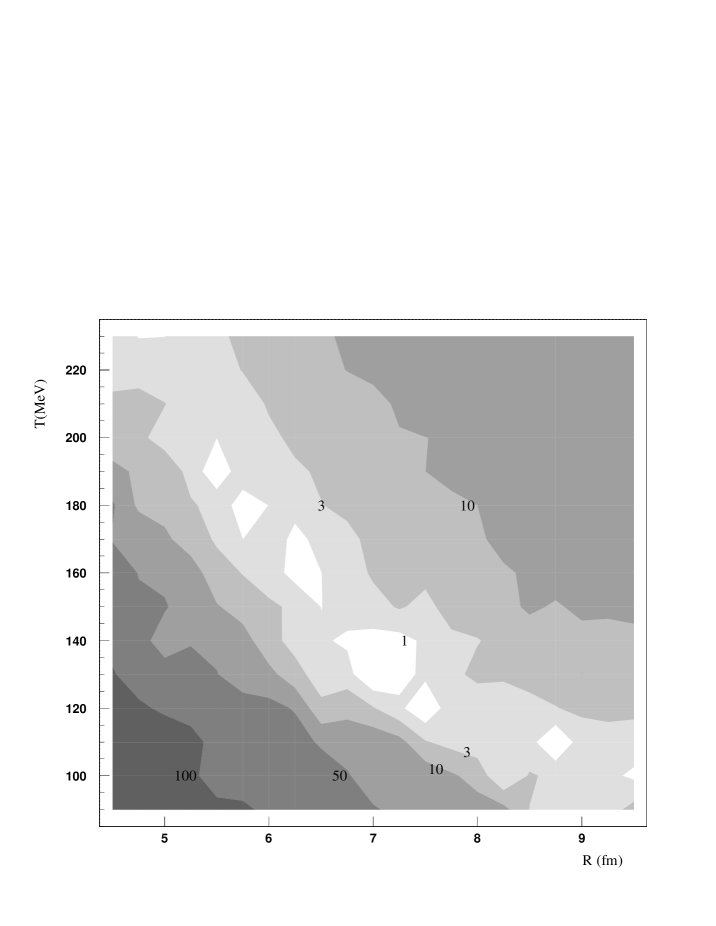
Shown in Figure 14 is the distribution of the reduced minus the minimum () with respect to the measured deuteron yields calculated as a function of and with a resolution of 10 MeV and 0.25 fm respectively. For this study we assume that fm/c and fm/c in Eqn. 13. ‡‡‡For SPS energies, fm/c from two particle correlations [34, 35] while [25] noted that fm/c. Similar numbers for AGS energies have not been published. The technique we utilize for mapping out this space is the following: For each value of temperature and one dimensional Gaussian radius , the transverse and longitudinal proton spectra uniquely define the transverse () and longitudinal () boost velocities. Every value of and in Figure 14 can describe the proton transverse momentum spectra given a particular at mid-rapidity.
We have found that the proton rapidity distribution in this model poorly reproduces the data [6, 38], with a reduced on the order of 10 for all choices of , and . Furthermore, the shape of the transverse momentum distribution of nucleons in this model is assumed to be constant as a function of rapidity, in conflict with experimental data [6]. The assumptions inherent in the model [33] regarding a hydrodynamical source are not entirely valid for nucleons at AGS energies due to these complications in the longitudinal direction. Therefore, in the studies presented here we only consider the nucleon production at mid rapidity and implement this model by fitting to the proton distribution only at mid-rapidity and constrain to approximate the rapidity distribution. The deficiencies in the model near beam-rapidity should not influence the results we show here for mid-rapidity and indeed the model describes the transverse momentum distribution at mid-rapidity quite well ().
For this analysis, the proton spectra from E866 Au+Au collisions [38] are utilized due to their coverage of protons at mid-rapidity. The model is therefore fit with these two parameters to the proton spectra. After the proton distribution is determined, the deuteron yields at mid-rapidity are calculated with the coalescence algorithm described above. Results are compared to deuterons measured by E877 at mid-rapidity and GeV/c.
The resulting distribution strongly constrains the temperature and transverse radius in this model of the nucleon source though the two variables are highly correlated. Studies of proton correlations for the Au+Au system at AGS energies [8] concluded there was an increase of the transverse freeze-out distribution of nucleons beyond the Au rms radius of 3.1fm. This is consistent with the current results where all reasonable values of temperature result in a value of the transverse radius significantly larger than the rms radius of a Au nucleus. Furthermore, measures of the temperature at freeze-out in Au+Au collisions at the AGS [16, 17] of 120-150 MeV are also consistent with the results of this study.
Note, however, that this method has not constrained or . Varying these attributes from the values chosen above by a factor of two can vary the yield of deuterons by 10%. An increase in either or would decrease the yield of deuterons in the model and, as a result, would shift the curve of Figure 14 to lower temperatures and radii. Therefore, deuterons cannot be used to exclusively determine source parameters but must be used in conjunction with complimentary observables to produce a coherent view of the source.
Conclusions
We have measured light fragment yields at both mid and beam rapidities. Invariant multiplicities have been presented for deuterons, 3H, and 3He at mid-rapidity. Deuterons at mid-rapidity have been interpreted in a coalescence framework. The resulting coalescence parameter () is consistent with an increase in source size from collisions of lighter nuclei at the same energy. However, a clear dependence on rapidity of implies the assumption of a constant effective volume as a function of rapidity is incorrect.
We have introduced a technique for using deuterons as a sensitive constraint on source parameters in a heavy ion collision by incorporating a simple, hydrodynamically motivated nucleon source function at mid-rapidity coupled with a coalescence algorithm. The results show that deuteron yields are sensitive to a convolution of volume and collective effects, similar to other correlations measurements. These results can be used in conjunction with other measures of the source to tightly constrain theoretical models and assumptions.
First measurements of beam rapidity deuterons and 4He at AGS energies have also been made. The resulting distributions have a strong dependence, consistent with a production mechanism dominated by spectator fragmentation.
Acknowledgements
We thank the BNL AGS and tandem operations staff and Dr. H. Brown for providing the beam. This work was supported in part by the U.S. DoE, the NSF, the NSERC, Canada and CNPq, Brazil.
We are grateful to Dr. R. Mattiello, who provided the coalescence code utilized in this study and to Drs. J. H. Lee and C. Chasman for providing us with the results of proton distribution measurements made by the E866 collaboration.
REFERENCES
- [1] H. Sato and K. Yazaki, Phys. Lett. B 98 (1981) 153.
- [2] A. Schwarzschild and Č. Zupančič, Phys. Rev. 129 (1963) 854.
- [3] S. Mrówczyński, J. Phys. G 13 (1987) 1089.
- [4] S. Mrówczyński, Phys. Lett. B 277 (1992) 43.
- [5] J. Barrette et al. (E877 Collaboration), Phys. Rev. C 50 (1994) 3047; Phys. Rev. C 50 (1994) 1077.
- [6] R. Lacasse et al. (E877 Collaboration), Nucl. Phys A 610 (1996) 153c; T. Piazza, PhD thesis, SUNY at Stony Brook (1997); R. Lacasse, PhD thesis, McGill University (1997).
- [7] J.P. Wessels for the E877 Collaboration, Nucl. Phys. A 638 (1998) 69c.
- [8] J. Barrette et al. (E877 Collaboration), submitted to Phys. Rev. C; S. Panitkin, PhD thesis, SUNY at Stony Brook (1997).
- [9] J. Barrette et al. (E877 Collaboration), Phys. Rev. Lett. 78 (1997) 2916.
- [10] J. Barrette et al. (E877 Collaboration), Phys. Rev. C 55 (1997) 1420; J. Barrette et al. Phys. Rev. C 59 (1999) 884.
- [11] J. Barrette et al. (E877 Collaboration), Phys. Rev. Lett. 70 (1993) 2996.
- [12] R. Bersch, MSI thesis, SUNY at Stony Brook (1995).
- [13] R. Lacasse, et al., Nucl. Instr. Meth. A 408 (1998) 408.
- [14] S.C. Johnson, PhD thesis, SUNY at Stony Brook (1997).
- [15] S. T. Butler and C. A. Pearson, Phys. Rev. 129 (1963) 836.
- [16] P. Braun-Munzinger, J. Stachel, J.P. Wessels, and N. Xu, Phys. Lett. B344 (1995) 43; Phys. Lett. B365 (1996) 1.
- [17] E. Schnedermann, J. Sollfrank, and U. Heinz, Phys. Rev. C 48 (1993) 2462.
- [18] S. Nagamiya et al., Phys. Rev. C 24 (1981) 971; Lemaire et al., Phys. Rev. Lett. 37, (1976) 667; R. L. Auble et al., Phys. Rev. C 28 (1983) 1552.
- [19] S. Wang et al. (EOS Collaboration), Phys. Rev. Lett. 74 (1995) 2648.
- [20] J. W. Cronin, H. J. Frisch, M. J. Shochet, J. P. Barmond, P. A. Piroué, and R. L. Sumner, Phys. Rev. D 11 (1975) 3105.
- [21] J. Simon-Gillo for the NA44 collaboration, Nucl. Phys. A 590 (1995) 483c; S. Kabana for the NA52 collaboration, Nucl.Phys A 638 (1998) 411c.
- [22] J. L. Nagle, B. S. Kumar, D. Kusnezov, H. Sorge, and R. Mattiello, Phys. Rev. C 53 (1996) 367.
- [23] A.Z. Mekjian, Phys. Rev. C 17 (1978) 1051; Nucl. Phys. A 312 (1978) 491.
- [24] D. E. Kahana, S. H. Kahana, Y. Pang, A. J. Baltz, C. B. Dover, E. Schnedermann, and T. J. Schlagel, Phys. Rev. C 54 (1996) 338.
- [25] R. Scheibl and U. Heinz; Phys. Rev. C 59 (1999) 1585.
- [26] C. B. Dover U. Heinz, E. Schnedermann, and J. Zimanyi, Phys. Rev. C 44(1991) 1636.
- [27] S. Ahmad et al. (E895 Collaboration), Phys. Lett. B 382 (1996) 35.
- [28] T. Abbott et al. (E802 Collaboration), Phys. Rev. C 50 (1994) 1024.
- [29] N. Saito et al. (E886 Collaboration), Phys. Rev. C 49 (1994) 3211.
- [30] M. J. Bennett et al. (E878 Collaboration), Phys. Rev. C 58 (1998) 1155.
- [31] M. Weber for the NA52 Collaboration, Quark Matter 1999 proceedings, to be published in Nucl. Phys. A.
- [32] R. Mattiello, A. Jens, H. Sorge, H. Stöcker, W. Greiner, Phys. Rev. Lett. 74 (1995) 2180.
- [33] S. Chapman, J.R. Nix, and U. Heinz, Phys. Rev. C 52 (1995) 2694.
- [34] U.A. Wiedemann, B. Tomasik, and U. Heinz, Nucl. Phys. A638 (1998) 475c; B. Tomasik, U. Heinz, U.A. Wiedemann, and Y.-F. Wu, Acta Phys. Slov. 47 (1997) 81.
- [35] H. Appelshäuser et al. (NA49 Collaboration), Eur. Phys. J. C2 (1998) 661.
- [36] R. Mattiello, H. Sorge, H. Stöcker, and W. Greiner, Phys. Rev. C 53 (1997) 1443.
- [37] E.M. Remler, Ann. Phys. 136 (1981) 293; M. Gyulassy, K. Frankel, and E.M. Remler, Nucl. Phys. A 402 (1983) 596; J. Aichelin, A. Rosenhauer, G. Peilert, H. Stöcker, and W. Greiner, Phys. Rev. Lett. 58 (1987) 1926.
- [38] L. Ahle et al., Phys. Rev. C 57 (1998) R466.