[
Negative heat capacity in the critical region of nuclear fragmentation: an experimental evidence of the liquid-gas phase transition
Abstract
An experimental indication of negative heat capacity in excited nuclear systems is inferred from the event by event study of energy fluctuations in quasi-projectile sources formed in collisions at 35 A.MeV. The excited source configuration is reconstructed through a calorimetric analysis of its de-excitation products. Fragment partitions show signs of a critical behavior at about 5 A.MeV excitation energy. In the same energy range the heat capacity shows a negative branch providing a direct evidence of a first order liquid gas phase transition.
]
Phase transitions are the prototype of a complex system behavior which goes beyond the simple sum of individual properties [1]. In macroscopic systems the thermostatistical potential presents non analytical behaviors which unambiguously marks a phase transition. Non analytical behaviors of infinite systems originate from anomalies of the thermostatistical potentials in finite systems [2, 3]. Specifically in microcanonical finite systems, the entropy is known to present a convex intruder in 1-st order phase transitions associated to a negative heat capacity between two poles. A 2-nd order phase transition is characterized by the merging of the two poles.
The experimental study of phase transitions in finite systems has recently attracted a strong interest from various communities. Bose condensates with a small number of particles [4], melting of solid atomic clusters [5], vaporization of atomic nuclei [6] are examples of attempts to study phase transitions in finite systems. The problem usually encountered with these small systems is how to control the equilibrium and how to extract the thermostatistical variables from observable quantities in order to identify the possible phase transition. This is for instance the case in heavy ion reactions in which excited nuclear systems are formed. Comparing the observed decay channels with statistical models [2, 7] it seems that a certain degree of equilibration is reached [8, 9] but up to now it has not been possible to unambiguously identify the presence of the expected liquid-gas phase transition.
It has recently been shown [3] that for a given total energy the average partial energy stored in a part of the system is a good microcanonical thermometer while the associated fluctuations can be used to construct the heat capacity. In the case of a phase transition anomalously large fluctuations are expected as a consequence of the divergence and of the possible negative branch of the heat capacity. Let us consider an equilibrated system which can be decomposed into two independent components so that the energy is simply the sum of the two partial energies and that the total level density is the folding product of the two partial level densities .
An example of such a decomposition is given by the kinetic and the potential energies in the absence of velocity dependent interactions.
The probability distribution of the partial energy is peaked on a most probable energy partition which requires the equality of the two microcanonical temperatures , of the two subsystems (). The fluctuations [1] around a maximum of are given by
| (1) |
where: are the heat capacities calculated for the most probable energy partition ().
The heat capacity reads:
| (2) |
In the absence of a phase transition because of the microcanonical constraint one expects the fluctuations to be smaller than the canonical expectation and the total heat capacity to be positive. Phase transitions are signed by poles and negative heat capacities corresponding to anomalously large fluctuations .
A word of caution is here necessary. Convex intruders are expected for phase transitions of systems characterized by a unique extensive observable e.g. the total energy, as for example in the case of the melting transition which is characterized by a symmetry breaking. In the liquid-gas case, since the volume is directly related to the order parameter it should be considered as another extensive variable. In the experimental situation, since the break up volume is at best known only in average, the pressure, interpreted as the Lagrange multiplier associated with the volume observable, appears to be the relevant state variable together with the total deposited energy. In such a case the energy fluctuations are related to and a convex intruder is expected. In principle one could argue that the same information on the heat capacity can be obtained by taking the derivative of the correlation between the temperature and the excitation energy (the so called caloric curve). We want to stress that fluctuations are a characteristic of the state and so depend on the pertinent state variable while the caloric curve depends upon the specific thermodynamical transformation from one state to another. Therefore, the information obtained by taking the derivative of the measured caloric curve may differ from the information coming from the fluctuations.
Here we report on a study on the de-excitation properties of quasi-projectiles formed within an excitation energy range from 1 to 8 A.MeV. The experiment was performed at the K1200-NSCL Cyclotron of the Michigan State University. Beams of ions at 35 A.MeV incident energy were used to bombard foils. The MULTICS and MINIBALL arrays were coupled to measure light charged particles and fragments with a geometric acceptance greater than 87% of . For experimental details see ref. [9]. Peripheral collisions of a predominantly binary character have been selected by requiring the velocity of the largest fragment in each event to be at least 75% of the beam velocity. For each event, the fragments were considered as originating from the quasi-projectile if forward emitted in the centre of mass reference frame. The contribution of light particles is then added. To avoid pollution from other sources than the quasi-projectile, the backward emitted particles are substituted by the symmetric of the forward emission in the quasi-projectile reference frame. Only events where the total source charge is within 10% of the original charge have been taken into account, to deal with comparable finite size effects over the whole excitation energy range. The total excitation energy of the source is measured from calorimetry on an event by event basis. This allows a sorting of the events as a function of energy as in the microcanonical statistical ensemble.
A necessary condition for the application of statistical equilibrium concepts is spherical symmetry in momentum space, which can be verified by looking at the fragment angular distribution in the reaction plane. As an example Fig.1 displays the fragment () angular distribution in the source reference frame for different intervals of the excitation energy. The observed isotropy in the source rest frame (only slightly affected in the backward hemisphere by the experimental acceptance) is a guarantee of the quality of the source reconstruction analysis [9].
Indications of the possible occurrence of a phase transition can be seen in the critical behavior of the fragment partitions. Specifically, in the vicinity of a second order phase transition (in infinite systems), partitions follow a finite size scaling characterized by two independent critical exponents. This generic behavior allows to classify critical systems in various universality classes which depend upon few characteristics such as the dimensionality of the space and of the order parameter. In the same class, various systems present a similar phenomenology and in particular identical critical exponents.

Experimentally, information on critical exponents can be inferred from the analysis of the Campi scatter plot which gives the correlation between the heaviest fragment produced in each event and the corresponding second moment of the charge distribution [10, 11]. This plot, presented in Fig. 2a) for our data, shows two branches characteristic of a subcritical regime and a supercritical one. The zone where the two branches join corresponds to the critical region. The critical exponents can be extracted from the mean values of the moments of the Campi plot, giving . Fig. 2 b) [12] shows the charge distribution in the critical region of the Campi plot (events falling into the selected area). One can recognize the critical distribution in the form of a power law of exponent in agreement within the errors with the value of , according to the scaling relation . Similar results were already found by the EOS collaboration [13].
A qualitative indication that the observed phase transition has a thermodynamical origin comes from the fact that, in the subcritical regime, an exponent can be obtained by fitting with a power law the charge of the heaviest fragment as a function of the excitation energy per nucleon of the quasi-projectile (Fig.2c)), which means that can be considered as a critical parameter.
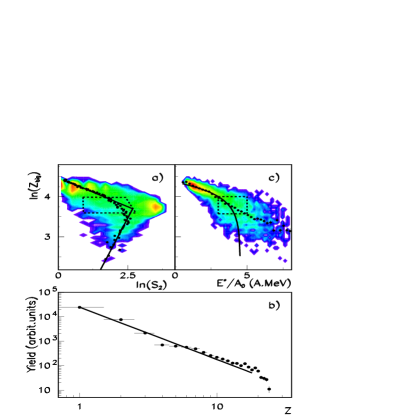
The solid symbols represent the mean correlation. The full lines are fits resulting from power-law behaviors.
The extracted values of the critical exponents are perfectly compatible with a liquid-gas transition but also with a geometrical percolation type of transition. Moreover, as found in the Lattice Gas Model [14] for finite systems, a critical behavior in fragment observables can also be consistent with a phase coexistence of a 1-st order phase transition. Indeed in the coexistence region of small systems the liquid cluster is not much larger than the vapor fragments and may mimic critical fluctuations of the mass distribution with approximately the same critical exponents as at the critical point. In other words the analysis of the charge distribution in terms of critical behavior and critical exponents is a sign of a phase transition but does not allow to determine the corresponding universality class nor the associated order. Therefore, a more direct information about the order of the transition is mandatory.
To further progress on this point we shall now examine the partial energy fluctuations which are a direct observable to explicitly test thermodynamical equilibrium and extract thermodynamical state variables from the experimental data. In order to exploit eq.(2), one has to find a suitable decomposition of the total energy into and . In the case of nuclear fragmentation data, the repartition of the total energy is complicated by the fact that thermal equilibrium fragments are produced hot, while the detected fragments are collected at infinity after secondary de-excitation, with lower mass. Moreover, because of the presence of the long range Coulomb interaction, asymptotic kinetic energies have to be corrected from the Coulomb boost. To take into account these distortions, primary partitions have been reconstructed by applying the energy balance at the production time event by event:
| (3) |
where is the mass of the source, the excitation energy calculated via calorimetry, and the energy can be chosen as:
| (4) |
Here is the mass excess of primary fragment , is the event multiplicity at the production time, and is the Coulomb energy of the partition.
The primary masses have been obtained by sharing the charge detected in the form of light particles and neutrons among the detected fragments, following two extreme freeze-out hypotheses [2, 7]. In the first assumption primary fragments () have a charge-to-mass ratio as in the entrance channel, so that they de-excite only through neutron evaporation and all the light charged particles are considered as primary. In the second hypothesis the totality of both neutrons and light charged particles is shared among final fragments.
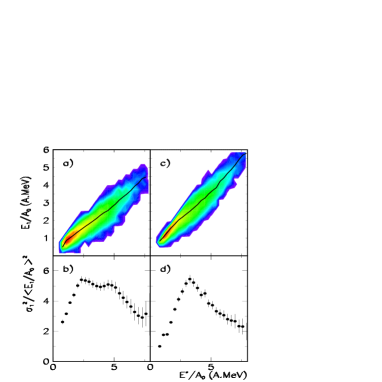
The experimental correlation between the partial energy and the excitation energy per nucleon of the source is shown in Fig.3a), c) for the two freeze-out hypotheses. The normalized variance of , in bins of , is represented in Fig.3b), d). The two freeze-out hypotheses are in qualitative agreement, and the presence of peaks of Fig.3 b, d) indicate a phase transition governed by the equilibrium between the kinetic and potential degrees of freedom [3], a thermodynamical phase transition, in both cases. Finally, the actual microcanonical temperature can be obtained from by inverting the kinetic equation of state
| (5) |
where is the fragment dependent level density parameter. The brackets indicate the average on the events with the same . This also allows the extraction of the kinetic heat capacity obtained by taking the numerical derivative of with respect to .
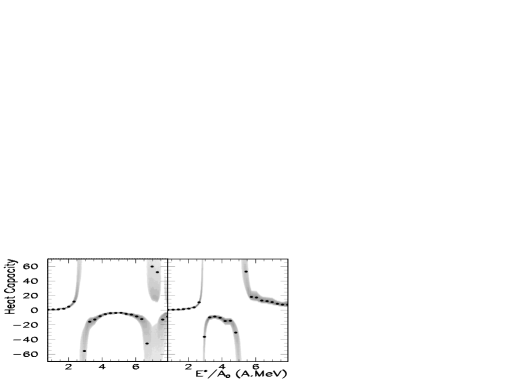
Fig.4 shows from eq.(2). The distribution in Fig.4 takes into account the uncertainties in the numerical derivatives of eq.(5) as well as statistical errors.
A clear negative branch appears pointing to a 1-st order liquid-gas phase transition, the distance between the poles being associated with the latent heat. From Fig.s 3 and 4 it is also apparent that the freeze-out hypothesis is not crucial for our main conclusions, if we do not pretend to give a quantitative evaluation of the latent heat. The persistency of the signal has been checked against variations of the excitation energy bin and the different hypotheses on the energy reconstructions such as the number and energy of the (undetected) neutrons.
This phenomenon predicted as a specific feature of 1-st order phase transitions in finite systems in the microcanonical ensemble [15] to our knowledge was never experimentally observed insofar.
It is important to remark that the thermodynamical transition energy interval corresponds to the critical region of the Campi scatter plot: the observation of power laws and critical behaviors in the fragment charge distribution is directly correlated to the occurrence of anomalous fluctuations indicating a negative heat capacity. These two pieces of informations which correspond to the theoretical expectations [14, 3, 15] indicate that a thermodynamical first order phase transition has taken place in finite nuclear systems formed in nuclear reactions.
The authors would like to acknowledge the Multics-Miniball collaboration, which has performed the experiment. Stimulating discussions with the Indra collaboration are warmly acknowledged. This work has been partially supported by NATO grants CRG 971512 and by grants of the Italian Ministry of University and Scientific and Technological Research (MURST).
REFERENCES
-
[1]
S-K. Ma, Statistical Mechanics, World Sci. 1985;
M. Toda, R. Kubo, N. Saito Statistical Physics I, Springer Verlag 1992. - [2] D.H.E. Gross, Rep. Prog. Phys. 53, 605 (1990); Phys. Rep. 279, 119 (1997).
- [3] P. Chomaz and F. Gulminelli, Nucl. Phys. A647, 153 (1999).
-
[4]
T. Hijmans, Physics World 12, 20 (1999);
A. I. Safanov et al., Phys. Rev. Lett. 81, 4545 (1998);
T. Greytak et al., Phys. Rev. Lett. 81, 3811 (1998). -
[5]
M. Schmidt at al., Phys. Rev. Lett. 79, 99 (1997);
Nature 393, 238 (1998);
A. Bonasera, Physics World 12, 20 (1999). -
[6]
M.F. Rivet et al., Phys. Lett. B388, 219 (1996);
B. Borderie et al., Phys. Lett. B388, 224 (1996). - [7] J.P. Bondorf, A.S. Botvina, A.S. Iljinov, I.N. Mishustin, K. Sneppen, Phys. Rep. 257, 133 (1995).
-
[8]
M. D’Agostino et al., Phys. Lett. B371, 175 (1996);
N. Marie et al., Phys. Lett. B391, 15 (1997);
P. Desesquelles et al., Nucl. Phys. A633, 547 (1998);
J. P. Wieleczko et al., Phys. Lett. B (1999) in press. - [9] M. D’Agostino et al., Nucl. Phys. A (1999) in press.
- [10] P. F. Mastinu et al., Phys. Rev. Lett. 76, 2646 (1996).
- [11] M. Belkacem et al., Phys. Rev. C54, 2435 (1996).
- [12] In fig. 2 b) the largest fragment in each event has been excluded from the plot.
- [13] J.B. Elliott et al.Phys.Lett. B418, 34 (1998) and references quoted therein.
- [14] F. Gulminelli and Ph. Chomaz, Phys. Rev. Lett. 82,1402 (1999).
- [15] D.H.E. Gross et al., Zeit. fur Phys. D39, 75 (1997).