Study of supernarrow dibaryon production in process
Abstract
The reactions and at 305 MeV are studied with the aim to search for supernarrow dibaryons. The experiments were carried out at the Moscow Meson Factory using a spectrometer TAMS, which detected two charged particles at various angles. Narrow structures in missing-mass spectra at 1905 and 1924 MeV have been observed. An analysis of the angular dependence of the experimental data shows that the resonance at =1905 MeV most likely corresponds to the production of the isovector supernarrow dibaryon.
Recently, a number of works have appeared in which narrow dibaryons were searched for in experiments on collisions of the nucleon and a few-body system at intermediate energies [1].
Early, we carried out measurements of missing-mass spectra in the reactions and at an incident proton energy of 305 MeV [2] using a double-arm spectrometer. The narrow structure in the missing-mass spectrum at 1905 MeV with a width equal to the experimental resolution 7 MeV was observed in this experiment.
Now, we present further results of the study of the reactions under consideration with the improved facility. The experiments were performed with the proton accelerator of the Moscow Meson Factory at 305 MeV. A proton beam alternately bombarded CD2 and 12C targets. The -reaction contribution was determined by subtraction of the 12C spectrum from the CD2 one. The two-arm spectrometer TAMS detected the scattered proton in coincidence with the second charged particle ( or ).
The left movable spectrometer arm, being a single telescope , was used to measure the energy and time of flight of the scattered proton at (or in another run). The right fixed arm detected the proton or the deuteron from the expected dibaryon decay. It consisted of three telescopes, which were located at , , and . These angles correspond to the directions of motion of the produced dibaryons with the chosen mass ranges. Each telescope included a full absorption detector and two thin plastic detectors for a time-of-flight measurement. A trigger was generated by a coincidence of the detector signals of the left arm with those of any right-arm telescope. Selected by a coincidence, the -signals of the scattered proton form its energy spectrum and, accordingly, a missing-mass spectrum. The spectrometer was calibrated using the peak of elastic scattering [3].
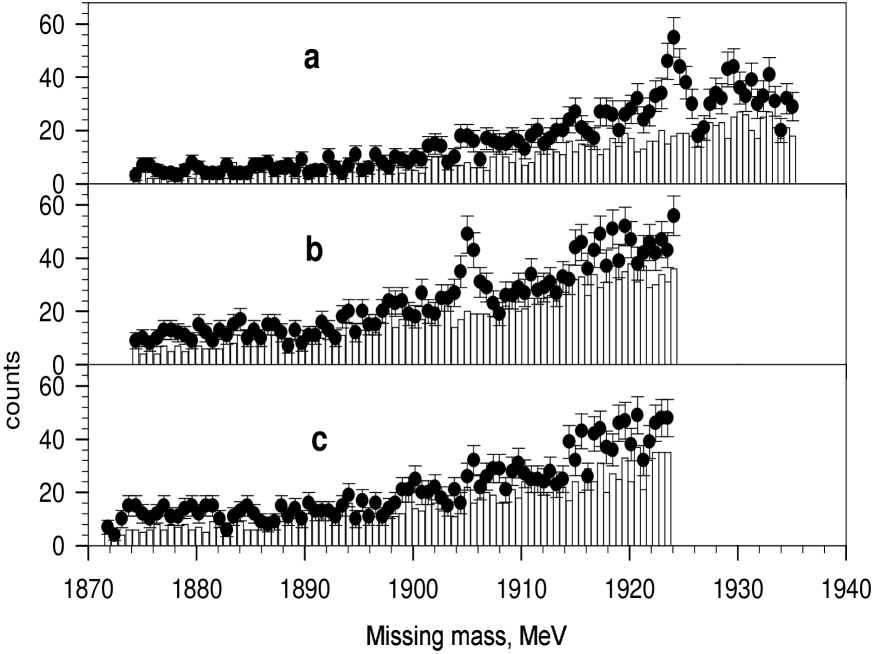
The experimental missing-mass spectra obtained on the targets of deuteried polyethylene and carbon are shown in Figs. . Each spectrum corresponds to a certain combination of outgoing angles of the scattered proton and the second charged particle. These combinations in Figs. and are consistent with the change in the emission angle of a dibaryon with the given mass when the angle is equal to or . As evident from Fig. 1, resonance-like behavior of the spectra is observed in two mass regions for the CD2 target, while the spectra for the carbon target are smooth enough [4].
There are events in the peak at MeV which is shown in Fig. . The statistical significance of this resonance is 4.5 standard deviations. The spectrum in Fig. shows the other peak with the mass MeV containing events. The statistical significance of this structure is 4.7 S.D. The widths of both observed peaks correspond to the experimental resolution (3 MeV). The peak at 1924 MeV was only obtained for one spectrum close to the upper limit of the missing mass. In the other cases, this mass position was out of the range of measurement. Therefore, in the present work, we restrict ourselves only to an analysis of the peak at 1905 MeV.
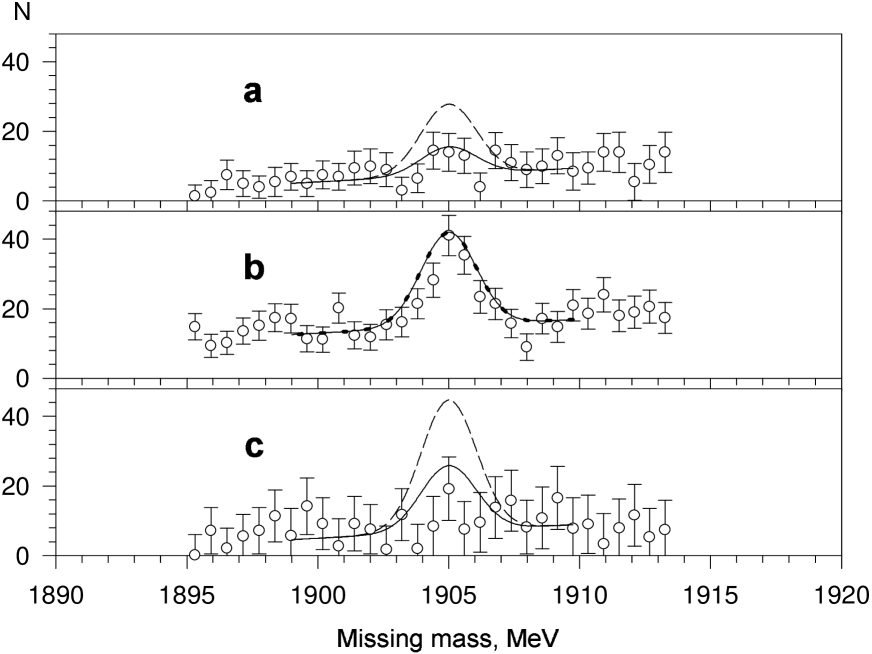
The experimental missing-mass spectra in the range of 1895–1913 MeV, after subtracting the carbon contributions, are shown in Figs. .
As seen from Figs. 1 and 2, the resonance behaviour of the cross section exhibits itself in a limited angular region.
If the observed structure at MeV corresponds to a dibaryon decayed mainly into two nucleons, then the expected angular cone size of the emitted nucleons would be about 50∘. Moreover, the angular distributions of the emitted nucleons are expected to be very smooth in the angle region under consideration. Thus, even assuming the dibaryon production cross section to be equal to an elastic scattering one (40 b/sr), their contribution to the missing-mass spectra in Fig. would be nearly the same and would not exceed a few events. Hence, the found peaks are hardly interpreted as a manifestation of the formation and the decay of such states.
In [5, 6, 7, 8] supernarrow dibaryons were considered, whose decay into two nucleons is suppressed by the Pauli exclusion principle. Such states with a mass ( and are the masses of the nucleon and the pion) can decay mainly with a photon emission.
Using the Monte Carlo simulation, we estimated the contribution of the supernarrow dibaryons with different quantum numbers and =1905 MeV to the mass spectra at various angles of the left and right arms of our setup. The production cross section and branching ratio of these states were taken from [2]. The obtained results are listed in the table.
| Dibaryon mass MeV | ||||||||||
| 3 | 2 | 3 | 2 | 2 | 3 | 3 | 3 | 2 | 1 | |
| 0 | 11 | 5 | 10 | 0 | 1 | 7 | 10 | 0 | 0 | |
| 1 | 1 | 1 | 1 | 1 | 1 | 2 | 1 | 1 | 1 | |
| 0 | 6 | 3 | 5 | 0 | 1 | 4 | 5 | 0 | 0 | |
| 5 | 16 | 24 | 15 | 4 | 14 | 29 | 24 | 7 | 2 | |
| 9 | 36 | 53 | 33 | 8 | 31 | 64 | 52 | 15 | 4 | |
This calculation showed that the angular cone of charged particles emitted from a certain dibaryonic state can be narrow enough. An axe of this cone is lined up with the direction of the dibaryon emission. Therefore, by placing the right spectrometer arm at an expected angle of the dibaryon emission, we essentially increase the signal-to-background ratio.
In Fig. , the experimental spectra are compared with the predicted yields normalized to the maximum of the measured signal in Fig. . The solid and dashed curves in this figure correspond to states with isospin =1 and =0, respectively.
As seen from this figure and the table, the ratios of the calculated contributions to the given spectra are expected to be if the state at 1905 MeV is interpreted as an isovector dibaryon [ or ]. This is in agreement with our experimental data within the errors. On the contrary, the signals from isoscalar dibaryons [ or ] could be observed in Figs. and with the same probability.
The following conclusions could be drawn : 1) as a result of the study of the reactions and , two narrow structures at 1905 and 1924 MeV with widths of less than 3 MeV were observed in the missing-mass spectra; 2) the analysis of the angular dependence of the experimental and theoretical yields of the reactions under consideration showed that the found peak at 1905 MeV can be explained as the manifestation of the supernarrow dibaryons, the decay of which into two nucleons is suppressed by the Pauli exclusion principle; 3) it is most likely that the observed state has a isospin equal to 1.
References
- [1] Komarov E.N., Proc. XI Int. Seminar on High Energy Physics Problem, Dubna, 1994, p.321.
- [2] Fil’kov L.V., Konobeevski E.S., Mordovskoy M.V., Potashev S.I., and Skorkin V.M., Preprint of Institute for Nuclear Research, Russ. Acad. Sci., Moscow, 1996, No. 0923/96.
- [3] J.C. Alder J.C. et al., Phys.Rev. C 6 (1972) 2010.
- [4] Konobeevski E.S., Mordovskoy M.V., Potashev S.I et al., Izv. Akad. Nauk, Ser. Fiz., 62 (1998) 2171.
- [5] Fil’kov L.V., Sov.J.Nucl.Phys. 47 (1988) 437.
- [6] Akhmedov D.M., Fil’kov L.V., Nucl.Phys. A 544 (1992) 692.
- [7] Gerasimov S.B., Ershov S.N., Khrykin A.S., Phys.At.Nucl. 58 (1995) 844.
- [8] Alekseyev V.M., Cherepnya S.N., Fil’kov L.V., Kashevarov V.L., Preprint of Lebedev Inst. of Physics, Russ. Acad. Sci., Moscow, 1996, No 52; Kratk. Soobshch. Fiz., FIAN, No 1 (1998) 28.