Freeze-Out Parameters in Central 158A GeV 208Pb+208Pb Collisions
Abstract
Neutral pion production in central 158A GeV 208Pb+208Pb collisions has been studied in the WA98 experiment at the CERN SPS. The transverse mass spectrum has been analyzed in terms of a thermal model with hydrodynamic expansion. The high accuracy and large kinematic coverage of the measurement allow to limit previously noted ambiguities in the extracted freeze-out parameters. The results are shown to be sensitive to the shape of the velocity distribution at freeze-out.
pacs:
25.75.Dw 24.10.PaHeavy ion reactions at sufficiently high energies produce dense matter which may provide the necessary conditions for the transition from a hadronic state to a deconfined phase, the Quark-Gluon Plasma. Since a finite thermalized system without external containment pressure will necessarily expand, part of the thermal excitation energy will be converted into collective motion which will be reflected in the momentum spectra of the final hadrons. The dynamics of the expansion may depend on the presence or absence of a plasma phase. The strongly interacting hadrons are expected to decouple in the late stages of the collision. Their transverse momentum spectra should therefore provide information about the conditions of the system at freeze-out, in particular about the temperature and collective velocity of the system, if the thermal assumption is valid.
The application of a thermal description is non-trivial. There is no reason to believe neither that chemical and kinetic freeze-out should be identical, nor that there should be unique thermal freeze-out temperatures for all hadrons, nor unique chemical freeze-out temperatures for all flavour changing reactions. It is likely that chemical equilibrium is not fully attained (see e.g. [1]), implying that chemical parameters will also influence momentum spectra through contributions from decays of heavier resonances. Furthermore, it is not obvious that this problem should have a stationary solution since particle emission will occur throughout the full time evolution of the collision and so, in principle, would require a full space-time integration with varying parameters.
Most attempts to extract freeze-out parameters from experiment assume local thermal equilibrium and fit parameterizations of hydrodynamical models to the experimental distributions [2, 3, 4, 5, 6, 7]. Already the earliest analyses [2] noted ambiguities in fitting the hadron transverse mass spectra due to an anti-correlation between the fitted temperature, T, and transverse flow velocity, .
Two-particle interferometric (HBT) measurements provide information on the spatial and temporal extent of the emission volume, but are also sensitive to the collective motion of the source (see e.g. [3, 8, 9]). Within a hydrodynamical parameterization of the source at freeze-out, the transverse two-particle correlations have been shown to be sensitive only to the ratio [3]. Hence HBT analyses have a ambiguity which is roughly orthogonal to that resulting from fits to the single particle spectra. This fact has recently been used by the NA49 collaboration to constrain the freeze-out parameters to lie within the region and MeV for central Pb+Pb collisions [6]. Alternatively, a recent analysis of and distributions and and two-particle correlations measured by the NA44 collaboration for central Pb+Pb collisions using a 9-parameter hydrodynamical model fit [10] gave freeze-out parameters of and MeV. These analyses suggest that a single set of freeze-out parameters can describe the hadron single particle distributions and two-particle correlations, with moderate temperature and large transverse flow velocity.
On the other hand, various thermal model analyses of particle production ratios, especially strangeness production (see e.g. Ref. [11] for a recent summary), have indicated rather high chemical freeze-out temperatures. Use of integrated yields in these analyses allows to obtain conclusions on the temperature which are insensitive to the amount of transverse flow. In a recent analysis of results at SPS energies, including Pb+Pb collisions, good agreement is obtained if partial strangeness saturation is assumed with a chemical freeze-out temperature of about 180 MeV [12].
A successful thermal interpretation of relativistic heavy ion collisions must provide an accurate description of the pion spectra since pions provide the “thermal bath” of the late stages the collision. In this letter we discuss the extraction of thermal freeze-out parameters from the neutral pion transverse mass distribution for central 158A GeV 208Pb+208Pb collisions. These data provide important constraints due to their accuracy and coverage in transverse mass. The analysis of the spectrum, within a particular hydrodynamical model, reveals the importance of the shape of the velocity distribution at freeze-out. The default shape, derived from a Gaussian spatial distribution, favors a large thermal freeze-out temperature, similar to temperatures extracted for chemical freeze-out, but in contradiction to conclusions obtained based on analyses of limited coverage particle spectra and HBT results [6, 10, 13].
The CERN experiment WA98 [14, 15, 16] consists of large acceptance photon and hadron spectrometers together with several other large acceptance devices which allow to measure various global variables on an event-by-event basis. The results presented here were obtained from an analysis of the data taken with Pb beams in 1995 and 1996. The 10% most central reactions () have been selected using the transverse energy measured in the MIRAC calorimeter.
Neutral pions are reconstructed via their decay branch using the WA98 lead-glass photon detector, LEDA, which consisted of 10,080 individual modules with photomultiplier readout. The detector was located at a distance of 21.5 m from the target and covered the pseudorapidity interval . The general analysis procedure, described in [16], is similar to that used in the WA80 experiment [7]. The momentum distributions are fully corrected for geometrical acceptance and reconstruction efficiency. The systematic error on the absolute yield is and increases sharply below . An additional systematic error originates from the uncertainty on the momentum scale of 1%. The influence of this rises slowly for large and leads to an uncertainty on the yield of 15% at .
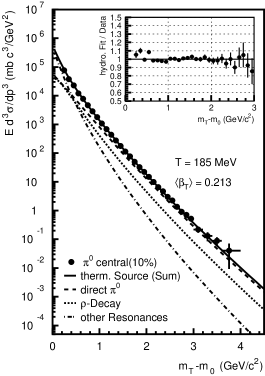
The measured neutral pion cross section from central Pb+Pb reactions as a function of is shown in Fig. 1. Included is a fit with a hydrodynamical model [5] including transverse flow and resonance decays. This computer program calculates the direct production and the contributions from the most important resonances having two- or three-body decays including pions (, , , , , , , ). The code, originally intended for charged pions, has been adapted to predict neutral pion production. The model uses a gaussian transverse spatial density profile truncated at . The transverse flow rapidity is assumed to be a linear function of the radius. For all results presented here, a baryonic chemical potential of has been used. The results are not very sensitive, however, to the choice of for the region considered here.
This model provides an excellent description of the neutral pion spectra with a temperature and an average flow velocity of . These values are very similar to the parameters obtained with similar fits to neutral pion spectra in central reactions of 32S+Au [7]. The lower limit***All limits given use the data for as upper limits only to allow for additional hard-scattering contributions. on the temperature is and the corresponding upper limit on the flow velocity is .
The observed curvature at low is largely a result of resonance decay contributions. Performing a fit with only the direct contribution leads to and , with corresponding limits of and , similar to other analyses which have neglected decay contributions [6, 17]. The larger average velocity which results in this case is due to the fact that all of the observed curvature must now be accounted for by transverse flow.
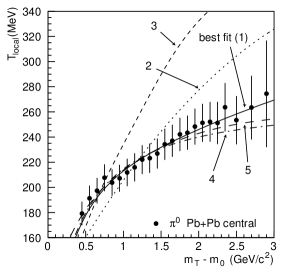
The high statistical accuracy and large transverse mass coverage of the present measurement reveals the concave curvature of the spectrum over a large range, which constrains the parameters significantly. This is further demonstrated by studying the local slope at each . The local (inverse) slope is given by
| (1) |
The local slope results are plotted in Fig. 2. Each individual value of has been extracted from 3 adjacent data points of Fig. 1. The data are compared to the hydrodynamical model best fit results of Fig. 1, as well as fits in which the transverse flow velocities have been fixed to larger values comparable to those obtained by Refs. [10] and NA49 [6] (sets 2 and 3). The corresponding fit parameters are given in Table I. The comparison demonstrates that while the large transverse flow velocity fits can provide a reasonable description of the data up to transverse masses of about 1 GeV, they significantly overpredict the local slopes at large transverse mass. While application of the hydrodynamical model at large transverse mass is questionable, the model cannot overpredict the measured yield. The observed overprediction therefore rules out the assumption of large transverse flow velocities, or points to a deficiency in the model assumptions used in these fits.
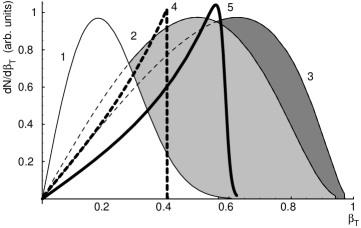
The curvature in the spectrum at large transverse mass is a result of the distribution of transverse velocities. Although the spectrum is not directly sensitive to the spatial distribution of particle emission, within this model it is dependent indirectly on the spatial distribution due to the assumption that the transverse rapidity increases linearly with radius. The large curvature at large transverse mass is due to high velocity contributions which result from the tail of the assumed gaussian density profile [18]. Figure 3 shows the transverse source velocity distributions for the different parameter sets. †††More precisely these are source emission functions integrated over all variables except the transverse velocity and the rapidity, i.e. they are weighted with the produced particle multiplicity. The curves labelled 1-3 correspond to the calculations in figure 2 using a gaussian spatial profile. In addition, velocity profiles are shown for a uniform density profile (set 4) and for a Woods-Saxon distribution:
| (2) |
with (set 5). These are included in figures 2 and 3. It is seen that the uniform density assumption truncates the high velocity tail resulting in less curvature in the pion spectrum, while the Woods-Saxon has a more diffuse edge at high .
While the gaussian and uniform density assumptions have very different velocity profiles, it is interesting that both can provide acceptable fits to the pion spectrum with best fit results with similar and parameters, which give similar effective temperatures, and which have similar velocity widths, , as shown in Table I. Compared to the gaussian profile result, the best fit result using the uniform profile gives a lower temperature of 178 MeV and would lead to weaker limits of and . Limits cannot be set using the Woods-Saxon profile due to increased fit ambiguity. If the data for is used only as upper limits, as explained above, a best fit result with and is obtained.
The data presented here can be well described with high thermal freeze-out temperatures, similar to temperatures which have been extracted for chemical freeze-out [12], and small transverse flow velocities. ‡‡‡Note again that chemical and thermal freeze-out are not necessarily expected to be the same. On the other hand, if the larger velocities obtained in other analyses which have considered limited particle spectra together with HBT results [6, 10, 13] persist, then the present analysis suggests much lower thermal freeze-out temperatures. For example, none of the different velocity profile assumptions used in this analysis allowed to reproduce the results of ref. [6] – all profiles studied require a temperature of 90 MeV or less, if is assumed. The present data obviously provide important information on the shape of the freeze-out velocity distribution. A more extensive systematic study would require further guidance from full hydrodynamical calculations, which is beyond the scope of this paper. Recent hydrodynamical model calculations [19, 20] have found reasonable agreement with transverse mass spectra within a broad range of assumptions. However, in these studies it was not attempted to limit the model parameters or assumptions by a rigorous comparison to the data.
| Set | spatial | |||||||
| profile | (MeV) | (MeV) | ||||||
| 1 | Gauss | 0.107 | 230 | 25.9/18 | ||||
| 2 | Gauss | 0.469 | 0.199 | 125 | 386/19 | |||
| 3 | Gauss | 0.527 | 0.213 | 88 | 578/19 | |||
| 4 | Uniform | 0.093 | 235 | 33.3/18 | ||||
| 5 | WS | 0.137 | 214 | 26.7/18 | ||||
In summary, we have argued that hydrodynamical models which attempt to extract the thermal freeze-out parameters of relativistic heavy ion collisions must provide an accurate description of the pion spectra, since pions most directly reflect the thermal evironment in the late stage of the collision. In particular, models, or parameter sets, which overpredict the observed pion yields, even at large transverse mass, can immediately be ruled out. We have demonstrated that the high accuracy neutral pion spectra with large transverse mass coverage can constrain the thermal freeze-out parameters and model assumptions. Within the context of the hydrodynamical model of Ref. [5], the default velocity profile favors large thermal freeze-out temperatures similar to the chemical freeze-out temperature determined for the same system [12]. Only special choices of the velocity profile allow large average freeze-out velocities similar to those extracted from other recent analyses which consider also HBT results [6, 10, 13]. On the other hand, the corresponding freeze-out temperatures are then MeV, significantly lower than other estimates. The present results indicate that the determination of the freeze-out parameters remains an open question. It will be important to determine whether full hydrodynamical models can reproduce the high precision pion data and thereby constrain the assumed freeze-out hypersurface.
We wish to thank Urs Wiedemann for assistance with the model calculations and valuable discussions. This work was supported jointly by the German BMBF and DFG, the U.S. DOE, the Swedish NFR and FRN, the Dutch Stichting FOM, the Stiftung für Deutsch-Polnische Zusammenarbeit, the Grant Agency of the Czech Republic under contract No. 202/95/0217, the Department of Atomic Energy, the Department of Science and Technology, the Council of Scientific and Industrial Research and the University Grants Commission of the Government of India, the Indo-FRG Exchange Program, the PPE division of CERN, the Swiss National Fund, the INTAS under Contract INTAS-97-0158, ORISE, Grant-in-Aid for Scientific Research (Specially Promoted Research & International Scientific Research) of the Ministry of Education, Science and Culture, the University of Tsukuba Special Research Projects, and the JSPS Research Fellowships for Young Scientists. ORNL is managed by Lockheed Martin Energy Research Corporation under contract DE-AC05-96OR22464 with the U.S. Department of Energy. The MIT group has been supported by the US Dept. of Energy under the cooperative agreement DE-FC02-94ER40818.
REFERENCES
- [1] F. Becattini, Z. Phys. C 69 (1996) 485–492.
- [2] E. Schnedermann, J. Sollfrank, and U. Heinz, Phys. Rev. C 48 (1993) 2462.
- [3] S. Chapman, J. R. Nix and U. Heinz, Phys. Rev. C 52 (1995) 2694.
- [4] P .Braun-Munzinger et al., Phys. Lett. B 344 (1995) 43.
- [5] U.A. Wiedemann and U. Heinz, Phys. Rev. C 56 (1997) 3265.
- [6] NA49 Collaboration, H. Appelshäuser et al., Eur. Phys. J. C 2 (1998) 661–670.
- [7] WA80 Collaboration, R. Albrecht et al., Eur. Phys. J. C 5 (1998) 255.
- [8] S. Pratt, Phys. Rev. D 33 (1986) 1314.
- [9] U. Heinz et al., Phys. Lett. B 382 (1996) 181.
- [10] J.R. Nix et al.,nucl-th/9801045.
- [11] J. Sollfrank, J. Phys. G 23 (1997) 1903.
- [12] F. Becattini, M. Gaździcki, and J. Sollfrank, Eur. Phys. J. C 5 (1998) 143.
- [13] J.R. Nix, Phys. Rev. C 58 (1998) 2303.
- [14] WA98 Collaboration, Proposal for a large acceptance hadron and photon spectrometer, 1991, Preprint CERN/SPSLC 91-17, SPSLC/P260.
- [15] WA98 Collaboration, M. Aggarwal et al., Nucl. Phys. A 610 (1996) 200c.
- [16] WA98 Collaboration, M.M. Aggarwal et al., Phys. Rev. Lett. 81 (1998) 4087.
- [17] NA44 Collaboration, I.G. Bearden et al., Phys. Rev. Lett. 78 (1997) 2080.
- [18] U. Heinz and U.A. Wiedemann, private communication.
- [19] A. Dimitru and D.H. Rischke, Phys. Rev. C59 (1999) 354-363.
- [20] P. Huovinen, P.V. Ruuskanen, and J. Sollfrank, Nucl. Phys. A 650 (1999) 227-244.