SEPARATION BETWEEN SOURCES OF PIONS AND PROTONS IN CENTRAL AU+AU COLLISIONS AT THE AGS (E877).
Two-particle pion-pion, proton-proton, and pion-proton correlations were measured in central Au+Au collisions at 11 GeV/c per nucleon. The data were analyzed using one- and three-dimensional correlation functions. The pion-proton correlation functions exhibit asymmetry which indicates that the sources of protons and pions are separated in the direction along the accelerator beam.
1 Introduction
The two-particle correlation function, defined as the ratio between the two-particle density and the product of single particle densities
| (1) |
contains important information about the space-time-momentum distribution at the time of last interaction (freeze-out) of particles produced in a nuclear collision. The correlations of identical pions, dominated by the Bose-Einstein statistics and by mutual Coulomb interaction, exhibit a peak at , the width of which is inversely proportional to the source size. Analysis of as a function of different components of the momentum difference yields the source dimensions in different directions. The two-proton correlation is a product of the Fermi statistics as well as the mutual Coulomb and strong interactions. This correlation shows a peak at the relative momentum MeV/c, the amplitude of which is roughly inversely proportional to the volume of the proton source. The unlike-pions and pion-proton correlations are generated mostly by the Coulomb interaction and thus have an exponential-like shape at . Similarly as for identical pions, even if with somewhat lower sensitivity, the width of this peak depends on the average r.m.s. distance between the particles at freeze-out.
2 Experiment and data analysis
I present here results of the correlation analysis of particles produced in central Au+Au collisions at 11 GeV/c per nucleon. Five millions central (4% of the geometrical cross section) collision events were recorded in Fall 1994 by the E877 Collaboration at the AGS. The experimental setup, presented in Figure 1, consisted of three calorimeters, used to determine the centrality and the orientation of the reaction plane and to generate the centrality trigger, and a forward spectrometer for measuring momenta of pions and protons. The momentum resolution of the spectrometer was . The acceptance allowed simultaneous measurement of positive and negative particles (Figure 2).


The numerators of the correlation functions were generated using pairs of identified particles detected in the forward spectrometer. The distributions of the analyzed particles and particle pairs are shown in Figures 2 and 3, respectively. The denominators were obtained by event mixing. We mixed only events with similar centralities and similar orientations of the reaction plane. The two track resolution problems were avoided by rejecting from the numerator and the denominator all track pairs which did not have enough separation in the tracking detectors. The correlation functions were normalized to unity at the flat part between MeV/c and MeV/c. No Coulomb correction was applied. The relative momentum was evaluated in the pair c.m.s. which is the natural choice when analyzing correlation functions of particles with different masses. The , and components are defined as follows: is the accelerator beam axis, is in the reaction plane, and is perpendicular to the beam and to the reaction plane. The reaction plane is determined from the azimuthal distribution of the transverse energy. The sign of is defined such that the transverse flow of forward protons is in the positive- direction.
3 Results
The obtained one-dimensional correlation functions are presented in Figure 4. The correlation functions of identical pions are dominated by the positive Bose-Einstein correlation, slightly suppressed by the repulsive Coulomb interaction. The bumb in the two-proton correlation is caused by the attractive strong interaction, and the minimum at low relative momenta is caused by the Coulomb interaction and the Fermi statistics. The non-identical particle correlations are mainly due to Coulomb interaction. The little peak in the –proton correlation function is caused by decays. The position and the width of this peak was used as a check of the momentum calibration and of the knowledge of the momentum resolution.
The line represents the result of a calculation described in the next section. The calculation overestimates both pion-proton correlation functions while all other correlations are reasonably reproduced.
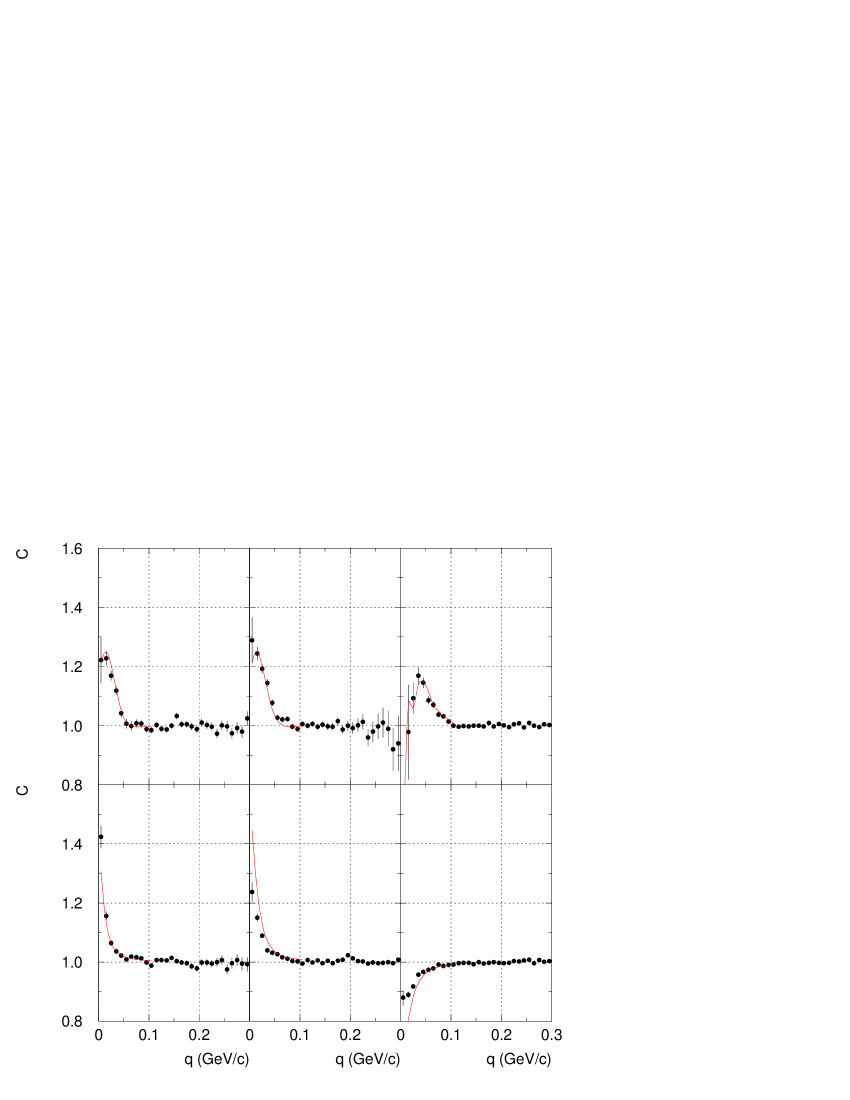
The projections of the three-dimensional correlation functions are shown in Figure 5. The projections were done while restricting the other two components of to the range from -50 MeV/c to 50 MeV/c. The line, again, represents the calculations. Inspection of Figure 5 allows to trace back the origin of the disagreement between the data and the calculation in the pion-proton correlations to the asymmetric shape of the peak in the data, not reproduced by the calculation.

As observed by Lednicky et al , an asymmetric peak in the correlation function between non-identical particles is a sign of spatial or temporal separation between the sources of the two particle species. (The mechanism of this effect was explained by B. Erazmus in her talk during this conference.) Since the asymmetry in our data is in the direction of both pion-proton correlations, we conclude that there is a finite separation between the sources of pions and protons in the beam direction. The sign of the asymmetry indicates that at freeze-out protons are more forward than pions with similar (forward) rapidities. In order to estimate the size of this displacement we performed the calculation described below.
4 Calculation
We generated pairs of particles. Each particle was described by four position and four momentum coordinates. The position coordinates were generated according to a double-gaussian distribution for pions (core-halo model ) and a single-gaussian for protons:
| (2) | |||||
| (3) |
The parameter represents the fraction of pions coming from the core, i.e. not from long-lived resonances. It is related to the correlation strength by
| (4) |
The momenta were sampled from the experimental momentum distributions. The Lednicky code was used to calculate a weight for every pair. The code accounts for the (anti)symmetrization effect as well as for the Coulomb and strong interactions. Subsequently, the momenta were smeared by the experimental momentum resolution and the two-track separation cut was applied. Finally, every pair was processed through the same analysis as the experimental data, except that the Lednicky’s weight and unity were used to increment the histograms for the numerator and the denumerator of the correlation function, respectively (no event mixing).
The parameters of the gaussian position distributions were adjusted to fit the data. The three-dimensional proton-proton correlation function allows to determine the transverse and longitudinal proton source size, even if the coupling between the direction of q and is not as clean as it is for pions. The best agreement was obtained for fm and fm. The , , and correlations could be simultaneously reproduced with , fm, fm, and fm. The correlation functions calculated using these parameters are represented by lines in Figures 4 and 5. The pion-proton correlations, calculated using the same parameter values and assuming that the pion and proton sources are centered at the same point, disagree with the data.


The discrepancy can be removed by assuming a finite displacement between the sources of pions and protons. Calculations using different values of the displacement are compared to the data in Figures 6 and 7. A reasonable agreement was achieved with a 10 fm separation in and -10 fm or +5 fm, depending on the charge of the pions, in .
5 Conclusion
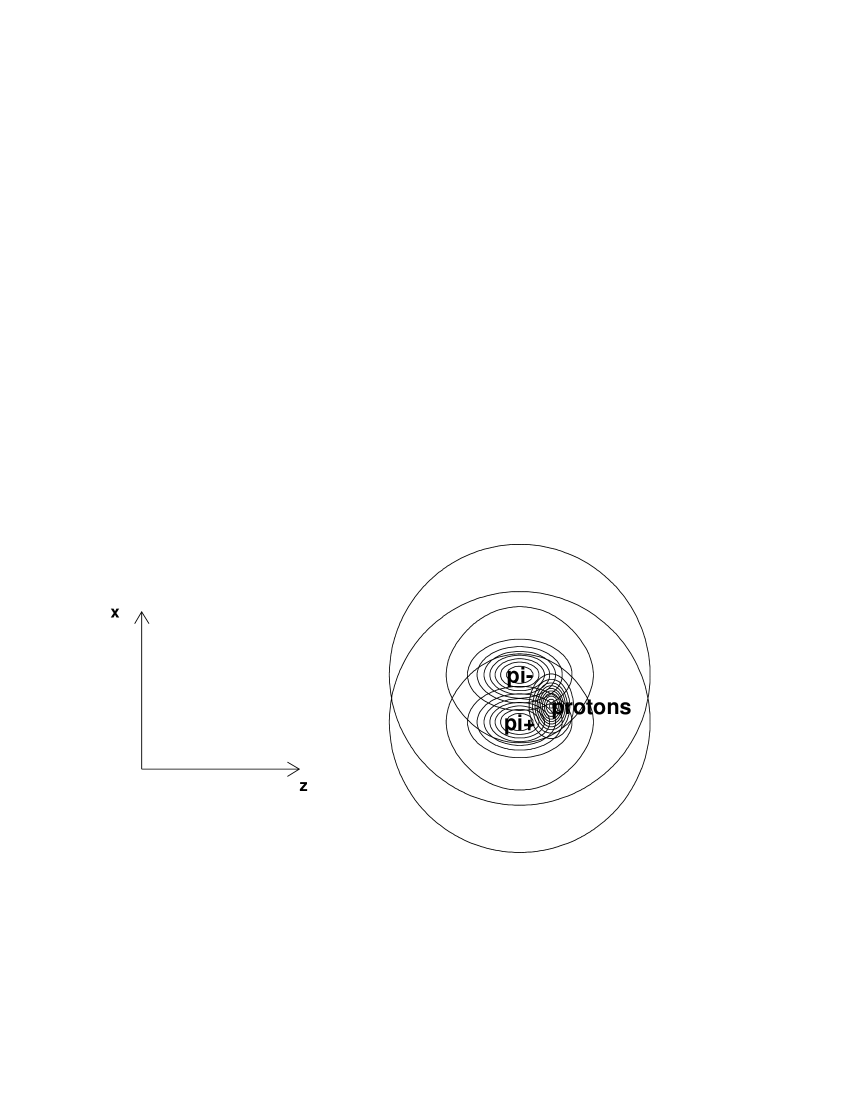
The corresponding source distributions are shown in Figure 8. The proton source is located 10 fm more forward than the sources of pions. The source is, in addition, shifted in the reaction plane by 10 fm in the direction of positive , i.e. in the direction of the flow of the forward protons. The source is shifted by 5 fm towards negative .
A similar displacement of the pion and proton sources was observed in the RQMD generated events. In hydrodynamical models the displacement in is a natural consequence of longitudinal expansion combined with the mass difference between pions and protons. However, the magnitude of the observed displacement seems large compared to the size of the system and the expected duration of the emission. Indeed, even assuming that the pion source stays at the origin (in the nucleus-nucleus c.m. system), and the proton source moves with beam rapidity, it would take fm/c proper time to reach the separation of 10 fm. During this time the system would expand to the total length of
| (5) |
Since it hard to imagine that the pion source does not move at all, this value can be considered as the lower limit.
In summary, asymmetry in non-identical particle correlation functions was observed for the first time. The asymmetry indicates a displacement between the sources of pions and protons. The magnitude of this displacement is related to the total duration of the reaction.
References
References
- [1] D. H. Boal, C-K. Gelbke, and B. K. Jennings, Rev. Mod. Phys.62553 1990.
- [2] R. Lednicky et al, Phys. Lett. B 373, 30 (1996).
- [3] B. Erazmus, this conference.
- [4] T. Csörgő, B. Lörstad, and J. Zimányi, Z. Phys. C 71, 491 (1996).
- [5] R.Lednicky, V.L.Lyuboshitz, Sov.J.Nucl.Phys. 35 (1982) 770.
- [6] R.Lednicky et al, SUBATECH-94-22, Nantes).
- [7] S. Voloshin, R. Lednicky, S. Panitkin, and Nu Xu, Phys. Rev. Lett. 79, 4766 (1997).
- [8] U. Heinz, private communication.
- [9] T. Csörgő, private communication.