Charged Kaon and Pion Production at Midrapidity in Proton Nucleus and Sulphur Nucleus Collisions
Abstract
The NA44 collaboration has measured charged kaon and pion distributions at midrapidity in sulphur and proton collisions with nuclear targets at 200 and 450 GeV/c per nucleon, respectively. The inverse slopes of kaons are larger than those of pions. The difference in the inverse slopes of pions, kaons and protons, all measured in our spectrometer, increases with system size and is consistent with the buildup of collective flow for larger systems. The target dependence of both the yields and inverse slopes is stronger for the sulphur beam suggesting the increased importance of secondary rescattering for reactions. The rapidity density, dN/dy, of both and increases more rapidly with system size than for in a similar rapidity region. This trend continues with increasing centrality, and according to RQMD, it is caused by secondary reactions between mesons and baryons. The ratio falls with increasing system size but more slowly than the ratio. The ratio is close to unity for all systems. From to the ratio decreases while increases and stays constant. These data suggest that as larger nuclei collide, the resulting system has a larger transverse expansion, baryon density and an increasing fraction of strange quarks.
pacs:
PACS numbers: 25.75.-q 13.85.-t 25.40.veI Introduction
Nucleus-nucleus collisions at ultrarelativistic energies create hadronic matter at high energy density. Enhanced production of particles containing a strange quark, such as kaons, may indicate formation of a state of matter in which the quarks and gluons are deconfined [1, 2, 3, 4]. This is because while the production of s-quarks is generally suppressed in hadronic collisions, they are light enough to be abundantly produced at temperatures above the deconfinement phase transition, and rapidly reach chemical equilibrium via gluon-gluon fusion (see [5] for a review). Alternatively there may be a duality of quark matter and “conventional” hadronic explanations for the strangeness enhancement observed in recent data [6]. The and yields together provide a sensitive probe of the spacetime evolution of heavy-ion reactions. Since s have a large annihilation cross-section with neutrons, their yield is sensitive to the baryon density. The and distributions may also hint at the degree of thermalization achieved; and their transverse mass spectra allow detailed study of rescattering and collective expansion effects. The pions are less sensitive to collective expansion because of their small mass. However because they are the most numerous of the produced particles they give information on the total entropy produced in the collision. We present charged kaon and pion measurements using the NA44 spectrometer from collisions (to approximate ), p-nucleus and nucleus-nucleus interactions. This allows a systematic study as a function of the size of the central region and different conditions in the surrounding hadronic matter.
The distributions of kaons at midrapidity provide a sensitive probe of the collision dynamics and constrain the assumptions of event generators. We compare our data to the RQMD model, version 1.08 [7, 8]. RQMD is a microscopic phase space approach to modeling relativistic heavy ion collisions based on resonance and string excitation and fragmentation with subsequent hadronic collisions. RQMD also contains “ropes” formed by overlapping strings, whose sources are color octet charge states [9]. These increase the number of strange antibaryons and antiprotons but have little effect on kaon yields or slopes.
II Experiment
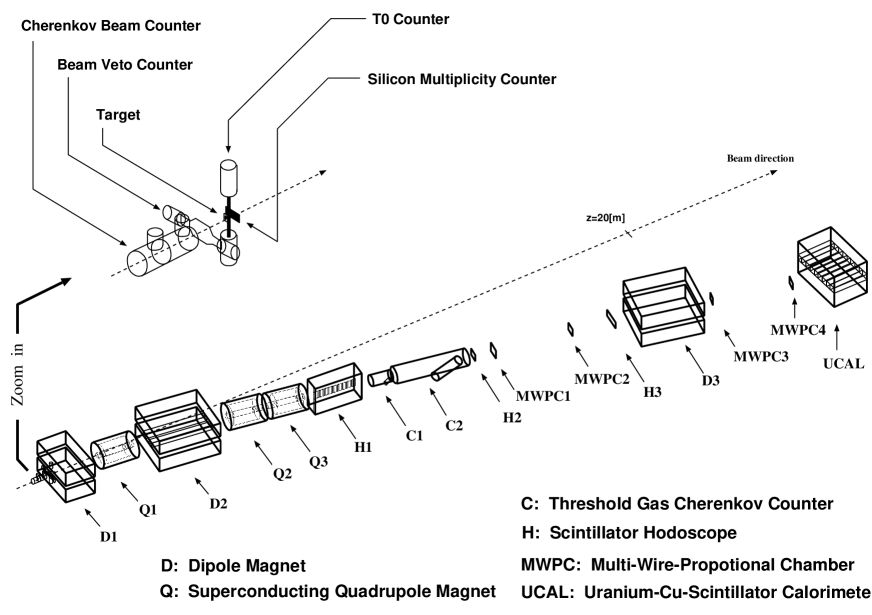
The NA44 experiment is shown in Fig. 1. Three conventional dipole magnets (D1, D2, and D3) and three superconducting quadrupoles (Q1, Q2, and Q3) analyze the momentum and create a magnified image of the target in the spectrometer. The magnets focus particles from the target onto the first hodoscope (H1) such that the horizontal position along the hodoscope gives the total momentum. Two other hodoscopes (H2, H3) measure the angle of the track. The hodoscopes also measure the time-of-flight with a resolution of approximately 100 ps. Particle identification relies primarily upon the third hodoscope.
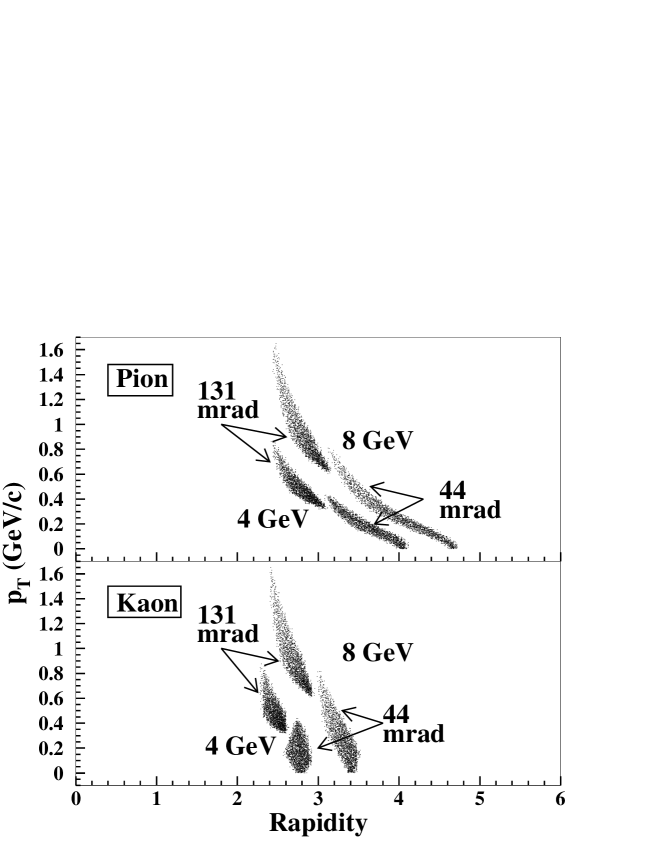
The momentum acceptance is 20% of the nominal momentum setting. The angular coverage, with respect to the beam, is approximately 5 mrad vertically and -5 to +78 mrad in the horizontal plane when the spectrometer is at 44mrad with respect to the beam. When the spectrometer is rotated to 131mrad, the horizontal coverage is 77 to 165 mrad. Only particles of a fixed charge sign are detected in a given spectrometer setting. Four settings are used to cover the midrapidity region in the range 0 to 1.6 GeV/c. Fig. 2 shows the acceptance of the spectrometer for pions and kaons in the plane for the 4 and 8GeV/c momentum settings when the spectrometer axis is at 44 and 131 mrad with respect to the beam.
Two Cherenkov counters differentiate kaons, protons and pions and reject electrons. An appropriate combination of C1 and C2 was used for each spectrometer setting to trigger on pion or kaon/proton events. Particles are identified by their mass-squared, constructed from the track momentum and time-of-flight, in addition to the Cherenkov information. This is shown in Fig. 3 for the 4GeV/c setting. Pions are clearly visible after kaons and protons have been rejected by requiring a signal in the first Cherenkov counter. Kaons and protons are clearly separated after pions have been rejected using the same Cherenkov. After mass-squared and Cherenkov cuts the residual contamination of the data is less than 3%.
A scintillator (T0) is used to trigger on central events in sulphur-nucleus collisions by requiring a large pulse height (high charged particle multiplicity). The pseudorapidity coverage of T0 is roughly 1.3 to 3.5. For proton beams, T0 provides the interaction trigger by requiring that at least one charged particle hit the scintillator. More details about the spectrometer are available in [10, 11].
III Data Analysis
The data samples after particle identification and quality cuts are shown in Table I. Also shown for each data set is the target thickness and the centrality, expressed as a fraction of the total inelastic cross-section. In order to construct the invariant cross-section, the raw distributions are corrected using a Monte Carlo simulation of the detector response. Simulated tracks are passed through the full analysis software chain and used to correct the data for geometrical acceptance, reconstruction efficiency, particle decay in flight and momentum resolution. Particles are generated uniformly in rapidity and according to an exponential distribution in transverse mass, , with the coefficient of the exponent determined iteratively from the data.
The absolute normalization of each spectrum is calculated using the number of beam particles, the target thickness, the fraction of interactions satisfying the trigger, and the measured live time of the data-acquisition system. For the data, the centrality selection is determined by comparing the pulse height distribution in the T0 counter for central and unbiased beam triggers. For systems, the fraction of inelastic collisions producing at least one hit in the interaction (T0) counter is modeled with the event generators RQMD [7] and FRITIOF [12, 13]. The resulting centrality fractions are indicated in Table I.
The proton-nucleus data are corrected for non-target background. The largest corrections are 15%, 12% and 12% for , and respectively, for collisions. This correction does not affect the shape of the distribution, only the absolute cross-section. No correction is needed for the central nucleus-nucleus data. The cross-sections are also corrected for the particle identification and trigger inefficiencies.
The invariant cross-sections, measured in the NA44 acceptance, are generally exponentials in transverse mass. This allows us to characterize the distributions by two numbers: the inverse slope, and the total particle yield. A detailed description of the estimated systematic errors on particle yields and inverse slopes is given in [11]. These were derived from checks on the momentum scale, acceptance corrections, trigger and lifetime efficiencies, see Table II.
IV Results
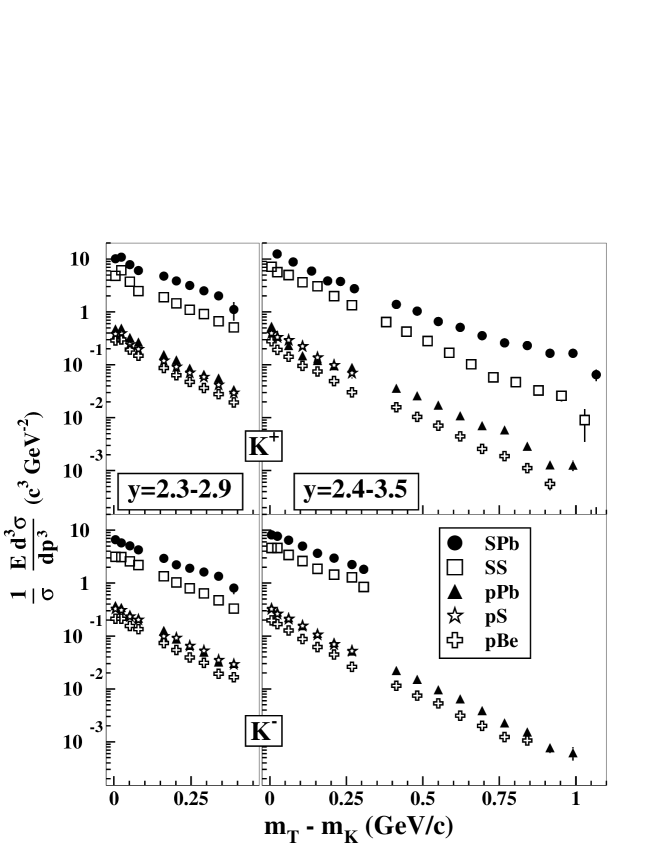
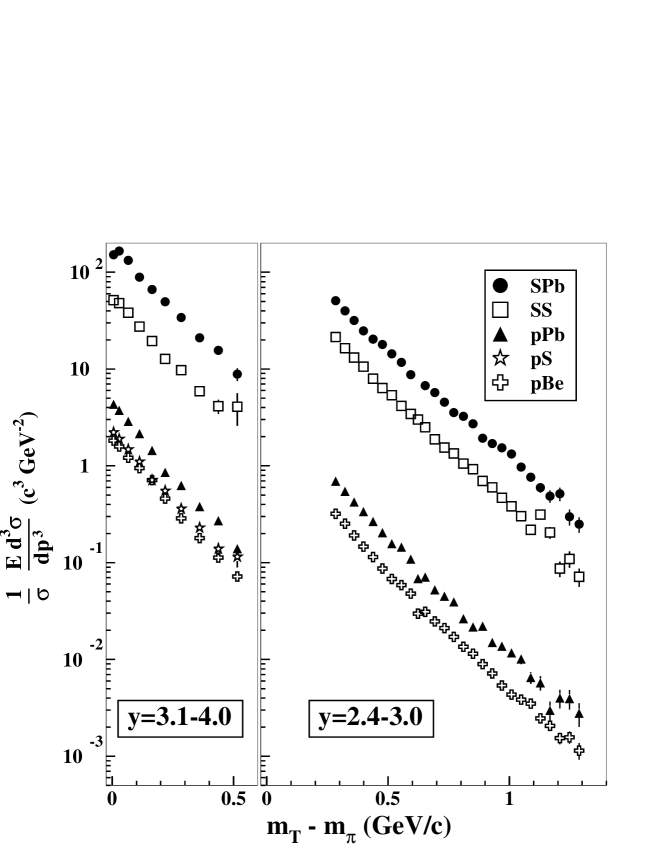
The invariant cross-sections for kaons and pions from , , , , and collisions are shown in Figs. 4 and 5 as a function of . The transverse mass distributions are generally described by exponentials in the region of the NA44 acceptance, that is:-
| (1) |
where is a constant and is the inverse logarithmic slope. The pion spectra are not exponential for all however as discussed in Section V.
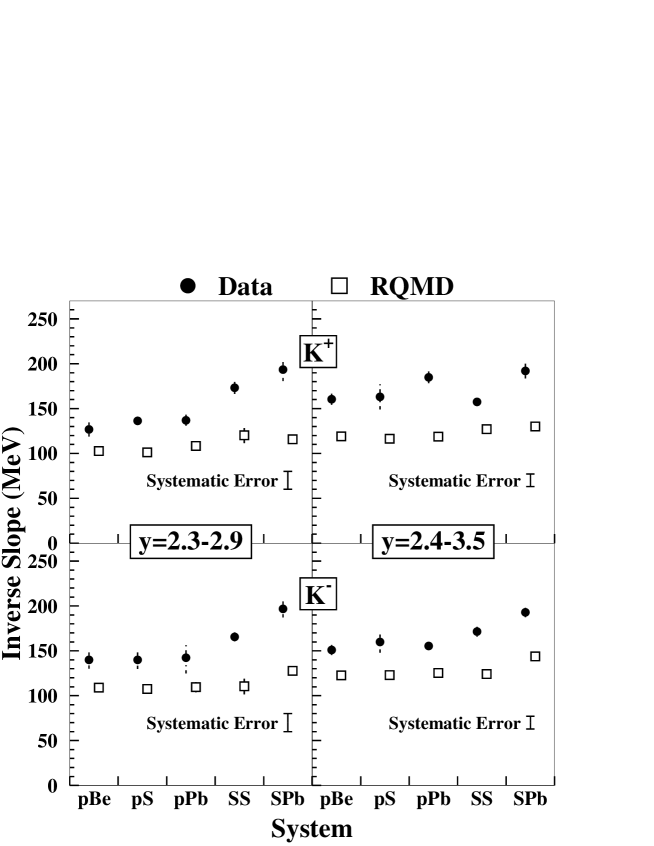
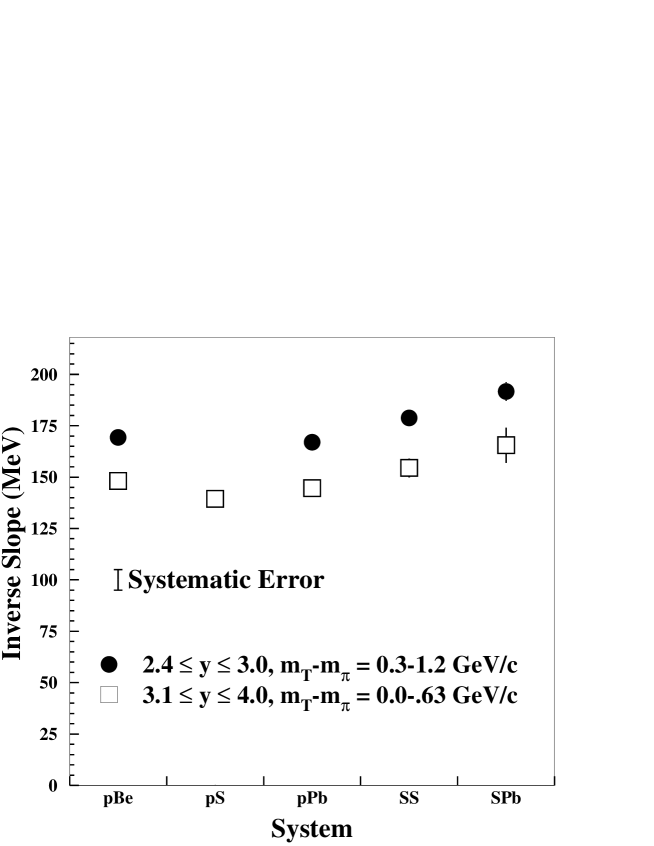
The inverse slope parameters obtained by fitting the spectra to Eq. 1 are given in Table III and plotted in Figs. 6 and 7. The inverse slope parameters for both and increase with system size. If the sample is split into two centrality bins, and the inverse slopes for both and show no centrality dependence. The inverse slopes of kaons from RQMD are smaller than the data. The shape of the RQMD spectra for kaons is concave in the NA44 acceptance, resulting in slopes that are smaller than the data. Further study is necessary to understand why this is so. The inverse slopes of pions show a weaker system dependence than kaons but increase with .
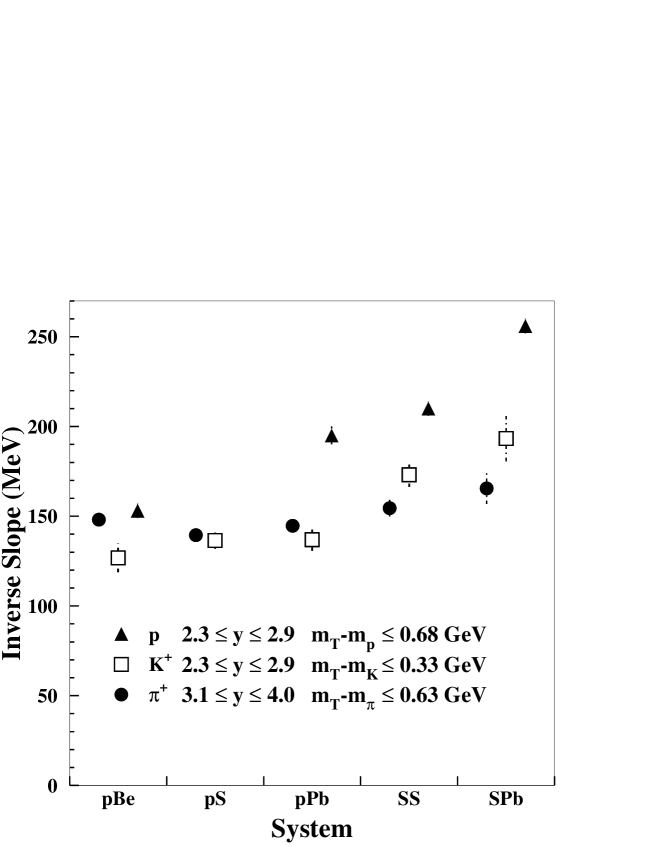
The inverse slopes of our , and proton [11] spectra are shown in Fig. 8 versus system. The inverse slopes of pions increase only slowly with system size, while those of kaons and protons increase more rapidly. The difference in slopes increases with system size. This is consistent with transverse flow, which should be stronger for larger systems.
The rapidity density, dN/dy, was calculated by integration of the normalized distributions, corrected as described above. The fitted slope was used to extrapolate to high , beyond the region of measurement. The statistical error on this extrapolation was calculated using the full error matrix from the fit of Eq. 1 to the spectrum.
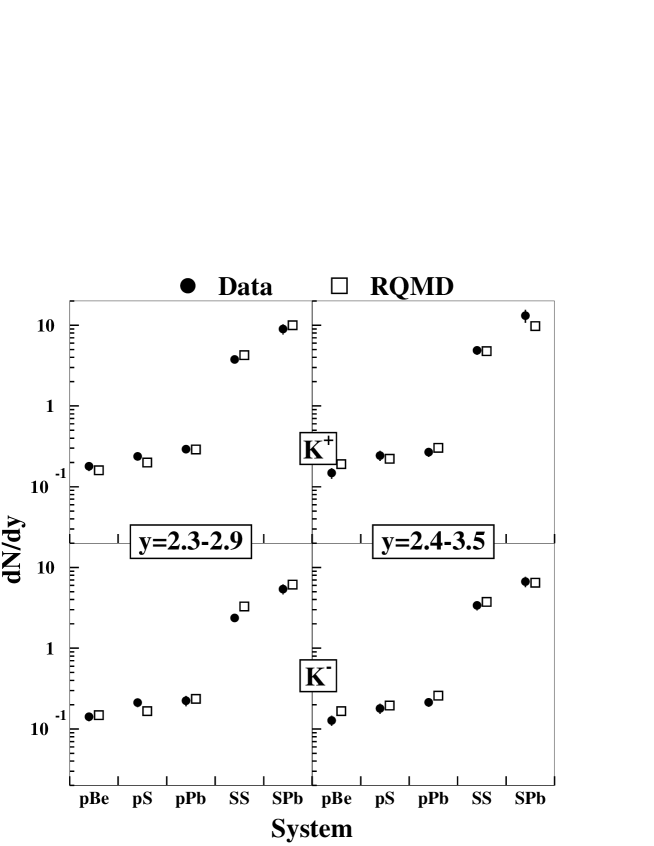
The and dN/dy values from data and RQMD are plotted in Fig. 9 and the data (including the pion dN/dy values) are given in Table IV. The uncertainties in dN/dy introduced by the uncertainty in the slope of the spectrum, the Cerenkov trigger efficiency and the combining of the spectra from the two settings are included in the errors. The number of kaons found at midrapidity increases rapidly with the size of the colliding nuclei. Comparing () with () shows that the target dependence is stronger in nucleus-nucleus collisions than in p-nucleus collisions.
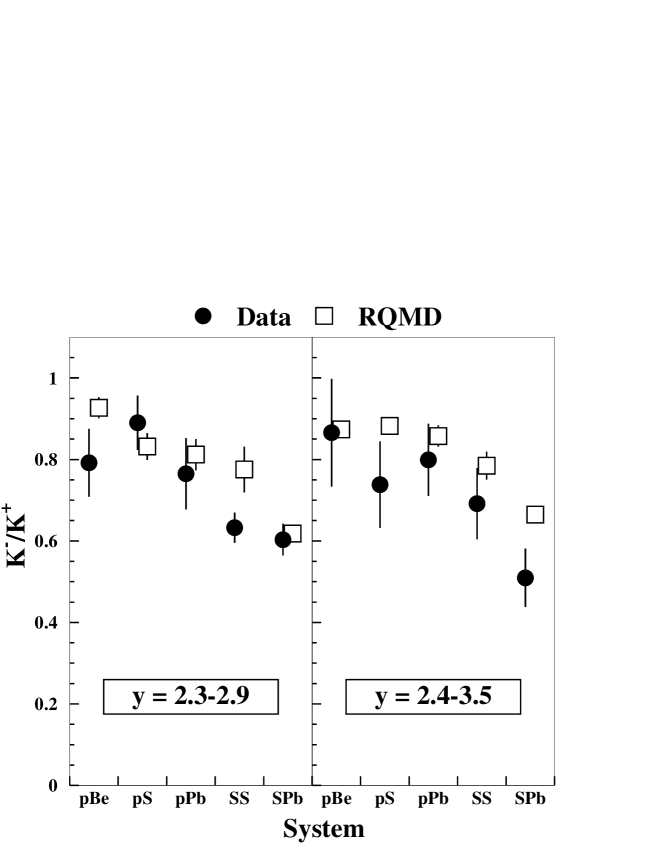
Fig. 10 shows the ratio of dN/dy for and for the various target-projectile systems studied. Note that the systematic errors listed in Table II cancel in this ratio. The ratio for agrees with from pp collisions measured at the ISR [14, 15]. The ratio drops slowly with system size but this is not explained by the lower of the data. Only a change in was observed for collisions when changing from 31 to 23GeV/c [14]. The ratio also decreases for more central collisions. Note the ratio is for all systems. RQMD reproduces the ratio.
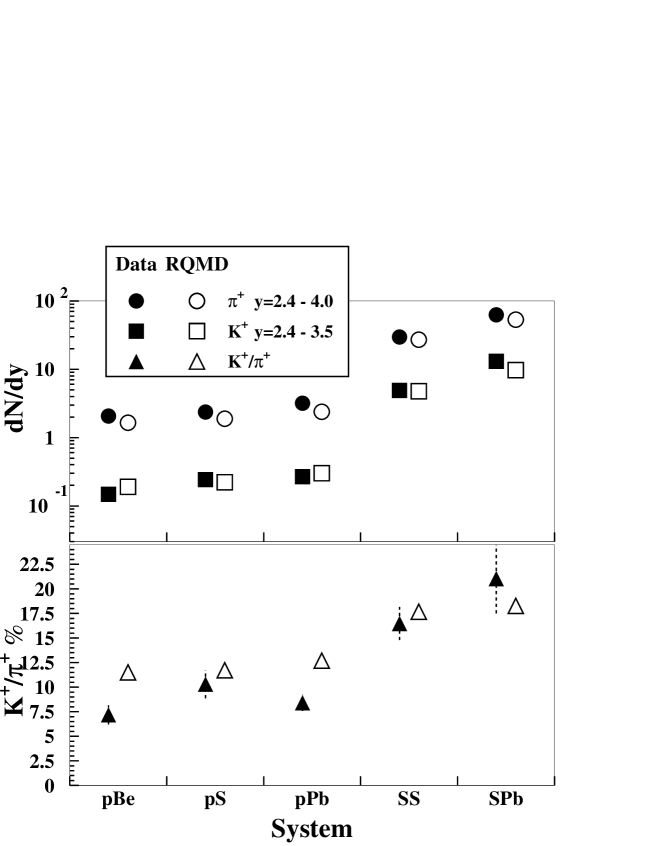
Fig. 11 shows the yield of positive pions and kaons and their ratio for vs system. For pions, like kaons, the target dependence is stronger in nucleus-nucleus collisions than in p-nucleus collisions. The ratio is constant for collisions but increases by about in central interactions. The ratio also increases with centrality.
A similar effect has been observed by the E802 collaboration for collisions at 14.6GeV/c, where the ratio is a factor of larger than for collisions of a similar energy [16]. RQMD was able to give a reasonable explanation of this result [17] in terms of secondary production of by meson-baryon interactions, see also [6]. A similar result was obtained with ART [18], while in ARC [19] the enhancement was caused by interactions. RQMD predicts quite well the measured features of the dN/dy of pions and kaons, but slightly overestimates the ratio in collisions.
For collisions, isospin conservation implies that the total yield of over the full phase space should equal the average of the and yields. (A similar argument holds for pions). Comparing our yields with those of NA35 [20], we find excellent agreement for kaons and reasonable agreement for pions [21]. However the NA35 kaon inverse slopes are significantly larger [22]. The NA36 and WA85 collaborations have measured the inverse slopes of charged kaons from and collisions respectively and we are in good agreement with their results [23, 24]. Although WA85 does not give absolute yields, their ratio for from [24] is very close to our value for at .
V Discussion
Fig. 7 shows that the inverse slopes increase with increasing . Cronin et al [25] parametrized their pion spectra in terms of spectra as follows
| (2) |
This worked well for many different nuclei. It was found that depended only slowly on rapidity but strongly on , running from 0.7 at low to greater than 1 for very high . The low value of alpha was close to the value 2/3 expected for an opaque nucleus while implies full participation of the nucleus. In [26] was understood in terms of parton scattering. The HELIOS collaboration extended Eq. 2 to nucleus-nucleus collisions [27] by writing
| (3) |
Using Eq. 3 to compare our and data, we find that at and rises to 1.0 by about 1.2 GeV/. This is in agreement with recent results on production by WA80 [28]. HELIOS observed slightly smaller values of when comparing negative hadron production from and . This may be due to their more backward rapidity range where the density of particles is lower.
A prerequisite for creating a quark gluon plasma is to produce a hot dense nuclear system in heavy ion collisions. Such a system would be likely to undergo transverse expansion which would affect the inverse slopes of the particle spectra. The effect of such a velocity boost would be more pronounced on heavier particles. Fig. 8 shows that the difference in inverse slopes between pions, kaons and protons increases with system size. This suggests that the effect of transverse flow becomes stronger for larger systems. NA44 has previously reported an increase with system size in the inverse slopes of kaons, protons and antiprotons produced at mid-rapidity in symmetric collision systems [29]. These data extend this trend to asymmetric systems. Since the effect of the boost increases with mass, the inverse slopes of pions do not increase much with system size.
The target dependence of dN/dy is stronger in nucleus-nucleus collisions than in p-nucleus collisions probably because additional particles are made in secondary collisions of the produced particles. The increase of the ratio with system size suggests that the fraction of strange quarks is increasing. In RQMD, rescattering increases kaon production by for , mainly because of associated production of and in meson-baryon collisions [9]. However, the total multiplicity remains essentially the same if rescattering is turned on or off in the code.
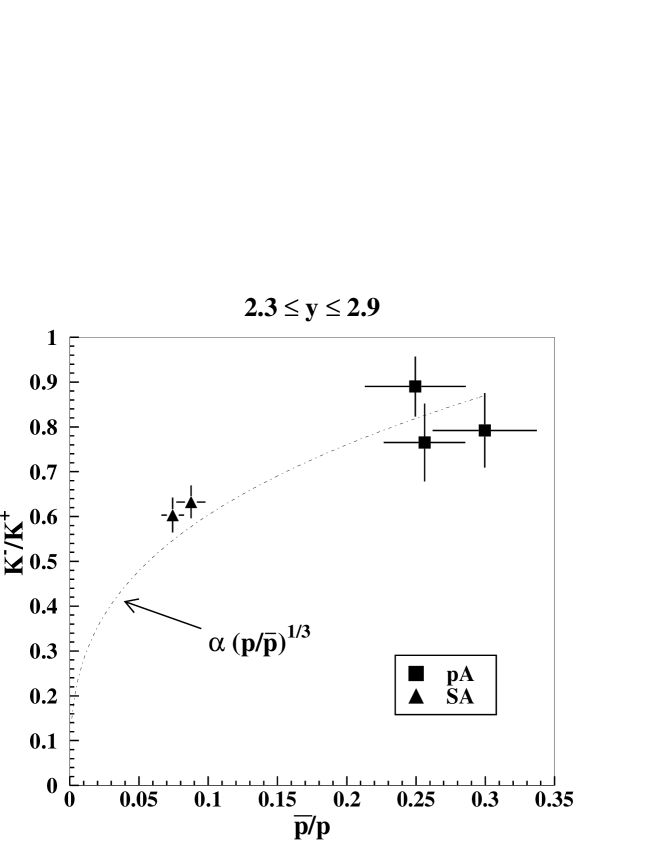
Fig. 12 shows the ratio versus our ratio [11] for various systems at y=2.3-2.9. If we have a system of quarks in chemical and thermal equilibrium, then ratios of particles and antiparticles can be described by ratios of the chemical potential of the constituent quarks to the temperature [30]. Since the quark content of the proton is and (), then where is the chemical potential of strange quarks and is the temperature. If changes slowly from to then we would expect . The data are close to this simple form. As the colliding system gets larger, the baryon density increases reducing the fraction of quarks and driving down the ratio.
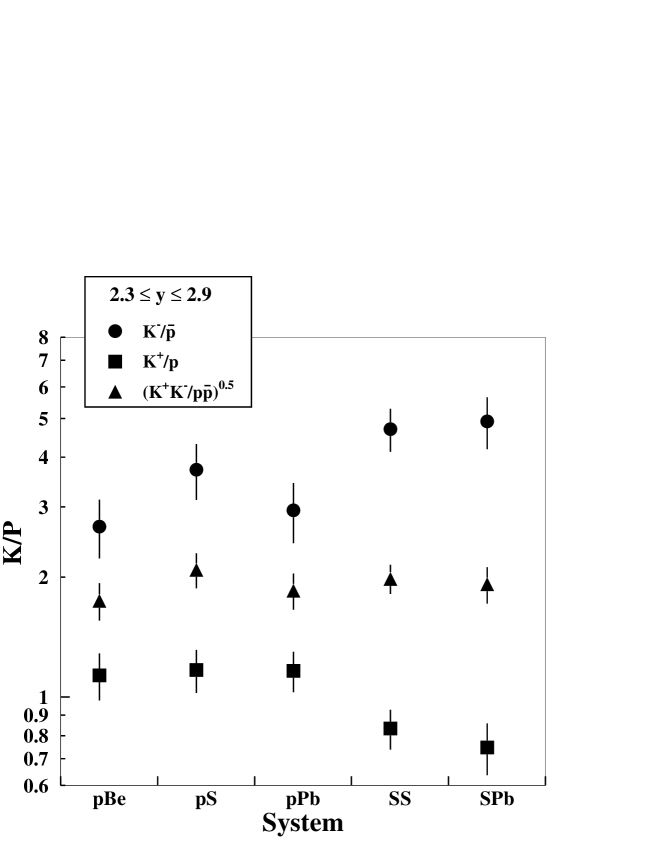
Fig. 13 shows the ratios , and their geometric mean versus system. The ratio decreases while increases and stays constant. Again assuming chemical and thermal equilibrium, this implies that the number of strange quarks is proportional to the product of the numbers of u and d quarks. Such behavior is consistent with the increase of the ratio shown in Fig. 11. This suggests that in collisions strange quarks are still suppressed somewhat with respect to u and d quarks. In thermal language, the chemical potential of the u and d quarks is not yet equal to the mass of the strange quark.
VI Conclusions
Several features of the data suggest a strong build up of rescattering and hence energy density as we collide larger ions. These are:
-
The stronger target dependence of yields and slopes for collisions than collisions;
-
The increase of the pion inverse slopes with ;
-
The increase in the ratio with system size.
If particles undergo many rescatterings, pressure builds up and this causes radial flow. The increase of the inverse slopes with particle mass and the increase of the difference in slopes for larger systems supports the existence of radial flow. However the extraction of a flow velocity is probably best done from a combined analysis of our interferometry measurements and single particle spectra.
At central rapidity the ratio falls as the baryon density increases because of the increasing scarcity of the anti-up quarks required to form . The increasing ratio as well as the constancy of implies that the fraction of strange quarks in the hadronic system is increasing.
VII Acknowledgements
NA44 is grateful to the staff of the CERN PS–SPS accelerator complex for their excellent work. We thank the technical staff at CERN and the collaborating institutes for their valuable contributions. We are also grateful for the support given by the Austrian Fonds zur Förderung der Wissenschaftlichen Forschung (grant P09586); the Science Research Council of Denmark; the Japanese Society for the Promotion of Science; the Ministry of Education, Science and Culture, Japan; the Science Research Council of Sweden; the US W.M. Keck Foundation; the US National Science Foundation; and the US Department of Energy.
REFERENCES
- [1] U. Heinz, P.R. Subramanian, W. Greiner, Z. Phys A 318 247 (1984).
- [2] P.Koch, B. Müller, H. Stöcker, W. Greiner, Mod. Phys. Lett. A3 737 (1988).
- [3] J. Ellis, U. Heinz, H. Kowalski, Phys. Lett. B 233 223 (1989).
- [4] K.S. Lee, M.J. Rhoades-Brown, U. Heinz, Phys. Rev. C 37, 1452 (1988).
- [5] B. Müller, “Strangeness ’96” APH N.S. Heavy Ion Physics 4, 1c (1996).
- [6] H. Sorge, Nucl. Phys. A 630, 522c (1998), nucl-th/9707021.
- [7] H. Sorge, H. Stöcker, W. Greiner, Nucl. Phys. A 498, 567c (1989).
- [8] H. Sorge, A. v. Keitz, R. Mattiello, H. Stöcker, W. Greiner, Z. Phys. C 47, 629 (1990).
- [9] H. Sorge, M. Berenguer, H. Stöcker, W. Greiner, Phys. Lett. B289, 6 (1992).
- [10] H. Beker et al., Phys. Rev. Lett. 74, 3340 (1995).
- [11] I. Bearden et al., Phys. Rev. C 57, 837 (1998), nucl-ex/9711004.
- [12] B. Nilsson-Almqvist and E . Stenlund, Comput. Phys. Comm. 43 387 (1987).
- [13] H. Pi, Comput. Phys. Commun. 71 173 (1992).
- [14] K. Guettler et al., Phys. Lett. B 64, 111 (1976).
- [15] K. Guettler et al., Nucl. Phys. B 116, 77 (1976).
- [16] T. Abbott et al., Phys. Rev. Lett. 64, 847 (1990).
- [17] M. Gonin et al., Phys. Rev. C 51, 310 (1995), nucl-th/9412009.
- [18] G. Song, B. A. Li and C. M. Ko to be published.
- [19] Y. Pang, T. J. Schlagel and S. H. Kahana, Phys. Rev. Lett. 68, 2743 (1992).
- [20] T. Alber et al., Z Phys. C 64 195 (1994).
- [21] J. Bächler et al., Phys. Rev. Lett. 72 1419 (1994).
- [22] S. V. Afanasiev et al., Nucl. Phys. A 610 188c (1996).
- [23] E. Andersen et al., Phys. Lett. B 294 127 (1992).
- [24] S. Abatzis et al., Phys. Lett. B 355 401 (1994).
- [25] J. W. Cronin et al., Phys. Rev. D 11 3105 (1975).
- [26] M. Lev and B. Petersson, Z. Phys. C 21 155 (1983).
- [27] T. Akesson et al., Z. Phys. C 46 361 (1990).
- [28] R. Albrecht et al., nucl-ex/9805007, accepted by Eur. Phys. J. C, May (1998).
- [29] I. G. Bearden et al., Phys. Rev. Lett. 78. 2080 (1997).
- [30] P. Koch, J. Rafelski and W. Greiner Phys. Lett. B 123, 151 (1983).
Event Angle 4GeV/ 8GeV/ 4GeV/ 8GeV/ Fraction mrad % 84 1.5% 44 3.3 22723 47498 3104 11594 15583 69088 131 3.3 5801 7948 2673 2671 38240 15677 90 2 % 44 3.3 40389 39161 1657 11263 15594 67043 131 3.3 22949 4661 0 0 0 0 97 3 % 44 4.7 9591 45303 1304 12268 13147 22686 131 9.9 8898 1304 4674 3497 25553 5195 8.7 .5% 44 6.6 9475 11875 6539 10236 20201 21155 131 6.6 9907 9996 2780 0 25898 16777 10.7 .6% 44 5.9 8893 8695 0 14034 3668 4613 131 5.9 18653 20028 3645 0 22667 15949
Kaons Pions System Error on Inverse Slope Error Error on Inverse Slope Error y=2.3-2.9 y=2.4-3.5 on dN/dy y=2.4-3.0 y=3.1-4.0 on dN/dy 10 MeV/c 10 MeV/c 9% 10 MeV/c 10 MeV/c 9% 10 MeV/c 10 MeV/c 9% 10 MeV/c 10 MeV/c 9% 10 MeV/c 10 MeV/c 10% 10 MeV/c 10 MeV/c 10% 20 MeV/c 10 MeV/c 9% 10 MeV/c 10 MeV/c 8% 20 MeV/c 10 MeV/c 14% 10 MeV/c 10 MeV/c 9%
y=2.3-2.9 y=2.4-3.5 y=3.1-4.0 y=2.4-3.0 GeV/c GeV/c GeV/c GeV/c
y=2.3-2.9 y=2.4-3.5 y=2.4-4.0