, , , , ,
Nuclear Matter Expansion Parameters from the Measurement of Differential Multiplicities for Production in Central Collisions at AGS
Abstract
The double differential multiplicities and rapidity distributions for hyperon production in central interactions at AGS in the range of rapidities from 1.7 to 3.2 and the range of transverse kinetic energies from 0.0 to are parametrized in terms of the the Blast Wave approximation. The longitudinal and transverse radial expansion parameters and the mean temperature of hyperons after the freeze-out of the nuclear matter are presented. The predictions of the RQMD model with and without mean field potentials are compared to our data. Both variants of RQMD are parameterized in terms of the Blast Wave model and the results of such parameterizations are compared to the experimental ones. It is found that inclusion of the mean field potentials in RQMD is essential to account for the strong expansion observed in the data.
1 Introduction
The collective nuclear flow has been a subject of extensive theoretical and experimental investigations for the last few years. It was pointed out that, the collective flow directly probes the equation of state of nuclear matter and thus can provide one with information about the possible phase transition [1, 2]. Before a conclusion about the phase transition can be made, the nuclear equation of state should be known for the baryon densities far above normal, but where the matter is still in the hadronic phase. However the theoretical statements for the compressibility of hadronic phase or for the stiffness of the equation of state contradict each other [1, 3]. Measurements of collective nuclear flow may specify the limits of possible compressibilities of hadronic matter.
One usually distinguishes between longitudinal flow, transverse directed flow, elliptic flow and transverse radial expansion, which are interrelated forms of a global picture [3, 4]. The directed flow comprises a correlation between the impact parameter vector and the directions of produced particles. For quasi-central heavy-ion interactions this correlation vanishes and one encounters the azimuthal symmetry of flow with respect to the impact parameter: the transverse radial expansion superposed on the longitudinal expansion. The spectra of particles produced in the heavy-ion interactions represent the convolution of stochastic thermal and collective macroscopic motion. The shapes of one-particle multiplicities carry part of the information on the collective velocity profile together with information on the stochastic fluctuations of the particle velocities. Even though it is impossible to deconvolve the spectra precisely, one can obtain a semi-quantitative picture of nuclear matter expansion with certain assumptions about the flow velocity profile. Studying the spectra of hyperons has several advantages over studying the spectra of pions and protons. First of all, in central heavy-ion collisions the majority of these particles are produced via multi-step interactions, due to the suppression of the strangeness production in nucleon-nucleon collisions. Thus, the hyperon spectra essentially miss a non-hydrodynamical component, which is present in the spectra of protons. Further, unlike the mesons the influence of resonances on the shapes of the spectrum is negligible. And finally, being heavy, the hyperons acquire significant momentum due to the collective component of their velocities.
In this paper we will show that the double differential multiplicities for the production in central collisions at AGS, experiment E891, can be described in terms of an aspherical blast wave with a single temperature. We will extract the parameters of the blast wave from our data and from the predictions of two versions of the RQMD model (Relativistic Quantum Molecular Dynamics [3]): the cascade version and the version with the mean fields turned on.
2 Experimental method
We analyze the experimental data of the E891 collaboration on the hyperon production in central collisions at the BNL AGS accelerator [10]. The plan view of the E891 apparatus is shown in Figure 1. The beam was incident on a target (7.5% radiation lengths). The charged particles were tracked in three Time Projection Chambers (TPC) in the field of the Multiple Particle Spectrometer (MPS) magnet. The field volume of the MPS magnet is 4.60 meters long meters wide meters high. Downstream of the TPC’s were four Multiwire Drift Chambers used for track calibration. The Au target was upstream of the active volume of the first TPC. This distance was chosen to maintain adequate two track separation to reduce track merging in the front TPC module. The beam was incident on the center of the first TPC. This arrangement covered the forward hemisphere in the center of mass system for rapidities . The beam intensity varied from 500 to 2000 ions per second.
The drift volume of each TPC module is high wide long. The drift volume was filled with a low-diffusion gas mixture (79% Argon, 16% Isobutane and 5% Dimethoxymethane) known to be stable at high gain. The TPC’s were operated at . The high voltage was applied parallel to the magnetic field. The three dimensional coordinates of the hits in the drift volume of each TPC were measured by 12 rows (spaced 3.8 cm apart in the -direction) of long anode wires with 256 wires in each row, ( spacing in the direction). The drift time provides the vertical coordinate, , measured in 1024 time bins and the wire number gives the two horizontal coordinates. The axis points along the beam, the axis is horizontal and points towards the bend direction of positive particles, and the axis points up with the magnetic field directed along the axis. Electrons produced by the charged particles in the drift region must pass through a gating grid and a wire cathode in order to reach the anode wires. A second, solid copper cathode, below the anodes helps to achieve the high gain (Figure 2). The use of short anode wires precludes making measurements. Further details about the TPC construction are given in [5].

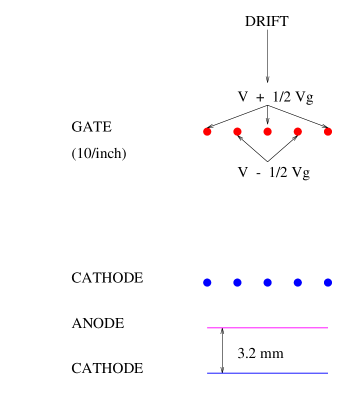

Beam intensity limitations were imposed by positive ion buildup in the drift region and in the amplification region of the TPC. ([7, 8]). For the ions created in the amplification region, the gating grid was used to prevent the transfer of drifting electrons from the drift region to the amplification region and that of positive ions in the reverse direction except for selected events. Gating was achieved by applying different potentials to adjacent wires, as shown in Figure 2 collecting the electrons on the more positive wires. When the trigger system indicates that an event of interest occurred the gate wires were shorted together for , a little longer than the maximum drift time of electrons (the drift velocity of is ), allowing ionization from the tracks to reach the amplification region. Because of their slower drift velocity, positive ions from the amplification at the anode do not reach the gating grid before the gate is closed, further improving the gating of the TPC.
The electronics were mounted directly on the chamber. The circuit for each channel, containing an amplifier-shaper-comparator and memory, is shown in Figure 3. Sixteen channels were assembled in a hybrid package (LeCroy HTD 161S,M) with inputs spaced apart. Shaping time constants were selected to match the anode waveform. An integration time constant of and a differentiation time constant of were chosen in order to minimize noise and maximize two track separation. Each hybrid contains memory capable of recording 1024 time samples from each channel. To reduce local noise pickup, all logic levels are ECL. The clock and address lines are terminated differential ECL. The on-chamber performance of the hybrid allows input sensitivity of less than . One MASTER and seven SLAVE hybrid circuits were assembled on one printed circuit board which is sufficient for 128 anode readouts and is externally accessed by one clock line, one data line and 14 control lines. The Master hybrid had the control logic necessary to read out itself plus the seven slave hybrids. The time samples were obtained at and the data is sequentially read from each channel’s memory at . This serial string of data bits is encoded into wire number, drift time and cluster size by FASTBUS modules in which all rows are encoded simultaneously. Consequently the entire readout is completed in (dead time). More details on the FASTBUS system are given in [9]
The position of the incident beam was measured by two proportional wire chambers upstream of the MPS magnet. The trigger selected centrally enriched events for data recording. A plastic Cherenkov counter was used to select Au ions. A halo veto scintillation counter was used to reject events with interactions upstream of the target. The beam logic was . In order to enrich the trigger for central events, a multiplicity counter was used to select events in which the beam particle interacted with the target and the counter vetoed fragments with . was a scintillation paddle placed just above the beam. The logic for a trigger was . The pulse height in was recorded for every event so that tighter cuts can be applied in the software. Multiplicites of reconstructed tracks often exceed 200, with an estimated reconstruction efficiency for long tracks.
The drift chambers downstream of the TPC’s were used for track calibration of the TPC’s. A target was placed in the beam line upstream of the apparatus to generate a flux of fast parallel tracks filling the TPC volume. These tracks were measured in the TPC’s and drift chambers for field on and off conditions. Extrapolating the drift chamber tracks to the TPC hits under these conditions were used to determine the alignment of the TPC’s (field off) and the corrections (field on) due to electric field inhomogeneities at the edges of the TPC’s.
2.1 Data analysis
The data and analysis of this experiment were published previously in [10]. Events with multiplicities of charged tracks ranging up to 280 were reconstructed, using a three-dimensional tracking program. The total charged track multiplicity at the interaction vertex as reconstructed by the tracking program was used as a measure of centrality. We found from Monte-Carlo studies that this correlates reasonably well with the impact parameter. For the results shown in [10] we selected events with total charged track multiplicities in the acceptance of 220, corresponding to a measured cross section of (or of the geometric cross section). This selection criterion resulted in a sample of 14,114 central events.
Tracks which missed the interaction point by more than were taken to be candidates for a decay vertex. To reduce combinatorial background, we required the decay point to be more than downstream of the interaction point, the reconstructed momentum vector to point back to the production point within (3 cut), and the decay plane to be out of the magnetic field bend plane. In addition, in order to select tracks which had good momentum resolution, we required the sagitta of the measured tracks to be . The data was recorded with a beam rate of ( minimum ionizing). This beam rate resulted in noticeable space charge distortions in the TPC modules in the beam region [7, 8], requiring us to remove from the data sample hyperons decaying with the proton in this region. Specifically, the hyperon candidates with protons having an azimuthal angle within the range, , were removed, where the azimuthal angle, , is measured with respect to axis. All cuts were compensated for in the acceptance calculations. The effective masses for hyperons were calculated by kinematic hypothesis only, by assigning a proton mass to the positive track and a pion mass to the negative track.
Figure 4 shows the result of the effective mass calculation of the hypothesis for the final selected data sample from the target. The dashed histogram represents the effective mass reconstruction from the Monte-Carlo simulation of the experiment. The normalization per one central event is done for both data and Monte-Carlo. The small discrepancy in the tails is due to uncorrected distortions of tracks by the beam. The contribution of this discrepancy is well within the systematic errors. Different values in the peak of the distribution are due to different shapes of the momentum distribution in the data and in the model. Decay vertices with effective masses in the range of 1.104-1.128 GeV/c2 were selected as hyperons. The tails of the effective mass distributions were used for background subtractions. With the above mentioned cuts we obtained 3932 hyperons above background for and . The sample contains a contribution from higher mass states which decay to a that passes the cuts. The main source of these is decay. This contribution is also contained in the model predictions.

The acceptance corrections of the distributions were calculated using a complete Monte-Carlo simulation of the effects of the apparatus and cuts on the final data sample. Events were generated using a modified HIJET model [13]. The shape of the spectrum in this model agrees with the measurements of experiment E810 [11] and the strangeness yield is normalized to and measurements in interactions [16]. The GEANT3 program was used to track the generated tracks through a magnetic field and the simulated signals in the TPC were written out. The generated hits included all the known effects of detector apertures, efficiencies and distortions. (However, see section 2.2 below). The results of this simulation were then analyzed by the same program used to analyze the actual data, including the tracking. A total of 25,000 central interactions were generated and analyzed. The acceptance corrections on the final data sample were done as a function of rapidity and transverse mass. The acceptance was in the range of 2–3% including a correction for neutral decays.
2.2 Correction of Track Reconstruction Efficiencies in E891
In the original analysis described above [10] the hyperon candidates with protons having an azimuthal angle within the range, , were removed, where the azimuthal angle, , is measured with respect to axis and the positive direction corresponds to . The necessity of this angular cut was due to the fact that we could not simulate the dynamic component of the and distortions caused by the positive ion cloud. The positive ion cloud charge density evolves on the time scale comparable to the duration of a spill (300 ms versus 1.2 s). The trigger time is randomly distributed relative to the beginning of the spill and the number of beam particles per spill fluctuates. This could not be successfully simulated in the Monte-Carlo. The angular cuts applied in the original publication did not guarantee that all the proton tracks will completely miss the distortion region. For these protons the Monte-Carlo tracks may be reconstructed with higher efficiency than the data. Since there is a correlation between the momentum of the and the track coordinates in the TPC, this efficiency miscalibration can lead to a change of the measured spectrum shape, which is crucial for determining the flow parameters. Using more stringent cuts to eliminate these tracks leads to a data set too limited to determine the flow parameters.
We have therefore recalculated the efficiency in the region of the distortion using a correction based on data from E866 [14, 15]. The current analysis was also extended to lower rapidity than in [10].


The invariant differential spectra for and were measured in a wide range of rapidities and transverse momenta by experiment E866 and are found to be in a fairly good agreement with the model predictions by ”A Relativistic Cascade Model” (ARC) [12]. We use the ARC model output for the positive particle spectra in order to determine the positive track reconstruction efficiencies as a function of the and coordinates of the track intercept with the front plane of the TPC:
| (1) |
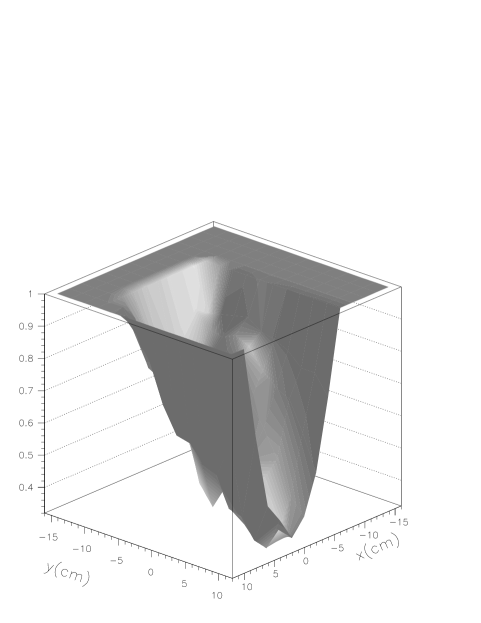
where is number of positive tracks in the real data, is that of the Monte–Carlo with ARC used as input and the numbers indicate the position of the square to be calibrated. The square size of is sufficiently small to insure a continuous dependence of efficiencies as a function of and . We perform the cut on the impact parameter, on the ARC event sample, to achieve the best description of our centrality selection criterion and to match the measured interaction cross section. Figure 5 shows the results of the efficiency calculation according to (1). One can see significant deterioration of the positive track reconstruction efficiency in the neighborhood of the positive ion sheet. The region plotted was chosen to best display the effect in the three dimensional plot. The fact that the efficiency goes smoothly to away from the positive ion sheet demonstrates that the ARC model successfully extrapolated the E866 data in and .
From kinematics it follows that, for relativistic hyperons, the momentum of a proton is almost collinear to the momentum of which produced it. Thus the incident angle of protons from ’s at the front plane of the first TPC is very close to that of a positive particle which came from the target. To illustrate the considerable overlap of the region of reduced efficiency of the positive track reconstruction with the area corresponding to the protons from decay, we show the counts (background subtracted) as a function of coordinates in the front plane of the TPC in Figure 6. A significant fraction of the total number of hyperons comes from protons passing through the region of reduced efficiency as can be seen from this figure. In the region of () and () the track efficiency drops below 80%. The number of ’s going through this region, which have passed all cuts including the azimuthal angle cut, is about 1376.
The calculation shows that ’s affected by the inefficiency arising from the ion cloud have large rapidities and/or low transverse momenta (see Figure 7). The effective values of efficiency corrections for rapidity bins, integrated over , , , and are 1.03, 1.10, 1.21 and 1.36 respectively. The systematic errors for the spectra, defined as the difference between the efficiency corrected data and the data without efficiency correction [10], do not exceed the statistical ones. The double differential spectra and rapidity distribution corrected for the track reconstruction efficiency are shown in Figures 9 and 10.
3 The Blast Wave Parameterization
An interesting phenomenon observed in relativistic collision by experiment E891 is low- suppression in the double differential spectra of hyperons around midrapidity, a deviation from a single exponential scaling valid for lighter nuclei [11] and for interactions. The analogous effect has been observed by experiment E866 for protons [14]. It was suggested in [14] that the effect is due to the strong transverse expansion. The influence of collective nuclear flow has been established at different accelerator facilities. For instance, for the explanation of the different inverse slopes in the momentum distributions for protons and pions at Bevalac in the central collisions at the lab energy of per nucleon, Siemens and Rasmussen [17] suggested that after thermal equilibration the nuclear matter experiences spherically symmetric expansion. According to the Bjorken scenario of one dimensional longitudinal expansion [18], the spectra of particles produced in ultra-relativistic heavy-ion collisions are boost invariant. Such a spectrum can be represented as superposition of the thermal sources distributed uniformly over a limited interval of the longitudinal boost angle, [19] 111The longitudinal boost angle, , is essentially the rapidity of the moving source.:
| (2) |
where rapidities and are measured in the center of mass frame. The limits of the boost invariance interval, , are confined between the projectile and the target rapidities. Assuming that the longitudinal and the transverse expansion can be decoupled, P. Braun-Munzinger et al [19] used expression (2) integrated over the transverse mass squared to evaluate the rapidity distributions of different hadrons in interactions at AGS energy. Fairly good description of the rapidity distributions was achieved with the temperature, , and the mean longitudinal expansion velocity, . However, no attempt to parameterize the double differential distributions in a wide range of rapidities was made in this article. For the description of invariant differential multiplicity at midrapidity the authors applied expression (A8) from [20], which is intended for the description of the transverse mass distribution integrated over rapidity, not the invariant differential distribution! The disadvantage of such parameterization is that sources at different rapidities actually interfere with each other. Unlike the SPS energies, where a modest boost of an observer in the longitudinal direction does not change the velocities of the receding nucleon pancakes, the AGS energy is not sufficiently high for the boost invariant expansion to take place. In addition, nonzero curvatures of the reduced invariant differential multiplicities of baryons, , on a logarithmic scale, indicate the presence of a transverse radial expansion with the strength varying as a function of rapidity. The longitudinal and the transverse expansion may be decoupled accurately only in the limit of nonrelativistic transverse velocities. Therefore, we believe that the correct procedure of determining the flow velocity profile is a parameterization of the double differential spectra of particles. In this procedure the rapidity distributions and integrated transverse mass distributions will be described automatically.
Usually the transverse velocity is extracted by fitting the spectrum assuming a power law of the transverse expansion velocity and a constant density, (see, for example [19]). From the cascade simulations it is known that the density resembles a gaussian profile, , which can lead to significant consequences to the parameters obtained from a fit [22]. For the traditionally used uniform density profile, as well as for a gaussian density distribution, the integration over the transverse expansion velocity selects non-zero velocities due to the rising factor, . The probability for a particle to have a transverse collective velocity, , has a peak at a value defined by parameters and in case of a gaussian density. Our data on the double differential multiplicities, however indicates that a stronger selection of the transverse expansion velocities is present in reality, which is consistent with the creation of a transverse blast wave for the central interactions. The development of the blast wave due to the sudden creation of hot dense matter was originally advocated in [17] where the spherical blast wave scenario was used to account for different apparent temperatures for and . While apparent temperatures, the asymptotic values of the inverse slopes of reduced invariant differential cross sections, are not strongly sensitive to the probability distribution for collective velocities, the low- slopes are. It was pointed out in [23] that the step-like freeze-out distance distribution, widely used for experimental parameterization of transverse expansion (see for example [19]) is quite different from the one observed in RQMD, where the freeze-out close to the collision axis is suppressed. Before experiencing the final interaction the particles are propagated to the periphery of the system, where they acquire the essential collective motion [23]. This statement, together with the power-like transverse velocity profile is consistent with a blast wave scenario. It was also claimed in [23] that it is impossible to describe a spectrum with a single temperature and transverse expansion velocity. We will demonstrate that the spectrum of hyperons can be described in terms of an aspherical blast wave with a single temperature.
The influence of the transverse blast wave on the low- slopes of the reduced invariant differential cross sections can be understood by noting that the spectrum in a given rapidity bin originates primarily from sources, macroscopic elements of nuclear matter, with a limited rapidity range. One can thus follow this influence by considering the transversely expanding ring at this given rapidity. Boosting the invariant Boltzmann distribution in the transverse direction by velocity ,
| (3) |
and integrating this expression over the azimuthal angle, , one can derive the equation for a spectrum from the transversely expanding ring:
| (4) |
where
| (5) |
and functions and are the modified Bessel functions of the zeroth and the first order respectively. The low- slopes for the of reduced invariant differential cross section can be found by resolving the logarithm of equation (4) divided by into a Taylor series in the vicinity of , assuming , and saving only the linear term:
| (6) |

The factor multiplying the transverse kinetic energy, , represents the low- slope of the reduced invariant differential cross section on a logarithmic scale. On Figure 8 the low- slopes are shown for various hadrons as a function of the transverse expansion velocity for a fixed temperature of . One can see that for sufficiently high transverse expansion velocities the slopes become positive, yielding the low- suppression. It is worth noting that for mesons the low- slope shows the opposite behavior, though of smaller magnitude. Generally, the condition must be satisfied for low- suppression to take place. The higher the temperature of the hadron gas the less affected is the low- slope of the spectrum.
We represent the inclusive spectrum as a continuous superposition of flowing Boltzmann sources with an effective temperature, . The effective flow is described by an azimuthally symmetric surface in the space of the longitudinal boost angle, , and the transverse two-dimensional velocity, the Blast Wave. The blast wave in our approach belongs to the interval, , where both limits are measured in center of mass system. An expression for the invariant differential multiplicity reads as follows:
| (7) |
| (8) |
| (9) |
| (10) |
Choosing the flow velocity profile and the rapidity distribution of the emission power of the blast wave, we employ the following simple functions:
| (11) |
where . Rapidities, and , are measured in the center of mass frame of the collision system and the transverse velocity, , is measured in a system co-moving with . The functions and are chosen to allow one to tune the shape of the blast wave to the data. One can easily see that with and the function describes a spherical blast wave, where for the emission power is uniformly distributed along the surface of the blast wave. With and , one encounters purely transverse expansion, as in the Landau scenario [21]. It can be also seen that the boost invariant Bjorken cylinder can be described with . With positive values of parameters and , the functions above reflect the experimental fact of increase of the transverse expansion velocity towards midrapidity, which is seen from the increase of the low- slope of the reduced invariant differential cross section on a logarithmic plot (see Figure 9).

Mean rapidity and the transverse velocity in the blast wave are given by the following expressions:
| (12) | |||||
| (13) |
where averaging is performed over the forward hemisphere in the center of mass system. The rapidity distribution and the total number of particles emitted by this source are
| (14) |
| (15) |
respectively, where , , is the gamma function, and
| (16) |
is the Boltzmann rapidity distribution.

We have applied the formulas listed in this paragraph to obtain the expansion parameters as well as the mean temperature of hyperons after the freeze-out. The obtained parameters , , , , , are listed in Table 1 together with the mean source rapidity, , the mean transverse expansion velocity, , and the integrated yield, derived from the above six parameters.
| E891 | RQMD cascade | RQMD mean fields | |
|---|---|---|---|
4 Results and Discussions
In Table 1 the results of the parameterizations of the double differential multiplicities for the production measured by E891 are listed together with the results obtained from the cascade version of RQMD and the version of RQMD with mean field potentials turned on. For comparison with RQMD model predictions we have selected the sample of central events with the cut on the impact parameter, . This value of the cut was chosen, since the resulting geometric cross section, , matches the cross section we obtain and the resulting differential multiplicities agree well with our measurements 222In Reference [10] the cut of was chosen in models for comparison with our data.. One can see that the cascade version of RQMD underpredicts the longitudinal and the transverse flow, which can be verified by comparing the mean transverse expansion velocity, , and the mean longitudinal boost angle, . This fact can also be seen on the plots of double differential multiplicity for production (Figure 9) where the cascade version of RQMD fails to describe the low- suppression effect in the midrapidity region. The rapidity distribution of the hyperon measured by E891 (Figure 10) has a larger width than predicted by RQMD cascade, which corresponds to the smaller strength of longitudinal flow in the cascade. One can also see in Table 1 that all the parameters of the Blast Wave obtained by fitting the results of RQMD with mean fields turned on agree with the ones obtained by fitting the data within experimental uncertainties. The low- suppression effect is reproduced by this version of RQMD and the width of the rapidity distribution agrees well with the experimentally measured width.
5 Conclusions
Based on the agreement of the predictions of RQMD with mean fields with our measurements for the double differential and rapidity distributions for production in the central interactions and underestimation of the flow strengths by RQMD cascade we can confirm that the mean field effects play important role in the dynamics of the interactions at the AGS energy.
References
- [1] C.M. Hung and E.V. Shuryak, Phys. Rev. Lett. 75 (1995) 4003.
- [2] D. Rischke and M. Gyulassy, Nucl. Phys. A597 (1996) 701.
- [3] H. Sorge, Phys. Rev. Lett. 78 (1997) 2309.
- [4] I.Y. Ollitrault, Phys. Rev. D 48, (1993) 1132.
- [5] A. Etkin et al., IEEE Trans. on Nucl. Sci. 36 part I (1989) 58.
- [6] A. Etkin et al., NIM A283 (1989) 577.
- [7] A. Etkin et al., NIM A323 (1992) 224.
- [8] A. Etkin et al., IEEE Trans. Nucl. Sci. 39 (1992) 696.
- [9] A.C. Saulys et al., Comp. Phys. Comm. 57 (1989) 353.
- [10] S. Ahmad et al., Phys. Lett. B382 (1996) 35.
- [11] S.E. Eiseman et al., Phys. Lett. B297 (1992) 44.
- [12] Y. Pang et al., Phys. Rev. Lett. 68 (1992) 2743.
- [13] A. Shor and R. Longacre, Phys. Lett. B218 (1989) 100.
- [14] K. Shigaki et al. Nucl. Phys. A590 (1995) 519c.
- [15] L. Ahle et al., Nucl. Phys. A590 (1995) 249c;
- [16] F. Vidabaek for E802 collaboration, Nucl. Phys. A590 (1995) 249c.
- [17] P.J. Siemens and J.O. Rasmussen, Phys. Rev. Lett. 42 (1979) 880.
- [18] J.D. Bjorken, Phys. Rev. D27 (1983) 140.
- [19] P. Braun-Munzinger et al., Phys. Lett. B344 (1995) 43.
- [20] E. Schnedermann et al., Phys. Rev. C48 (1993) 2462.
- [21] L.D. Landau, Izv. Ross. Akad. Nauk Ser. Fiz. 17 (1953) 51.
- [22] J. Konopka et al., LANL preprint nucl-th/9607015.
- [23] Matiello et al., Phys. Rev. C55 (1997) 1443.