LA-UR-96-1582
Evidence for
Oscillations from the LSND Experiment at LAMPF
Abstract
A search for oscillations has been conducted at the Los Alamos Meson Physics Facility by using from decay at rest. The are detected via the reaction , correlated with a from (). The use of tight cuts to identify events with correlated rays yields 22 events with energy between 36 and and only background events. A fit to the events between 20 and yields a total excess of events. If attributed to oscillations, this corresponds to an oscillation probability of ()%.
pacs:
14.60.Pq, 13.15.+gWe present the results from a search for neutrino oscillations using the Liquid Scintillator Neutrino Detector (LSND) apparatus described in reference [1]. The existence of neutrino oscillations would imply that neutrinos have mass and that there is mixing among the different flavors of neutrinos. Candidate events in a search for the transformation from neutrino oscillations with the LSND detector have previously been reported [2] for data taken in 1993 and 1994. Data taken in 1995 have been included in this paper, and the analysis has been made more efficient.
Protons are accelerated by the LAMPF linac to 800 MeV kinetic energy and pass through a series of targets, culminating with the A6 beam stop. The primary neutrino flux comes from produced in a 30-cm-long water target in the A6 beam stop [1]. The total charge delivered to the beam stop while the detector recorded data was 1787 C in 1993, 5904 C in 1994, and 7081 C in 1995.
Most of the come to rest and decay through the sequence , followed by , supplying with a maximum energy of MeV. The energy dependence of the flux from decay at rest (DAR) is very well known, and the absolute value is known to 7% [1, 3]. The open space around the target is short compared to the pion decay length, so only 3% of the decay in flight (DIF). A much smaller fraction (approximately 0.001%) of the muons DIF, due to the difference in lifetimes and that a must first DIF. The total flux averaged over the detector volume, including contributions from upstream targets and all elements of the beam stop, was /proton.
A component in the beam comes from the symmetrical decay chain starting with a . This background is suppressed by three factors in this experiment. First, production is about eight times the production in the beam stop. Second, 95% of will come to rest and are absorbed before decay in the beam stop. Third, 88% of from DIF are captured from atomic orbit, a process which does not give a . Thus, the relative yield, compared to the positive channel, is estimated to be . A detailed Monte Carlo simulation [3], gives a value of for the flux ratio of to .
The detector is a tank filled with 167 metric tons of dilute liquid scintillator, located about 30 m from the neutrino source, and surrounded on all sides except the bottom by a liquid scintillator veto shield. The dilute mixture allows the detection in photomultiplier tubes (PMTs) of both Čerenkov light and isotropic scintillation light, so that reconstruction provides robust particle identification (PID) for along with the position and the direction of the event. PID is based on the quality of the position and Cerenkov angle fits, and on the relative amount of early light [1]. The detector needs to distinguish between events induced by (oscillation candidates) from the events produced by the . LSND detects via a process with a well-known cross section [4], followed by the neutron-capture reaction (2.2 MeV). Thus the oscillation event signature consists of an “electron” signal, followed by a photon correlated with the electron signal in both position and time. Detection of DAR in LSND is dominated by charged current reactions on , but an electron from has energy MeV because of the mass difference of and the lowest lying state. Moreover, the DAR production of a correlated photon from can occur only for MeV because of the threshold for free neutron production.
Cosmic rays are suppressed at the trigger level by use of the veto shield and by rejecting events with any evidence for a muon in the previous 15.2 s [1]. Even so, the trigger rate is dominated by this background, with actual -induced events contributing less than of all triggers. Because the data acquisition and triggering [1] do not depend on whether the beam is on or off, the beam-on to beam-off duty ratio could be measured from triggered events; it averaged 0.070 over the three years of data. The beam-unrelated background in any beam-on sample is thus well measured from the much larger beam-off sample, and can be subtracted. The cuts used to select candidates are designed to discriminate heavily against this background, so that the statistical error from this subtraction can be kept small relative to the beam-dependent signal.
Separation of correlated neutron-capture photons from accidental signals is achieved using an approximate likelihood ratio, [2, 5], for the correlated and accidental hypotheses. is defined using distributions [5] of the number of hit PMTs for the reconstructed and of the time and distance between the primary event and that . For purposes of fitting, the distribution for accidental photons is taken from laser calibration events. That for correlated photons is taken from cosmic ray neutron events either directly or as modified for the lower-energy neutrons of interest by using a Monte Carlo simulation of the distance distribution, with fit results averaged over the two cases.
We present analysis of the full 1993+1994+1995 data sample for two sets of positron selection cuts. Selection A corresponds to the criteria used in our previous paper on the 1993 and 1994 data [2]. Selection B uses new insight into the nature of the beam-off backgrounds to further reduce these backgrounds while relaxing other criteria to increase the signal efficiency by about 40%. The criteria were chosen, and efficiencies determined, using several control samples taken as part of the data stream. A sample of “Michel” electrons from the decays of stopping cosmic ray muons is used to characterize energy calibration, resolution and PID. Cosmic ray neutrons stopping in the detector are used for the 2.2 MeV properties and as a “non-electron” control sample for electron PID. Other neutrino induced interactions in the detector including [6], and are also used to check efficiencies and backgrounds. Random triggers in association with tank calibration are used to determine veto efficiencies, readout deadtime, and the distribution of for accidentally coincident .
The primary particle in a event candidate is required to have a PID consistent with a positron. The selection A criteria for PID were previously described [2], giving an efficiency for positrons in the MeV energy range of . Selection B loosens the PID criteria to increase the positron PID efficiency to .
Selection A removed all events with the time to the previous triggered event, to eliminate Michel electrons from muon decay. Selection B required greater than , and no activities between and before the event trigger time with more than 50 PMT hits or reconstructed within 2m from the positron position. The selection A and B efficiencies are and , respectively. The time to any subsequent triggered event, , is required to be ( muon lifetimes) to remove events which are misidentified muons which decay ( efficiency). The reconstructed positron location was required to be a distance cm from the surface tangent to the faces of the PMTs ( efficiency). This assures that the positron is in a region of the tank in which the energy and PID responses vary smoothly and are well understood. The 35 cm cut also avoids the region of the tank with the highest cosmic ray background.
To suppress cosmic ray neutrons, the number of associated with is required to be no more than for selection A ( efficiency) and no more than for selection B ( efficiency). Cosmic ray neutrons that enter the detector often produce one or more additional neutrons, while recoil neutrons from the reaction are too low in energy to knock out additional neutrons. The number of veto shield hits associated with the events is no more than for selection A ( efficiency) and no more than for selection B ( efficiency).
Beam-off data surviving these cuts differ from the expected neutrino interaction signal in two respects. One is the distribution of angles between the direction and its position vector relative to the tank center – background events tend to head inwards. The other is in the distribution of veto hits – cosmic ray events tend to have more of them. These two distributions are used in a way analogous to the R parameter discussed earlier in defining a likelihood ratio, [5], which is used as the final positron selection criterion. For selection B, but not A, we require , a cut that loses 13% of the expected neutrino signal while eliminating 33% of the beam-off background. Including a data acquisition efficiency gives overall efficiencies of for selection A, and for selection B.
The backgrounds to followed by capture fall into three general classes: beam-off events (cosmic ray induced), beam-related events with correlated neutrons, and beam-related events with an accidental . As outlined above, the cosmic ray background to beam-on events is 0.07 times the number of beam-off events which pass the same criteria.
The major sources of beam-induced backgrounds are from DAR, discussed above, and from DIF in the beam stop. The latter results in a background from interactions where the final is missed, and its Michel decay positron is mistaken for a primary event. These backgrounds are estimated using the detector Monte Carlo simulation [1, 5]. The backgrounds with accidental overlap are greatly reduced by selection on the parameter. Details of all backgrounds considered are presented in Ref. [5].
| Selection | Signal | Beam-Off | Bkgd. | Excess | |
|---|---|---|---|---|---|
| A | 221 | ||||
| A | 13 | ||||
| B | 300 | ||||
| B | 22 | ||||
| B’ | 99 | ||||
| B’ | 6 |
Table I lists the number of signal, beam-off background and neutrino-background events for the two selections with MeV – to avoid large accidental- backgrounds. The likelihood ratio, , is used to determine whether a candidate 2.2 MeV is correlated with an electron or from an accidental coincidence. Requiring (correlated- efficiency = 0.23) we observe 22 events beam-on and events beam-off. The estimated beam-related background consists of events with correlated neutrons, and without. The probability that the beam-on events are entirely due to a statistical fluctuation of the event expected total background is . Figure 1(a) shows the energy distribution of all primary electrons which pass selection B with associated . Figure 1(b) shows the electron energy distribution for selection B with .

Kolmogorov tests have been done to check for unexpected concentrations of events in position (e.g., in regions of high cosmic ray or backgrounds), energy or time (year). No consistency check yields a probability so low as to demonstrate a serious inconsistency [5]. A restrictive geometric cut, removing the 55% of the selection B acceptance with highest cosmic ray rates [5], also demonstrates no inconsistency; its results are labelled B’ in Table I.
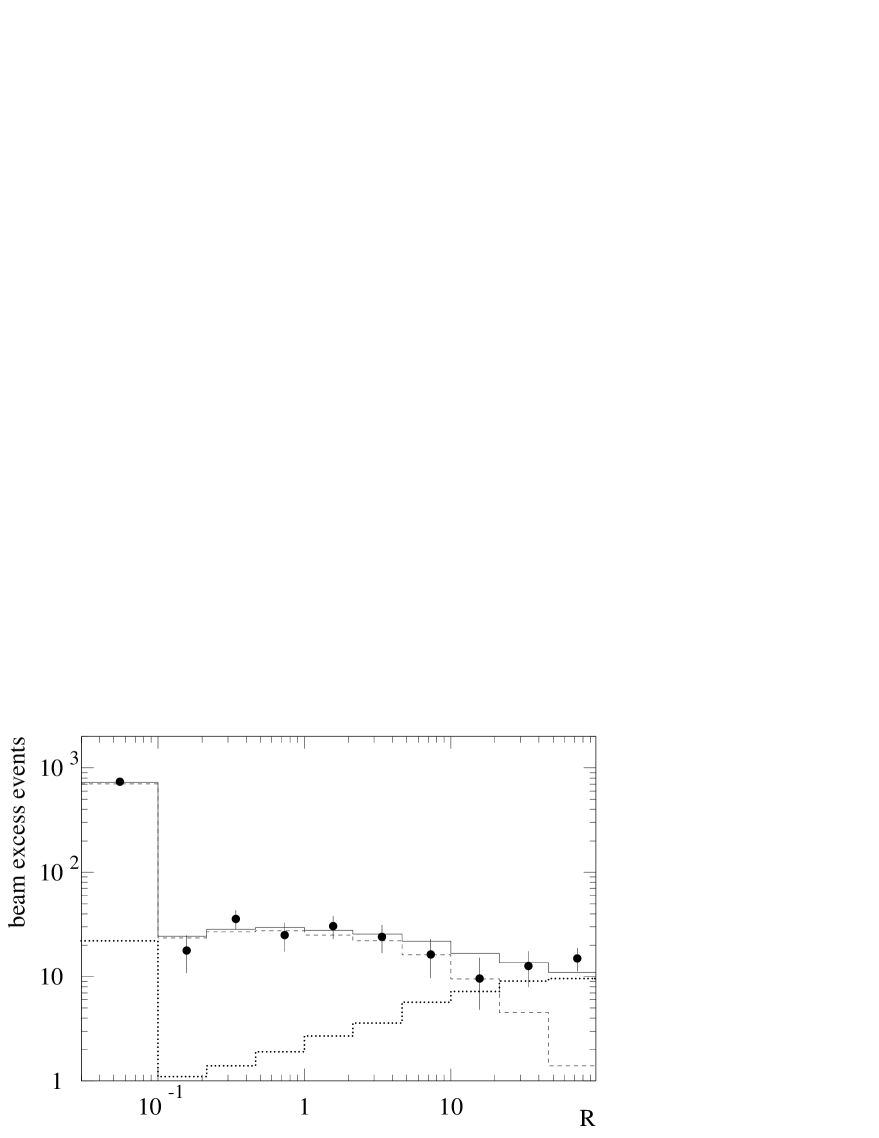
To determine the oscillation probability we fit the overall distribution, for events satisfying selection B, in the full energy range MeV. The larger energy range is used in this and the following fit to utilize the maximum amount of data and is made possible by our increased understanding of the background processes. The 1763 beam-on and 11981 beam-off events were fit by a method which took spatial variations in accidental photon rates into account by averaging the appropriate distributions at the positions of each positron. The result of the fit is shown in Fig. 2. It yielded beam-related events with a correlated , and beam-related events without a correlated . The latter is consistent with a calculated background estimate of such events. Subtracting the estimated neutrino background with a correlated ( events) results in a net excess of events, corresponding to an oscillation probability of , where the second error is systematic. A likelihood fit which uses individual local accidental- distributions for each positron gave a consistent result of .
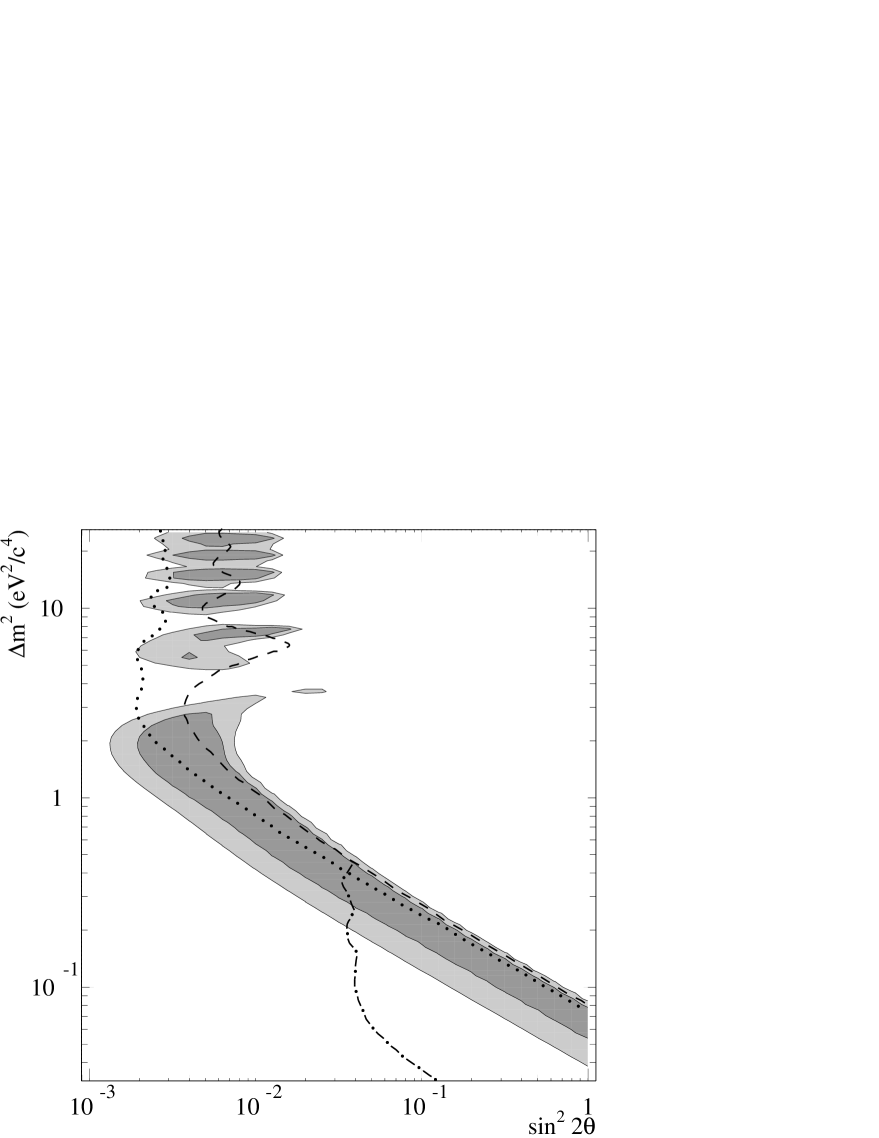
For simplicity we present the results in the two-generation formalism, in which the mixing probability is written as , where is the mixing angle, is the difference of the squares of the two mass eigenstates in eV2, is the distance from neutrino production in meters, and is the neutrino energy in MeV. An overall likelihood fit has been made to determine favored regions in the versus parameter space for two-neutrino mixing. The fit was made to distributions in the observed event energy, the neutron likelihood ratio , the reconstructed direction of the electron relative to the neutrino beam direction, and the distance of the primary event from the beam stop neutrino source. The beam-related and cosmic ray backgrounds were added to the expected neutrino oscillation signal, and a likelihood was calculated for a range of versus values. Figure 3 shows regions which are within 2.3 and 4.5 log-likelihood units of the maximum, called 90% or 99% likelihood regions. The regions have been enlarged to account for systematic effects by varying the inputs to the fit to reflect uncertainty in backgrounds, neutrino fluxes and the distribution shape. Figure 3 also shows the C.L. limits from KARMEN at ISIS [7] (dashed curve), E776 at BNL (dotted curve) [8], and the Bugey reactor experiment [9] (dot-dashed curve).
This paper reports the observation of 22 electron events in the energy range that are correlated in time and space with a low-energy with , and the total estimated background from conventional processes is events. The probability that this excess is due to a statistical fluctuation is . A fit to the full energy range gives an oscillation probability of %. These results may be interpreted as evidence for oscillations within the favored range of Fig. 3.
The authors gratefully acknowledge the support of Peter Barnes, Cyrus Hoffman, and John McClelland during this experiment. This work is conducted under the auspices of the US Department of Energy, supported in part by funds provided by the University of California for the conduct of discretionary research by Los Alamos National Laboratory. This work is also supported by the National Science Foundation.
REFERENCES
- [1] C. Athanassopoulos et. al. , LA-UR-96-1327, submitted to Phys. Rev. C.
- [2] C. Athanassopoulos et. al. , Phys. Rev. Lett. 75, 2650 (1995).
- [3] R. L. Burman, M. E. Potter, and E. S. Smith, Nucl. Instrum. Methods A291, 621 (1990); R. L. Burman, A. C. Dodd, and P. Plischke, Nucl. Instrum. Methods in Phys. Research A368, 416 (1996).
- [4] C. H. Llewellyn Smith, Physics Reports 3, 262 (1972); P. Vogel, Phys. Rev. D 29, 1918 (1984); E. J. Beise and R. D. McKeown, Comm. Nucl. Part. Phys. 20, 105 (1991).
- [5] C. Athanassopoulos et. al. , LA-UR-96-1326, submitted to Phys. Rev. C.
- [6] M. Albert et. al. , Phys. Rev. C 51, 1065 (1995).
- [7] B. Bodmann et. al. , Phys. Lett. B 267, 321 (1991); B. Bodmann et. al. , Phys. Lett. B 280, 198 (1992); B. Zeitnitz et. al. , Prog. Part. Nucl. Phys., 32 351 (1994).
- [8] L. Borodovsky et. al. , Phys. Rev. Lett. 68, 274 (1992).
- [9] B. Achkar et. al. , Nucl. Phys. B434, 503 (1995).