Existence of long-lived isotopes of a superheavy element
in natural Au
Abstract
Evidence for the existence of long-lived isotopes with atomic mass numbers 261 and 265 and abundance of (1-10)x10-10 relative to Au has been found in a study of natural Au using an inductively coupled plasma - sector field mass spectrometer. The measured masses fit the predictions made for the masses of 261Rg and 265Rg (Z=111) and for some isotopes of nearby elements. The possibility that these isotopes belong to the recently discovered class of long-lived high spin super- and hyperdeformed isomeric states is discussed.
pacs:
21.10.-k, 21.10.Dr, 21.10.Tg, 27.90.+bLong-lived isomeric states of 211Th, 213Th, 217Th and 218Th have been reported recently in natural Th, with abundances of (1-10)x10-11 relative to 232Th mar06 . The evidence for the existence of the isomeric states in the Th nuclei was obtained in accurate mass measurements using an inductively coupled plasma - sector field mass spectrometer (ICP-SFMS), operated at medium mass resolution. These results motivated us to search for a similar phenomenon in the region of superheavy elements. If, for instance, Rg (Z=111) exists in nature, it might be found with Au, its nearest chemical homologue. Unlike Th, where the g.s. masses of the neutron-deficient isotopes are known aud03 , in the case of the relevant superheavy elements, one has to rely on mass predictions. One finds, however, that various predictions mol95 ; kou03 ; lir01 for the atomic masses of the Rg isotopes with mass numbers between 259 and 269 (mass region studied here) differ from one another by at the most 0.003 u. This value is small compared to the experimental uncertainty in our ICP-SFMS measurements. Also, the average prediction mol95 ; kou03 ; lir01 for the mass of the g.s. of for instance 261Rg is 261.154 u and for the g.s. mass of 261Au mol95 ; kou03 is 261.331 u, values well separated by the ICP - SFMS.
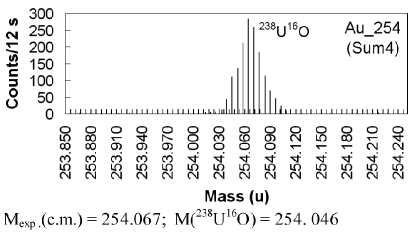
In principle, native Au would be the best material to analyze. However, it was found mar06 that background was the main obstacle when looking for isotopes with relative abundances of (1-10)x10-11. Therefore, pure natural Au solutions were used in our measurements. It is reasonable to assume that Rg (if it exists), or a significant part of it, will follow Au in the chemical purification process. In the present work, we have performed accurate mass measurements for masses 254 (for checking and correcting the calibration using the 238U16O peak) and 259 to 269. Evidence for the existence of isotopes with masses that fit the predictions for the masses of 261Rg and 265Rg was obtained.
The experimental procedure was similar to that described earlier mar06 . The instrument was an Element2 (Finnigan, Thermo-Electron, Bremen, Germany). The predefined medium resolution mode m/m = 4000 (10% valley definition) was used throughout the experiments to separate atomic ions from molecular interferences with the same mass number. The sensitivity-enhanced setup of the instrument was similar to that described in Ref. rod04 . This setup provided sensitivity for 197Au in this resolution mode of up to 7x10⁷ counts s-1mg-1l-1. The sample uptake rate was approximately 60-80 l min-1. Methane gas was added to the plasma to decrease the formation of molecular ions rod05 . Oxide and hydride formation (monitored as UO+/U+ and UH+/U+ intensity ratios) were approximately 0.04 and 1x10⁻⁵, respectively. Mass calibration was performed using the 115In+, 232Th+, 235U+, 238U+ and 238U16O+ peaks. The 115In peak was used for on-line mass drift correction. Two stock solutions, “A” and “B”, of 1000 mg Au in 1 l of 10% HCl, were obtained from two manufacturers (Customer Grade and Spex, LGC Promochem AB, Borås, Sweden). Complete elemental screening was performed on both solutions to assess the impurity concentration levels. The following concentrations (expressed as ppm of the Au concentration) of certain trace elements that can potentially give rise to spectrally interfering molecular species are given below:
A: U 0.01, Th 0.3, Bi 67, Pb 11, Tl 0.1, Hg 0.3, Pt 104, Os 16, Gd 0.005, Ba 0.9, Cs 0.05, I 10, Te 0.07, Ag 0.4, Zn 3, S 69, Si 51, Al 19, Na 33.
B: U 0.01, Th 0.3, Bi 104, Pb 18, Tl 0.3, Hg 1, Pt 124, Os 25, Gd 0.005, Ba 0.9, Cs 0.06, I 5, Te 0.1, Ag 0.6, Zn 6, S 182, Si 237, Al 36, Na 149.
The solutions were analyzed on September 13, 2006. A range of about 0.4 u, divided into 65 channels, was scanned in each measured spectrum. The masses 254 and 259 to 269 were analyzed with an integration time per channel of 3 s. Both solution A and solution B were diluted to 20 mg Au l-1 of 0.7 M HNO3, and each was measured twice. Altogether, four spectra were taken with the Au solutions for each mass number studied. Replicate analyses of blank solution (0.7 M HNO3) were performed. Instrumental sensitivity varied among runs as a result of matrix effects caused by the introduction of highly concentrated solutions into the ICP source.
Figure 1 shows the sum spectrum of the four measurements of mass 254, where the peak of 238U16O+ is seen. The FWHM of the peak is about 0.030 u. The spectrum shows a shift of 0.021 u in the peak position. A similar shift, of 0.015 u was observed at mass 265 for the 232Th16O21H+ peak (Fig. 3(b)). Based on these shifts, a correction of -0.018 u was applied throughout the measurements. However, shifts of up to about 0.025 u were seen in some of the measurements.
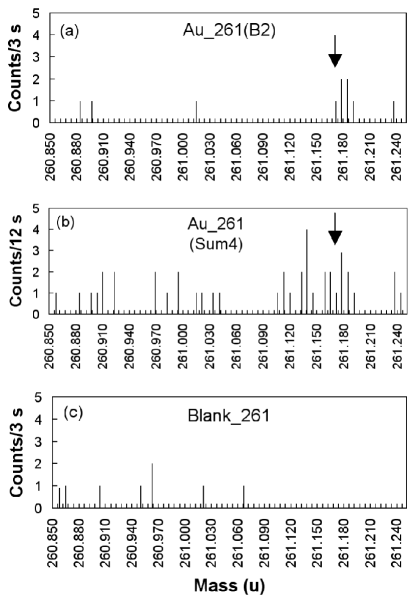
Below are the results for masses 261 and 265. For each mass number, three spectra are presented. The first is the “best” of the four measured spectra. The second is the sum of the four individual spectra, and the third shows a spectrum obtained with the blank.
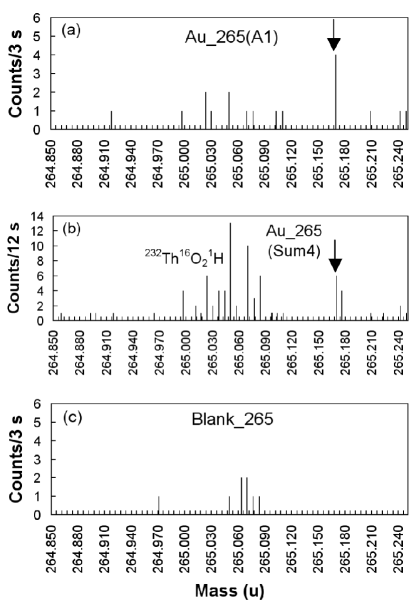
Figure 2 displays the results for mass 261. The arrows in Fig. 2(a) and 2(b) indicate the position of the predicted 261Rg mass, corrected for the shift discussed above. This mass was taken as the average of the predictions given in Refs. mol95 ; kou03 ; lir01 . A pronounced group of six events is seen In Fig. 2(a), at a mass that fits the 261Rg mass prediction. In Fig. 2(b) a group of 22 events is seen at a mass that fits the predicted mass of 261Rg. Although this group is somewhat broad, we assume that it is a single group since it is not broader than the 232Th16O21H group seen in Fig. 3(b). (The width of the latter is typical for a single group, since, as can be seen in Table II, the masses of the Th and U molecules are very close to one another, and all the other possible molecules have lower masses.) However, if one assumes that the four events at the low mass end of this peak are due to background, then 18 events are seen in this group.
The results obtained for mass 265 are given in Fig. 3. A group of four events is seen in Fig. 3(a) at a mass that fits the predicted mass of 265Rg. The sum spectrum of the four individual measurements is presented in Fig. 3(b). In addition to a peak due to 232Th16O21H, a group of ten events is seen at a mass which fits the prediction for the mass of 265Rg.
The statistical significance of the newly observed peaks, that correspond to the predicted masses of the corresponding Rg isotopes, was calculated as described in Ref. mar06 : The probability P’acc. that n out of a total number of N randomly distributed counts will occur accidentally in a small mass region r out of a total mass region R is given by
P’acc. = (r/R)n(1-(r/R))(N-n). (1)
The total probability that such a group will occur accidentally in a predefined region r out of a total region R is given by
Pacc. = P’acc.(r/R). (2)
In calculating the values of Pacc. for the data given in Figs. 2(a) and 2(b), the value of R was chosen as the whole measured region. For the results displayed in Figs. 3(a) and 3(b), the region of the molecular ion 232Th16O21H was removed from the total region.
| Mass | Fig. | No. of | Pacc. | M111The uncertainty in mass is estimated to be 0.025 u. | Mass of |
|---|---|---|---|---|---|
| no. | no. | events | Rg isotope222Average of predicted values, Refs. mol95 ; kou03 ; lir01 . | ||
| 261 | 2(a) | 6 | 5x10⁻⁷ | ||
| 261 | 2(b) | 22(18) | 3x10-6333Because of the different widths of the lines, the same value is obtained for 22 and 18 events lines. | 261.134444For 18 counts M=261.142 | 261.154 |
| 265 | 3(a) | 4 | 3x10⁻⁷ | ||
| 265 | 3(b) | 10 | 1x10⁻⁹ | 265.154 | 265.151 |
The results are summarized in Table I. Column 3 gives the number of events, with measured masses in accord with the predicted masses of the corresponding Rg isotopes. Pacc. values are given in column 4. Column 5 gives the measured masses of the events in Figs. 2(b) and 3(b), corrected for the 0.018 u shift in mass calibration. Column 6 gives the averages of the predictions in Refs. mol95 ; kou03 ; lir01 for the g.s. masses of the Rg isotopes with the same mass number. It should be mentioned that the different predictions differ by no more than 0.002 u and 0.003 u from one another for 261Rg and 265Rg, respectively.
| 261 | 265 | ||
| Molecular | Mass | Molecular | Mass |
| ion | ion | ||
| 238U23Na | 261.041 | 238U27Al | 265.032 |
| 232Th29Si | 261.015 | 232Th16O21H | 265.036 |
| 197Au64Zn | 260.896 | 197Au68Zn | 264.891 |
| 133Cs128Te | 260.810 | 138Ba127I | 264.810 |
| 261Au | 261.331 | 265Au | 265.360 |
We have been unable to match the signals of the suspected Rg isotopes with any molecular ions. Usually, as seen in Table II and in Figs. 1 and 3(b), because of the binding energies, the masses of the molecules are lower than the masses of the new peaks reported here. On the other hand, the predicted masses of the extremely neutron-rich nuclei 261Au and 265Au are higher than the observed peaks.555In Fig. 2b, some events are seen in the mass regions of 232Th29Si and 197Au64Zn. However, since we did not see the 232Th28Si peak at mass 260 (28Si/29Si 20), the events around 261.015 u are not due to 232Th29Si. As mentioned, Pacc. for the peak at 261.134 u was estimated assuming that all the events outside this peak are due to background.
Another possibility that should be considered is the potential presence of hydrocarbon-based molecular ions from pump oil. However, there are no hydrocarbon candidates for masses 261 and 265, and typical hydrocarbon masses lie well above the predicted masses of the Rg isotopes with the same mass number. For instance, the masses of CH3(CH2)16CH3 and CH3(CH2)17CH3 are 254.297 u and 268.313 u aud03 , respectively, whereas the predicted masses of the respective Rg isotopes are 254.164 u kou03 and 268.152 u mol95 ; kou03 ; lir01 . On the other hand, it is evident from the data in Table I that the masses of the measured new peaks fit predictions for the g.s. masses mol95 ; kou03 ; lir01 of the corresponding Rg isotopes within 0.020 u.
Based on the mass measurements alone, one cannot conclude whether the newly observed peaks are due to Rg isotopes or to isotopes of the adjacent superheavy elements Ds and element 112. Since the peaks appeared in practically pure Au solutions, where the concentration of Pt and Hg, the nearest chemical homologues of Ds and element 112, are about 1x10⁻⁴ and 1x10⁻⁶ of Au, respectively (see above), it is reasonable to assume that they could be due to Rg.
It is estimated that the concentration of these Rg isotopes amounts to (1-10)x10-10 of 197Au (about (2-20)x10-15 of the solutions).
The predicted g.s. half-lives of these Rg isotopes are very short, of the order of 1 s mol97 . This suggests that the observed events are due to long-lived Rg isomers. (The accuracy of the present experiment is not sufficient to determine the excitation energies of the isomeric states relative to the predicted normal g.s. masses.) If their initial terrestrial concentration was similar to that of 197Au, then the lower limit on their half-lives would be about 1x10⁸ y.
The character of the observed isomeric states has not been measured directly. As discussed in the case of the Th isomers (Ref. mar06 and references therein), it seems that these isomeric states cannot represent the high spin isomers that occur near doubly closed shells, since they are far from the nearest predicted nil69 ; mos69 spherical doubly closed shells at Z = 114 and N = 184. Nor can they be related to the fission isomers found in actinides, since their lifetimes are in the region of ns to ms. As mentioned in Ref. mar06 , it is also not reasonable to assume that they are due to high spin K-type isomers, since the lifetimes of all the known K-isomeric states in neutron-deficient nuclei with Z84, are not longer than several minutes. It might be reasonable to assume that as in the case of the Th isomers, the isomeric states seen in the present experiment are due to the recently discovered aligned high spin superdeformed (SD) and/or hyperdeformed (HD) states mar96a ; mar96b ; mar01a ; mar01b , where the high spin, the barriers between the various minima of the potential energy surfaces and the unusual radioactive decay properties contribute to their long lifetimes.
High spin states in general and such states in SD and HD minima in particular are preferentially produced by heavy ion reactions mar01b ; mar03a . The observation of these isomeric states suggests that heavy ion reactions could be involved in their nucleosynthesis production process(es).
In summary, evidence for the existence of long-lived superheavy isotopes with t1/21x108 y and atomic numbers of 261 and 265 has been found in natural Au. It is argued that they are isomeric states, most probably in 261Rg and 265Rg. The possibility that they are high spin SD and HD isomeric states is discussed.
We appreciate valuable discussions and the help of N. Zeldes, E. Grushka, and O. Marinov.
References
- (1) A. Marinov, I. Rodushkin, Y. Kashiv, L. Halicz, I. Segal, A. Pape, R.V. Gentry, H.W. Miller, D. Kolb, and R. Brandt, arXiv:nucl-ex/0605008; preprint.
- (2) G. Audi, A.H. Wapstra, and C. Thibault, Nucl. Phys. A729, 337 (2003).
- (3) P. Möller, J.R. Nix, W.D. Myers, and W.J. Swiatecki, At. Data Nucl. Data Tables 59, 185 (1995).
- (4) H. Koura, T. Tachibana, M. Uno, and M. Yamada, Prog. Theor. Phys. 113, 305 (2005); KTUY05_246512np.pdf.
- (5) S. Liran, A. Marinov, and N. Zeldes, Phys. Rev. C 62, 047301 (2000); arXiv:nucl-th/0102055.
- (6) I. Rodushkin, E. Engström, A. Stenberg, and D.C. Baxter, Anal. Bioanal. Chem. 380, 247 (2004).
- (7) I. Rodushkin, P. Nordlund, E. Engström, and D.C. Baxter, J. Anal. At. Spectrom. 20, 1250 (2005).
- (8) P. Möller, J.R. Nix, and K.-L. Kratz, At. Data Nucl. Data Tables 66, 131 (1997).
- (9) S.G. Nilsson et al., Nucl. Phys. A131, 1 (1969).
- (10) U. Mosel and W. Greiner, Z. Phys. 222, 261 (1969).
- (11) A. Marinov, S. Gelberg, and D. Kolb, Mod. Phys. Lett. A11, 861 (1996).
- (12) A. Marinov, S. Gelberg, and D. Kolb, Mod. Phys. Lett. A11, 949 (1996).
- (13) A. Marinov, S. Gelberg, and D. Kolb, Int. J. Mod. Phys. E10, 185 (2001).
- (14) A. Marinov, S. Gelberg, D. Kolb, and J. L. Weil, Int. J. Mod. Phys. E10, 209 (2001).
- (15) A. Marinov, S. Gelberg, D. Kolb, R. Brandt, and A. Pape, Phys. At. Nucl. 66, 1137 (2003).