Also at: ]A.W. Wright Nuclear Structure Laboratory, P.O. Box 208124, Yale University, 272 Whitney Avenue, New Haven, CT 06520-8124
A Further Measurement of the -Delayed -Particle Emission of
Abstract
We measured the -delayed -particle emission spectrum of with a sensitivity for -decay branching ratios of the order of . The nuclei were produced using the reaction with 70 MeV beams and a deuterium gas target 7.5 cm long at a pressure of 1250 torr. The nuclei were collected (over 10 s) using a thin aluminum foil with an areal density of 180 tilted at with respect to the beam. The activity was transferred to the counting area by means of a stepping motor in less than with the counting carried out over . The -delayed -particles were measured using a time of flight method to achieve a sufficiently low background. Standard calibration sources () as well as alpha-particles and from the reaction were used for an accurate energy calibration. The energy resolution of the catcher foil (180-220 keV) was calculated and the time of flight resolution (3-10 nsec) was measured using the -delayed -particle emission from that was produced using the reaction with the same setup. The line shape was corrected to account for the variation in the energy and time resolution and a high statistics spectrum of the -delayed -particle emission of is reported. However, our data (as well as earlier Mainz data and unpublished Seattle data) do not agree with an earlier measurement of the -delayed -particle emission of taken at TRIUMF after averaging over the energy resolution of our collection system. This disagreement, amongst other issues, prohibits accurate inclusion of the f-wave component in the R-matrix analysis.
pacs:
26.20.+f 97.10.Cv 98.80.Ft 23.60.+e 23.40.-sI Introduction
The reaction is of critical importance for understanding stellar evolution Fo84 . It competes with the reaction (that forms carbon) to yield oxygen during stellar helium burning, together determining the carbon/oxygen (C/O) ratio at the end of helium burning. The C/O ratio is of major importance for understanding type II We93 and apparently also the light curve of type Ia Ho02 supernovae. Since the reaction is comparatively well known (), the reaction provides the principle uncertainty in the C/O ratio at the end of helium burning.
The -delayed -particle emission of (i.e. -particles emitted from the continuum of populated by the -decay of ) has been predicted to provide a constraint on the cross section of this reaction Ba69 ; Ba71 ; Ji90 ; Hu91 , but it requires a measurement of a -decay of with a sensitivity for a Branching Ratio (BR) of the order of . In particular, the low energy portion of the alpha-particle spectrum has been predicted to be sensitive to the reduced -particle width of the bound state in ; however, it cannot directly determine the mixing phase in the reaction of the two interfering states at and in .
In the early 1970s F.C. Barker Ba69 ; Ba71 proposed the use of the -delayed -particle emission spectrum of to constrain , the p-wave component of the astrophysical cross section factor. At the time of these calculations Ba69 ; Ba71 , a single -delayed -particle emission spectrum with very high statistics ( million counts) existed. These data were measured at Mainz Wa69 ; Wa70 ; Ne74 in a successful measurement of the parity violating -particle decay. However, these data were only listed in numerical form in private communications Barker . Unfortunately, this spectrum excluded the energy region of the interference peak predicted at .
In the early 1990s three additional measurements of this spectrum were made: at TRIUMF Az94 , at Yale Zh93 ; Zh93a , and at the University of Washington at Seattle (unpublished) Zh95 . The experiment reported here Fr96 ; France is a continuation and improvement of the original Yale-UConn experiment Zh93 ; Zh93a . We refer the reader to the appendix of Ref. France where all available data from each of these experiments, including the unpublished Seattle experiment Zh95 and the old Mainz experiment Wa69 ; Wa70 ; Ne74 , are listed in tabular form.
Recently a renewed interest in the spectrum of the -delayed -particle emission of has been generated by a new experiment carried out at the Argonne National Lab Argonne . The primary purpose of this paper is to publish a detailed account of the data from our improved experiment that were already shown in the literature Fr96 . In addition we include in the appendix of this paper the same numerical listing as included (by permission) in Ref. France of the Seattle data Zh95 as well as the Mainz data Wa69 ; Wa70 ; Ne74 . The Seattle and Mainz data have been repeatedly discussed by a number of authors that quoted Reference France as the source for these data, and we consider it advantageous to list it here in numerical form. We compare these data sets and demonstrate that our data agrees with the Mainz and Seattle data but not with the TRIUMF data. We also note that the preliminary reported data of the Argonne group Argonne agree with our data. We discuss the relevance of this disagreement for the global R-matrix fit of the data.
II Experimental Procedures
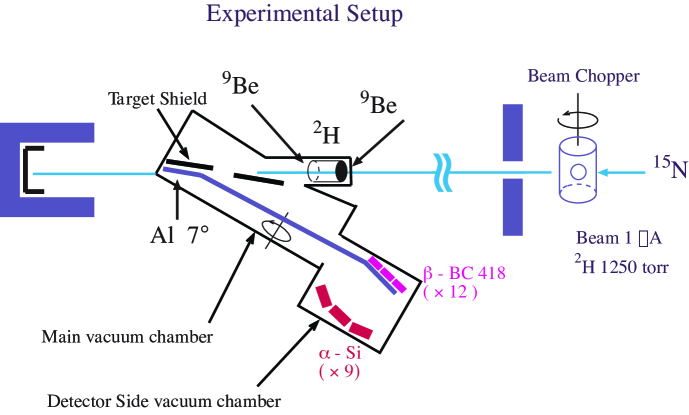
The experiments were performed using beams from the Yale ESTU tandem van de Graff accelerator and a deuterium gas target to produce using the reaction. The produced nuclei emerged from the gas target and were stopped in aluminum catcher foils, as shown in Fig. 1. These foils were then rotated into a counting area to measure the decays of . The use of reversed kinematics allowed for the to be kinematically focussed into a forward cone of about . The nuclei were implanted into thin aluminum catcher foils located at the ends of an approximately long arm which rotated about its center. After each production cycle, the arm rotated , placing the implanted catcher foil between two detector arrays which measured the beta and alpha-particles in coincidence.
We used a deuterium gas target, composed of a copper cylinder long and in diameter with thick walls cooled with an alcohol cooling system to . Thin beryllium pressure foils were attached with Araldite epoxy from CIBA-GEIGI (good for very low temperatures) to the ends of the cylinder. To reduce plural scattering, beryllium was chosen for the pressure windows as it has a low . The target was filled with approximately of deuterium gas and was placed close to the catcher foils with its exit window only from the edge of the catcher foil.
The emerged from the target with a broad distribution of energies (of order ) of which the catcher foils collected the lowest portion. To allow the capture of these ions while retaining useful -particle energy resolution, the catcher foils were made of thin aluminum tilted at with respect to the beam, see Fig. 1, to increase their effective catching thickness by a factor of 8.
The foils were attached to aluminum frames with epoxy and had open areas of . Inside the chamber, see Fig. 1, a tantalum shield was positioned less than 1 mm from the catcher foil to prevent from hitting the catcher frames. Very precise alignment of the shields and catcher foils was necessary to ensure that the was stopped in the catcher foils and not elsewhere, where it would produce a low energy tail in the alpha-particle spectrum. The alignment was tested using empty catcher foil frames. The beam was confined to travel through the system using two sets of beam defining slits: one slit located several meters upstream and the second one about a meter upstream. The beam position was also constrained by two additional tantalum collimators, the target itself, and the shield, discussed above.
During the collection period the neutron background was very large hence the data acquisition system was turned off during irradiation. The experiments were run in 21 second cycles, to maximize detection efficiency given the 10 second lifetime of . The first 10 seconds of each cycle was the production period during which the was produced in the target and collected in the catcher foils. At the end of this time, a tantalum beam chopper blocked the beam far upstream followed by the arm carrying the catcher foil rotating in slightly less than . Three seconds after the rotation began, the data acquisition system was activated for . In order to protect the catcher foil frames from the beam, the position of the beam chopper was read back into the control room, and the arm rotation did not begin until the beam chopper was fully in place. Since catcher foils were located at both ends of the arm, it was not necessary to rotate the arm at the end of the cycle and a second (10 s) collection period commenced.
The principle detectors in this experiment were nine Silicon Surface Barrier (SSB) detectors located in a square array and used to detect -particles. Each detector had an active area of and a thick active region to minimize deposition of energy from -particles. Canberra 2003B preamps, which had been modified to match the high capacitance of the detectors, were used. The measured energy resolution of the detectors was about , and the array was located from the catcher foil.
The secondary detector array (the -array) was composed of twelve plastic scintillation detectors made of BC418 fast plastic scintillator and Hamamatsu H3165 and H3171 photomultipliers and was used to detect -particles. The central six detectors were , while the outer six detectors were . The detectors were optically isolated from one another using aluminum foil and were covered by a aluminized mylar film to prevent the detection of -particles or recoils. The -array subtended approximately 30% of 4, as shown in Fig. 1.
The data were collected event by event and written to Exabyte tapes by a Concurrent 3230 computer running the Oak Ridge data acquistion system France . Each event was started by one of the -detectors firing. For each -detector which fired, a delayed relative timing signal was recorded using a Lecroy 2228A time to digital converter. Thus for each event one -particle energy and 12 - relative time measurements were recorded.
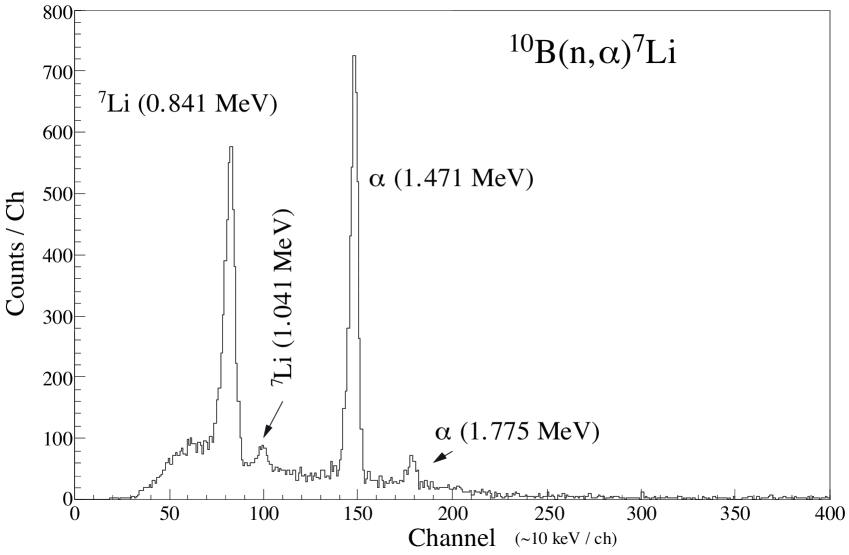
The energy calibration of the -detectors was performed using -particles from five different standard calibration sources: and -particles as well as emitted in the reaction, yielding eleven -particle energies from 1.471 MeV to 7.386 MeV. Energy loss in these calibration sources and the source were negligible and did not affect the energy calibration. A typical calibration spectrum is shown in Fig. 2. In addition the detectors were implanted with small amounts of Polonium and Actinium leading to a continuous online energy calibration throughout the experiment. These online calibration lines did not perturb the time of flight coincidence spectra.
III Data Analysis
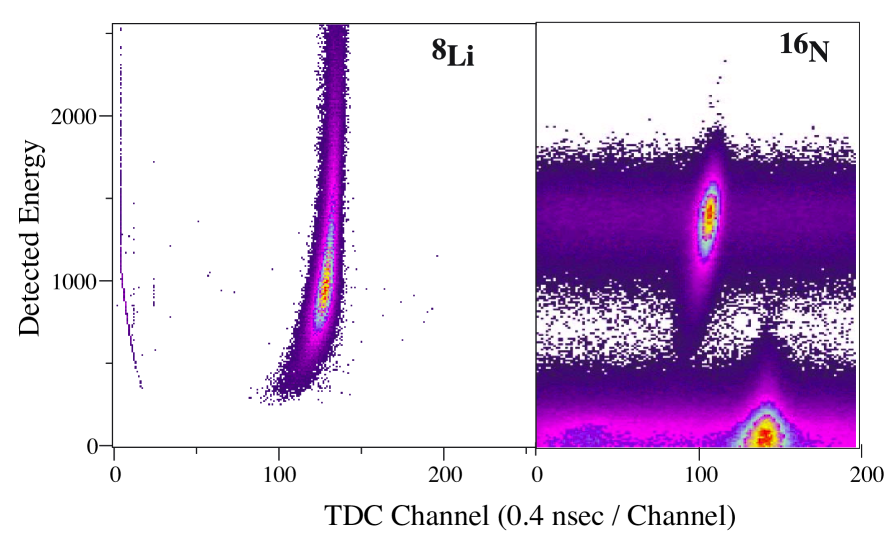
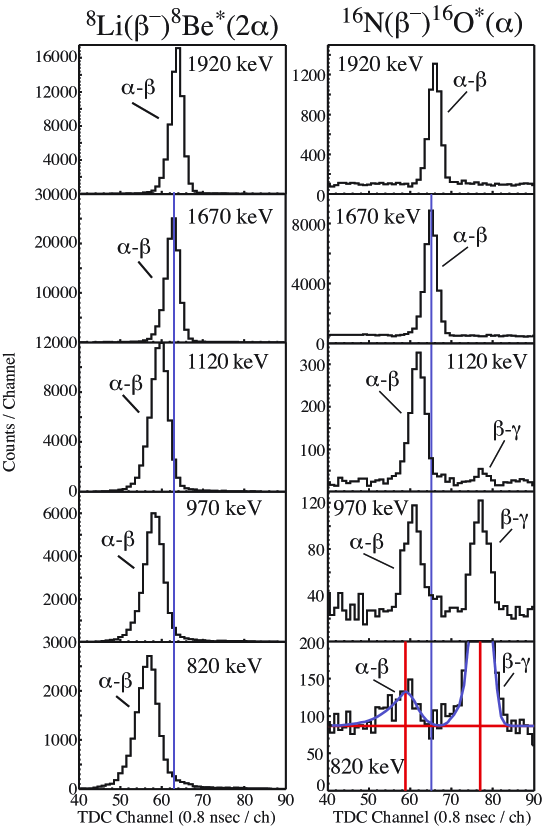
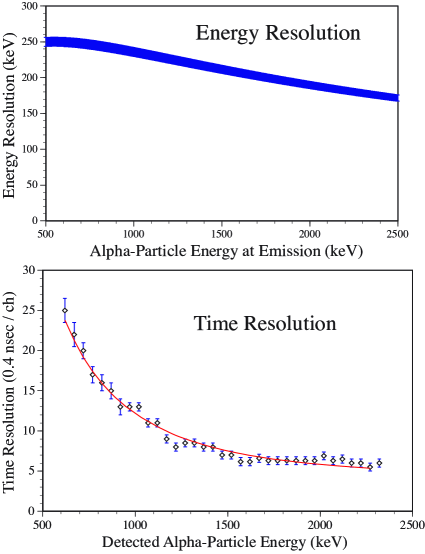
The detector timing was calibrated using beams and the reaction. The undergoes -delayed -particle emission with a lifetime just under . The measured spectra were plotted in 108 (one for each - detector pair) two-dimensional histograms with time along the -axis and detected -particle energy along the -axis, as shown in Fig. 3. Each histogram was initially cut into sixteen wide slices which were projected onto the time axis, similar to the (50 keV) slices shown in Fig. 4; the resulting 1728 spectra were each fit using the Oak Ridge data analysis program SAMGR with skewed gaussians to determine the time of flight (TOF) peak positions and shapes, see Fig. 4. For each detector pair, these TOF centroids were fit as a function of energy; where d is the distance from the -particle source to the detector, as shown in Fig. 5. The fitted values of d were consistant with the distances measured directly (about ). The obtained time of flight parameters were used for matching the spectra. The time of flight resolution was determined from these spectra and the energy resolution was determined by using Ziegler s formulae Zi92 with the known effective thickness measured in situ using a source. The time and energy resolutions are shown in Fig. 5.
A -delayed -particle emission spectrum of was obtained with approximately 1.3 million -particles in singles using the following procedure. After matching the spectra using the results of the calibration as discussed above, the spectra were combined into one two dimensional histogram, as shown in Fig 3. This summed two dimensional spectrum was then cut into wide slices which were individually analysed using the Oak Ridge software, see Fig. 4, and corrected for the measured -particle efficiency of the -array. One of the -detectors failed during the experiment and was not used in the analysis. For purely geometric reasons approximately one third of the remaining detector pairings were not used in our analysis, as their timing resolutions were insufficient to separate out the background (discussed below).
The effective energy of the emerging -particles for each data point was calculated using the expected variation of the yield over the energy width of the catcher foil for each slice. The effective center of mass energy was calculated and is listed as in Table 1. Note that due to fast variation in the yield, the effective -particle energy is not the one due to -particles emitted from the center of the catcher foil.
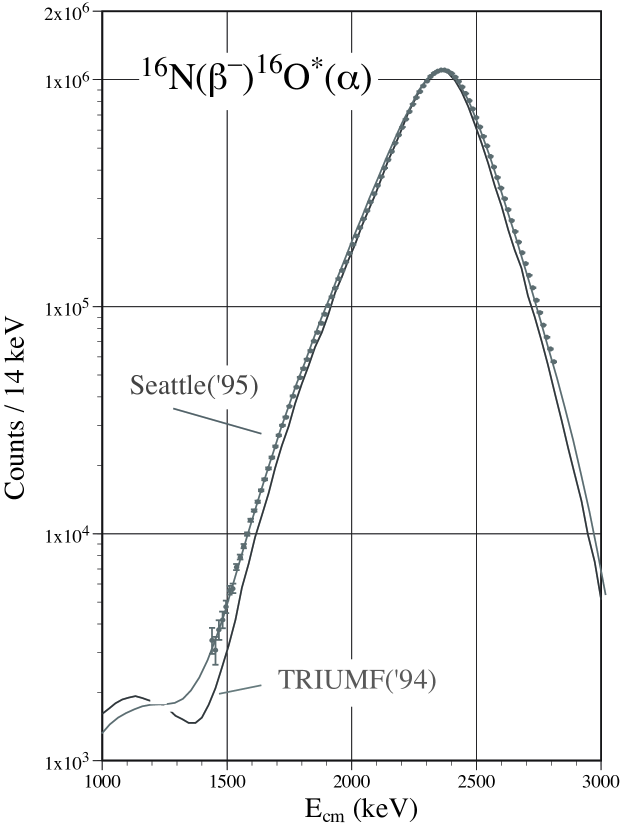
The measured spectral line shape was corrected for distortions caused by the variability of our time and energy resolutions, see Fig. 5. For a spectrum constant in energy, the yield measured at each point in that spectrum is directly proportional to the energy integration interval. This conclusion holds for a spectrum in any physical variable. In the case of this experiment, the data are integrated over both time and energy with the integration intervals being the time and energy resolutions. The fact that these vary considerably over the energy range of the detected -particles causes a significant distortion in the line shape. The data were normalized by dividing by the effective integration intervals, i.e. the time and energy resolutions as shown in Fig. 5, to correct this distortion. The energy resolution of the experiment (the thickness of the aluminum catcher foils) is considerably larger than the intrinsic resolution of the SSB detectors. These resolutions are based on the measured time resolutions from the 8Li data and the measured thickness of the catcher foils France determined by using Ziegler s formulae Zi92 upon the known effective thickness measured in situ using a source. The final spectrum, with these resolutions divided out, is shown in Fig. 6 and listed in tabular form in Table 1.
There are two principle sources of background in this experiment. The first is - coincidences; these occur when a -particle is detected in an -detector in coincidence with a -ray detected in a -detector. Most of these - coincidences arise from activated created by neutron capture on the aluminum capture foils. The second source of background is due to partial charge collection in the SSB. In both cases the background coincidence is well separated from the data due to the fast timing requirements, as shown in Fig 4.
Table 1: The currently measured Yale(96) data.
| cts./ch | cts./ch | cts./ch | cts./ch | ||||
| 975 | 46.1(175) | 1563 | 517.0(313) | 2149 | 19856.7(14335) | 2739 | 5241.7(4095) |
| 1040 | 67.5(104) | 1628 | 799.5(461) | 2215 | 26832.3(19323) | 2804 | 3082.4(2593) |
| 1105 | 72.5(114) | 1693 | 1227.0(683) | 2280 | 33244.0(23917) | 2869 | 1700.9(1584) |
| 1171 | 63.6(95) | 1758 | 1961.1(1500) | 2345 | 36684.7(26388) | 2936 | 958.3(1238) |
| 1236 | 85.1(95) | 1823 | 2907.9(2183) | 2412 | 35711.0(25700) | 3001 | 479.1(1684) |
| 1301 | 75.3(84) | 1889 | 4382.8(3244) | 2477 | 29550.8(21319) | 3067 | 238.0(939) |
| 1367 | 135.2(109) | 1853 | 6725.9(4928) | 2542 | 21181.2(15364) | 3132 | 123.5(906) |
| 1432 | 207.1(147) | 2019 | 9778.2(7116) | 2608 | 13623.0(9989) | ||
| 1497 | 315.3(206) | 2084 | 14568.2(10545) | 2673 | 8626.0(6462) |
IV Discussion
In addition to our experiment there were three high-statistics data sets for the -delayed -particle emission of 16N. The first (containing approximately 32 million events) was taken in Mainz, Germany by K. Neubeck et al. Ne74 , in a successful measurement of the -particles from the parity violating -particle decay of the state in . The second (containing approximately 1.25 million events) was taken in the TRIUMF lab in Canada Az94 . The third (containing approximately 0.1 million events) was taken at the University of Washington in Seattle, Washington by Z. Zhao et al. Zh95 .
Due to the thickness of our catcher foils, the inherent energy resolution of our experiment is significantly poorer than that of the previous experiments. Thus, in order to do a proper comparison, the previous data sets must be averaged over our variable energy resolution. To do this, the published R-Matrix fitted curves from the Seattle and TRIUMF data sets were used to minimize end-effects in the averaging process. The use of the R-matrix fit curve is appropriate as the fitted curves reproduce the data quite well Zh95 ; Az94 and it allows us to extend beyond the region of measured data for a meaningful averaging.
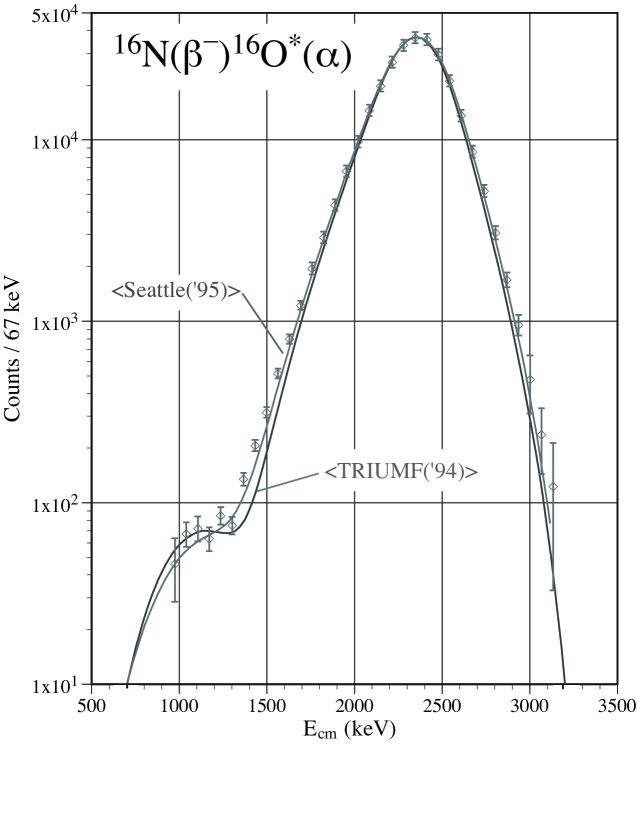
In Fig 6 we show a comparison of our data with the averaged fitted curves of Seattle and TRIUMF. Our data agree fairly well with the Seattle averaged fit curve with a per data point of 1.4, while disagreeing with the TRIUMF averaged fit curve with a per data point of 7.2. In Fig. 7 we show a comparison of the Mainz data with the Seattle and TRIUMF fit curves. These three data sets were measured with comparable energy resolution and in this comparison there is no need to employ energy averaging. The Mainz data also agrees with the Seattle fit curve with a per data point of 2.5, while badly disagreeing with the TRIUMF fit curve with a per data point of 123.
The disagreement with the TRIUMF data is manifestly due to a difference in the width of the primary peak, and not in the height of the secondary low energy peak. The agreement on the height of the low energy peak in and of itself demonstrates the viability of the time of flight method used in this experiment and negates a claim of a low energy tail in our data. The disagreement could quite possibly be due to over subtraction of contamination in the TRIUMF data.
In the case of -delayed -particle emission of the R-matrix fit includes an additional partial wave, the f-wave, that affects the results, while not playing any role in the astrophysical reaction. The f-wave component is determined primarily through the depth of the interference minimum around 1.4 MeV, which is also dependent upon the width of the primary peak. The disagreement in the region of the interference minimum around 1.4 MeV is sufficient to change the f-wave component and leads to imprecise determination of the p-wave contribution to the spectrum.
V Conclusion
We report on our improved measurement of the -delayed -particle emission of with results that are in agreement with the old Mainz data and the new unpublished Seattle data but in disagreement with the TRIUMF data. The disagreements are entirely caused by differences in the width of primary peak and the depth of the interference minimum. Without precise knowledge of this minimum, the f-wave component cannot be determined with high accuracy and the corresponding p-wave spectrum cannot be extracted with high precision.
References
- (1) W.A. Fowler; Rev. Mod. Phys., 58(1984)149.
- (2) T.A. Weaver and S.E. Woosley, Phys. Rep. 227(1993)65.
- (3) P. Höflich and J. Stein. ApJ., 568(2002)779.
- (4) F.C. Barker. Aust. J. Phys., 22(1969)293.
- (5) F.C. Barker. Aust. J. Phys., 24(1971)777.
- (6) X. Ji, B.W. Fillippone, J. Humblet, and S.E. Koonin. Phys. Rev. C44(1991)2530.
- (7) J. Humblet, B.W. Fillippone, and S.E. Koonin. Phys. Rev. C41(1990)1736.
- (8) H. Hättig, K. Hünchen, P. Roth and H. Wäffler. Nucl. Phys. A137(1969)144.
- (9) H. Hättig, K. Hünchen, and H. Wäffler. Phys. Rev. Lett. 25(1970)941.
- (10) K. Neubeck, H. Schober, and H. Wäffler; Phys. Rev.C10(1974)320.
- (11) F.C. Barker, Private Communication.
- (12) R.E. Azuma, et al., Phys. Rev. C50(1994)1194.
- (13) Z. Zhao, R.H. France III, K.S. Lai, S.L. Rugari, M. Gai, and E.L. Wilds, Phys. Rev. Lett. 70(1993)2066, ER 70(1993)3524.
- (14) Z. Zhao, Ph.D. thesis, Yale University, 1993, unpublished.
- (15) Z. Zhao, L. Debrackeler, and E.G. Adelberger; 1995, Private Communication. These data were used by specific permission to be included in France and they are listed in numerical form in France . The data listed in Table A.2 are identical to those listed in Ref. France which is available on the internet.
- (16) R.H. France III, E.L. Wilds, N.B. Jevtic, J.E. McDonald, and M. Gai. Nucl. Phys. A621(1997)165c.
- (17) R.H. France III, Ph.D. Thesis, 1997, Yale University, unpublished, http://bobgoyangi.gcsu.edu/France/Thesis/thesis.html.
- (18) X.D. Tang, M. Notani, K.E. Rehm, I. Ahmad, J. Greene, A.A. Hecht, D. Henderson, R.V.F. Janssens, C.L. Jiang, E.F. Moore, R.C. Pardo, G. Savard, J.P. Schiffer, S. Sinha, M. Paul, L. Jisonna, R.E. Segel, C. Brune, A. Champagne, A. Wuosmaa; Bull. Amer. Phys. Soc. 50,#6(2005)119.
- (19) J.F. Ziegler, Stopping Powers and Range in all elements, Pergamon Press, 1977.
VI Appendix
We include numerical values of other measured -delayed -particle emission data sets:
| cts./14 keV | cts./14 keV | cts./14 keV | cts./14 keV | ||||
| 1440 | 3405(450) | 1793 | 48833(221) | 2146 | 444856(667) | 2499 | 682050(826) |
| 1454 | 3077(433) | 1807 | 53503(231) | 2160 | 483692(695) | 2514 | 620224(788) |
| 1468 | 4188(346) | 1821 | 58701(242) | 2174 | 526321(725) | 2528 | 563602(751) |
| 1482 | 4188(346) | 1835 | 64079(253) | 2189 | 571892(756) | 2542 | 510728(715) |
| 1496 | 4772(303) | 1849 | 70676(266) | 2203 | 618339(786) | 2556 | 459941(678) |
| 1510 | 5642(256) | 1863 | 77366(278) | 2217 | 670463(819) | 2570 | 413566(643) |
| 1524 | 5747(266) | 1878 | 84753(291) | 2231 | 724409(851) | 2584 | 371361(609) |
| 1538 | 7140(213) | 1892 | 92990(305) | 2245 | 780412(883) | 2598 | 333038(577) |
| 1553 | 7894(207) | 1906 | 101301(318) | 2259 | 835509(914) | 2613 | 299558(547) |
| 1567 | 8809(187) | 1920 | 110729(333) | 2273 | 887989(942) | 2627 | 268149(518) |
| 1581 | 9956(177) | 1934 | 120862(348) | 2287 | 940716(970) | 2641 | 240195(490) |
| 1595 | 11465(166) | 1948 | 133076(365) | 2302 | 990074(995) | 2655 | 214700(463) |
| 1609 | 12659(163) | 1962 | 144569(380) | 2316 | 1035270(1017) | 2669 | 192662(439) |
| 1623 | 13843(165) | 1977 | 157468(397) | 2330 | 1067060(1033) | 2683 | 173030(416) |
| 1637 | 15536(164) | 1991 | 171864(415) | 2344 | 1093030(1045) | 2697 | 154921(394) |
| 1651 | 17367(166) | 2005 | 188071(434) | 2358 | 1102330(1050) | 2711 | 137601(371) |
| 1666 | 19393(167) | 2019 | 204918(452) | 2372 | 1103420(1050) | 2726 | 121153(348) |
| 1680 | 21678(172) | 2033 | 223316(473) | 2386 | 1090340(1044) | 2740 | 106848(327) |
| 1694 | 24254(177) | 2047 | 243641(494) | 2401 | 1065430(1032) | 2754 | 94373(307) |
| 1708 | 27143(184) | 2061 | 264433(514) | 2415 | 1027410(1014) | 2768 | 83053(288) |
| 1722 | 30005(185) | 2075 | 289202(538) | 2429 | 983372(992) | 2782 | 73408(271) |
| 1736 | 32645(195) | 2090 | 314792(561) | 2443 | 928649(964) | 2796 | 65206(255) |
| 1750 | 36425(191) | 2104 | 342694(585) | 2457 | 869743(933) | 2810 | 57211(239) |
| 1765 | 40454(201) | 2118 | 374401(612) | 2471 | 808732(899) | ||
| 1779 | 44290(210) | 2132 | 407842(639) | 2485 | 743730(862) |
| cts./27 keV | cts./27 keV | cts./27 keV | cts./27 keV | ||||
| 835 | 8(3) | 1454 | 25(5) | 2073 | 2141(46) | 2691 | 1142(34) |
| 868 | 13(4) | 1486 | 28(5) | 2105 | 2706(52) | 2724 | 821(29) |
| 900 | 16(4) | 1519 | 55(7) | 2138 | 3214(57) | 2757 | 643(25) |
| 933 | 10(3) | 1551 | 68(8) | 2170 | 3964(63) | 2789 | 466(22) |
| 965 | 12(3) | 1584 | 64(8) | 2203 | 4801(69) | 2822 | 395(20) |
| 998 | 11(3) | 1617 | 111(11) | 2235 | 5681(75) | 2854 | 256(16) |
| 1030 | 13(4) | 1649 | 120(11) | 2268 | 6533(81) | 2887 | 188(14) |
| 1063 | 12(3) | 1682 | 161(13) | 2301 | 7348(86) | 2919 | 118(11) |
| 1096 | 20(4) | 1714 | 232(15) | 2333 | 7870(89) | 2952 | 111(11) |
| 1128 | 10(3) | 1747 | 236(15) | 2366 | 8056(90) | 2985 | 72(8) |
| 1161 | 21(5) | 1779 | 352(19) | 2398 | 7777(88) | 3017 | 43(7) |
| 1193 | 7(3) | 1812 | 392(20) | 2431 | 7083(84) | 3050 | 34(6) |
| 1226 | 16(4) | 1845 | 546(23) | 2463 | 6000(78) | 3082 | 17(4) |
| 1258 | 13(4) | 1877 | 675(26) | 2496 | 4851(70) | 3115 | 10(3) |
| 1291 | 9(3) | 1910 | 862(29) | 2529 | 4038(64) | 3147 | 6(2) |
| 1323 | 15(4) | 1942 | 979(31) | 2561 | 3180(56) | 3180 | 1(1) |
| 1356 | 14(4) | 1975 | 1241(35) | 2594 | 2430(49) | 3212 | 0(1) |
| 1389 | 17(4) | 2007 | 1468(38) | 2627 | 1894(44) | 3245 | 1(1) |
| 1421 | 16(4) | 2040 | 1753(42) | 2659 | 1503(39) |