The first measurement of meson semi-leptonic decay contribution to non-photonic electrons at RHIC
Abstract
We present the first measurement for the meson semi-leptonic decay contribution to non-photonic electrons at RHIC using non-photonic electron azimuthal correlations with charged hadrons in p+p collisions at GeV from STAR.
1 Introduction
Recent experimental data [1, 2] from RHIC show that the suppression of electrons from heavy quark (charm and bottom) decays is comparable to that of light hadrons in central Au+Au collisions. This implies that heavy quarks may lose a substantial amount of energy, in contradiction with current theoretical predictions based on energy loss via induced gluon radiation for heavy quarks [3, 4]. Recent calculations including both gluon radiation and collisional energy loss change the heavy quark energy loss [5, 6]. However, the detailed comparison with experimental non-photonic electron energy loss depends on the relative contributions from charm and bottom quarks. We have developed an innovative method which uses the azimuthal correlations between non-photonic electrons and charged hadrons to estimate the relative and contributions to non-photonic electrons [7]. Our method depends on the fact that for the same electron transverse momentum the near-side e-h angular correlation from decays is much wider than that from D decays. In this paper we will present the preliminary results on the measurement of azimuthal correlations between high- non-photonic electrons and charged hadrons in p+p collisions at 200 GeV from STAR. We will use comparisons of the experimental results with PYTHIA simulations to estimate and decay contributions to non-photonic electrons as a function of for GeV/c.
2 Data analysis and results
The data used in this analysis is p+p events at GeV recorded by STAR in RUN V. The main detectors utilized in this analysis are the STAR Time Projection Chamber (TPC) [8] and the STAR Barrel Electromagnetic Calorimeter (BEMC) with the Shower Maximum Detector (SMD) [9]. To obtain sufficient statistics at high-, we used high tower triggers corresponding to an energy deposition of at least 2.6 GeV (HT1) and 3.5 GeV (HT2) in a single tower of the BEMC. Around 2.4 million HT1 events and 1.7 million HT2 events were used for the results presented in this paper.
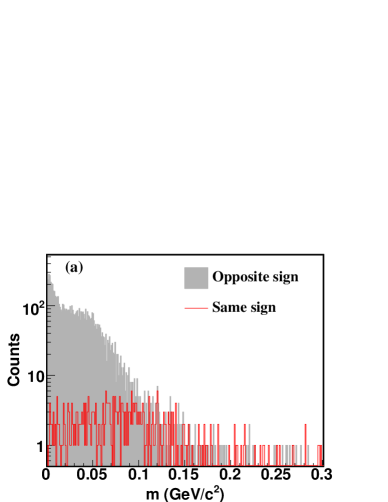
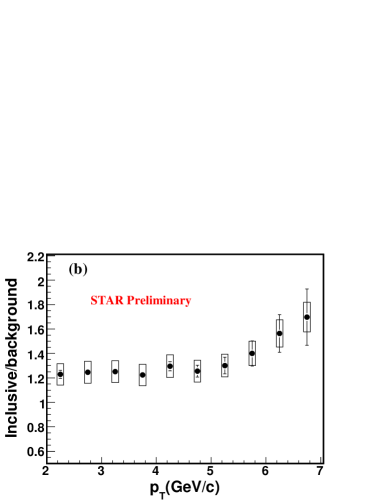
Electron identification was carried out by combining ionization energy loss in the TPC with energy deposition in the EMC and shower profile in the SMD. Detailed descriptions of the electron reconstruction techniques can be found in Ref. [1, 10]. The dominant photonic electron background is from photon conversions and , Dalitz decays, whose electron pairs have small invariant masses. We combine the electron candidates with tracks passing a very loose cut on around the electron band. The invariant mass distribution of pairs () is depicted by the grey filled area in panel (a) of Fig. 1. The contains the true photonic background as well as the combinatorial background, where non-photonic electrons may be falsely identified as photonic electrons. The combinatorial background, which is small in p+p collisions, can be estimated by calculating the invariant mass of same-sign electron pairs () shown as red solid line in panel (a) of Fig. 1. A cut of mass GeV rejects about of photonic background. Panel (b) of Fig. 1 shows the ratio of inclusive electron to photonic background as a function of . The bars (boxes) on the data indicate the size of statistical (systematic) errors. A significant excess of electrons with respect to the background can be observed, where the excess electrons are mostly from heavy quark semi-leptonic decays. STAR has larger amount of material in RUN V than RUN III (IV), leading to inclusive electron to photonic background ratios from RUN V systematically lower than those from RUN III (IV) [1].
In order to extract the angular correlation between non-photonic electrons and charged hadrons, we start with the semi-inclusive electron sample. We remove the sample after the mass cut from the inclusive electron sample. The remaining electrons form the ”semi-inclusive” electron sample. The relationship of these samples is: semi-inc inc - OppSign with the mass cut inc (reco-pho combinatorics) inc (pho not-reco-pho combinatorics) non-pho not-reco-pho combinatorics. Therefore the signal can be obtained by the equation: . can be calculated using by an efficiency correction after removing the photonic partner of the reconstructed-photonic electron. The reason to remove the photonic partner is that for the reconstructed-photonic electron the photonic partner is found while for not-reconstructed-photonic electron the partner is missing. The resulting e-h correlations for reconstructed photonic electrons and not reconstructed photonic electrons cannot be related to each other by an efficiency correction factor alone. Therefore can be obtained by the equation: , where is the photonic electron reconstruction efficiency and reco-pho-no-partner means reconstructed photonic electrons after removing the photonic partner. The corresponding efficiency can be calculated from simulations and is .
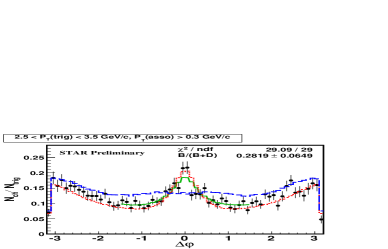
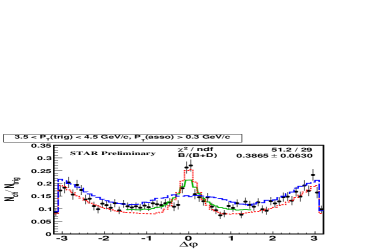
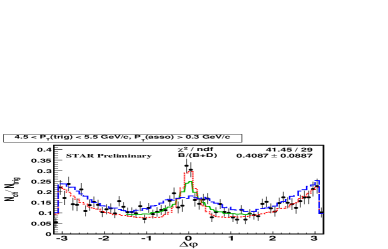
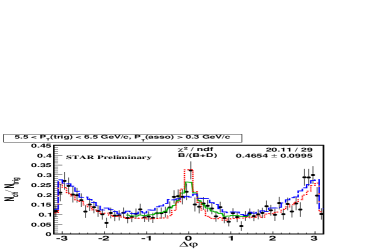
Fig. 2 shows the distributions and the comparison to PYTHIA simulations for four electron trigger cuts with associated hadron 0.3 GeV/c. The data are shown as dots, the blue dashed curves and the red dotted curves are from PYTHIA simulations for decays and for decays, respectively. The setup of PYTHIA parameters is discussed in Ref. [7]. We use PYTHIA curves to fit the data points with the contribution as a parameter in the fit function: , where is the contribution, . The fits are shown as green solid curves in Fig. 2. The fit results are consistent within statistical errors when we vary the fit range in from to . As a systematic check, we allowed an overall normalization factor in the fit function to float. It gives a normalization factor close to unity, and consistent ratios.
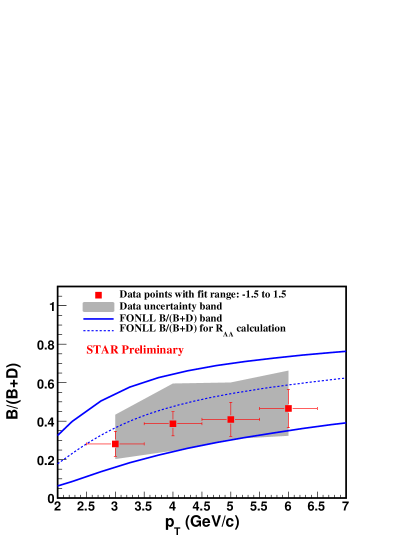
The semi-leptonic decay contribution to non-photonic electrons as a function of is shown in Fig. 3. The bars show the size of statistical errors. The grey band indicates the data uncertainties including statistical errors, and systematic uncertainties introduced by photonic electron reconstruction efficiency (dominant), different fit ranges and different fit functions. The blue solid curves show the range of relative bottom contribution from recent pQCD calculations (FONLL) [11]. The dashed line is the ratio used for default non-photonic electron calculation in FONLL. The preliminary STAR data are consistent with the FONLL calculation.
3 Conclusions
In conclusion, the first measurement of contribution to non-photonic electrons has been presented, using the azimuthal correlations between non-photonic electrons and charged hadrons in p+p collisions at GeV from STAR. Within the present statistical and systematic errors, the preliminary data analysis based on PYTHIA model indicates at GeV/c the measured contribution to non-photonic electrons is comparable to contribution and that the measured ratios are consistent with the FONLL theoretical calculation. Together with the observed suppression of non-photonic electrons in central Au+Au collisions, the measured ratios imply that bottom may be suppressed in central Au+Au collisions at RHIC.
This work is partly supported by NSFC under the grant number 10575042, 10610285.
References
References
- [1] Abelev B I et al (STAR Collaboration) 2006 preprint nucl-ex/0607012.
- [2] Adler S S et al (PHENIX Collaboration) 2006 Phys. Rev. Lett. 96 032301.
- [3] Armesto N et al 2005 Phys. Rev. D 71 054027.
- [4] Djordjevic M et al 2006 Phys. Lett. B 632 81.
- [5] Mustafa M G 2005 Phys. Rev. C 72 014905.
- [6] Adil A et al preprint nucl-th/0606010.
- [7] Lin X Y 2006 preprint hep-ph/0602067.
- [8] Anderson M et al 2003 Nucl. Instr. Meth. A 499 659.
- [9] Beddo M et al 2003 Nucl. Instr. Meth. A 499 725.
- [10] Dong W J 2006 Ph.D. thesis, UCLA.
- [11] Cacciari M et al 2005 Phys. Rev. Lett. 95 122001; FONLL calculations with CTEQ6M, GeV/, GeV/, and .