Elliptic flow fluctuations in GeV Au+Au collisions at RHIC
Abstract
We present first results on event-by-event elliptic flow fluctuations in Au+Au collisions at GeV obtained with the PHOBOS detector. Over the measured range in centrality, large relative fluctuations of –% are found. The elliptic flow fluctuations are well described as being proportional to fluctuations in the shape of the initial collision region, as estimated event-by-event with the participant eccentricity using Glauber Monte Carlo.
pacs:
25.75.-q1 Introduction
Elliptic flow () is one of the key observables in the understanding of the dynamics of heavy ion collisions. In the collision of two nuclei with finite impact parameter, the overlap region in the plane transverse to the beam direction is spatially asymmetric. Observation of an azimuthal anisotropy in the momentum distributions of the detected particles relative to the reaction plane is direct evidence of interactions between the initially produced particles [1]. These interactions must occur at relatively early times, since the expansion of the source —even if uniform— would wash out the effect of the initial asymmetry. Quantitatively, the connection between the initial and final-state anisotropy is exploited by hydrodynamical models that relate a given initial source shape to the distribution of produced particles. In such calculations, one typically uses smooth, event-averaged, initial conditions. However, event-by-event fluctuations in the shape of the initial interaction region must not be neglected. As a means to quantify the effect of initial-state eccentricity fluctuations, we have introduced the “participant eccentricity”, . It unifies the eccentricity-scaled elliptic flow across Cu+Cu and Au+Au collisions [2, 3]. It accounts for nucleon-position fluctuations in the participating nucleon distributions by calculating the eccentricity, event-by-event, with respect to the principal axes of the overlap ellipse in a Monte Carlo Glauber (MCG) simulation. In a hydrodynamical scenario, such fluctuations in the shape of the initial collision region would lead naturally to corresponding fluctuations in the elliptic flow signal. Note that the measurement of fluctuations as a probe of early stage dynamics of heavy ion collisions has been suggested earlier [4], although without considering the possibility of initial-state eccentricity fluctuations. In order to experimentally determine elliptic flow fluctuations, we have developed an analysis technique for the extraction of dynamical flow fluctuations [5]. Our method, summarized below, relies crucially on the large pseudo-rapidity coverage of the PHOBOS multiplicity array, which detects a very large fraction of the produced particles [6]. The results as a function of centrality in GeV Au+Au collisions at mid-rapidity are for the first time presented in these conference proceedings.
2 Elliptic flow fluctuations analysis technique and results
In order to disentangle known (mostly statistical) from unknown (dynamical) contri-butions to the measured flow fluctuations, a detailed knowledge of the detector response is required. The response function, , is defined as the distribution of the event-by-event observed elliptic flow, , for events with constant input flow value, , and multiplicity, . It is designed to account for detector deficiencies, as well as for multiplicity and finite-number fluctuations. Let be the true distribution for a set of events in a given centrality class, and the corresponding distribution of the observed , . The true and observed distributions are related by
| (1) |
where is the multiplicity distribution of the events in the given set of events. Our analysis method consists of three steps:
i) Measurement of the distribution, : The event-by-event measurement utilizes a two-parameter maximum likelihood fit to the obtained hit information in an event. The probability distribution function (PDF) of a particle to be emitted in the direction () for an event with mid-rapidity flow amplitude and reaction plane angle is defined as . The pseudorapidity dependence, , is parametrized with a triangular shape, , or alternatively with a trapezoidal shape, . Both parametrizations yield good descriptions of the previously measured (mean) shapes [7]. The normalization () is constructed such that the PDF folded with the PHOBOS acceptance () yields the same value for different sets of parameters (), , in practice constructed in small bins of . The desired value is given by the pair () that is “most likely” for the given event, found by maximizing as a function of and for all hits in the event.
ii) Construction of the kernel, : The response function is determined by running the event-by-event analysis, as described above, on modified HIJING events with known values of and . Flow of constant magnitude () with a flat reaction plane distribution () is introduced into the generated HIJING events. This is achieved by redistributing the resulting particles in each event in according to , using their generated positions. The modified HIJING events are fed through GEANT to obtain the PHOBOS detector response. For each parametrization of , triangular and trapezoidal, used in the event-by-event measurement, a corresponding kernel, and , is constructed. To obtain the kernel in bins of and with enough precision would require on the order of 100 million MC events. Instead the kernel can be parametrized, allowing us to use about 1.5% of that statistics to reach the required precision. The response of a perfect detector can be determined as a function of event multiplicity as described in LABEL:Ollitrault1992 (see Eq. (A13) with , and ). In practice, however, it turns out that is suppressed, with the suppression dependent on , and that the resolution () has a constant background contribution. With and , this leads to
| (2) |
where is a modified Bessel function of the first kind. The four unknown parameters () are obtained using the modified HIJING samples.
iii) Determination of the mean and variance of the true distribution, : To extract the fluctuations, we assume a Gaussian distribution for , with two parameters, and . For given values of and , it is possible to take the integral in Equation (1) to obtain the expected distribution, . By comparing the expected and observed distributions, the values for and are found by a maximum likelihood fit.
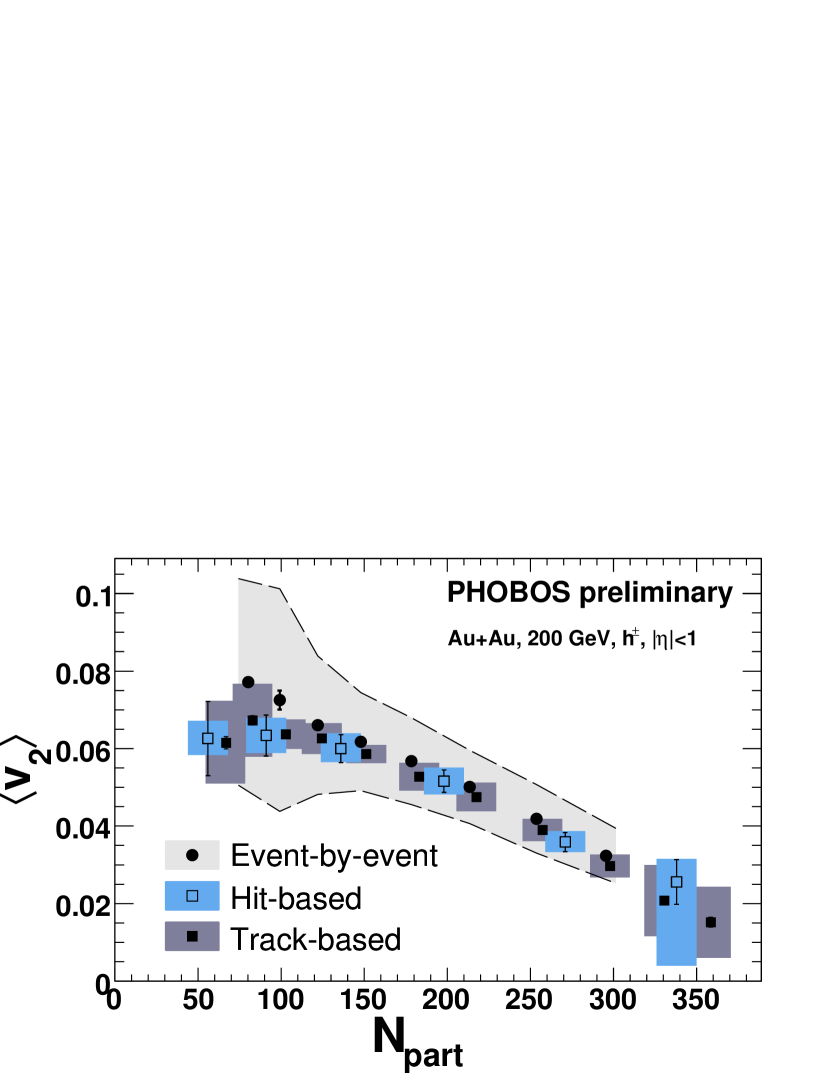
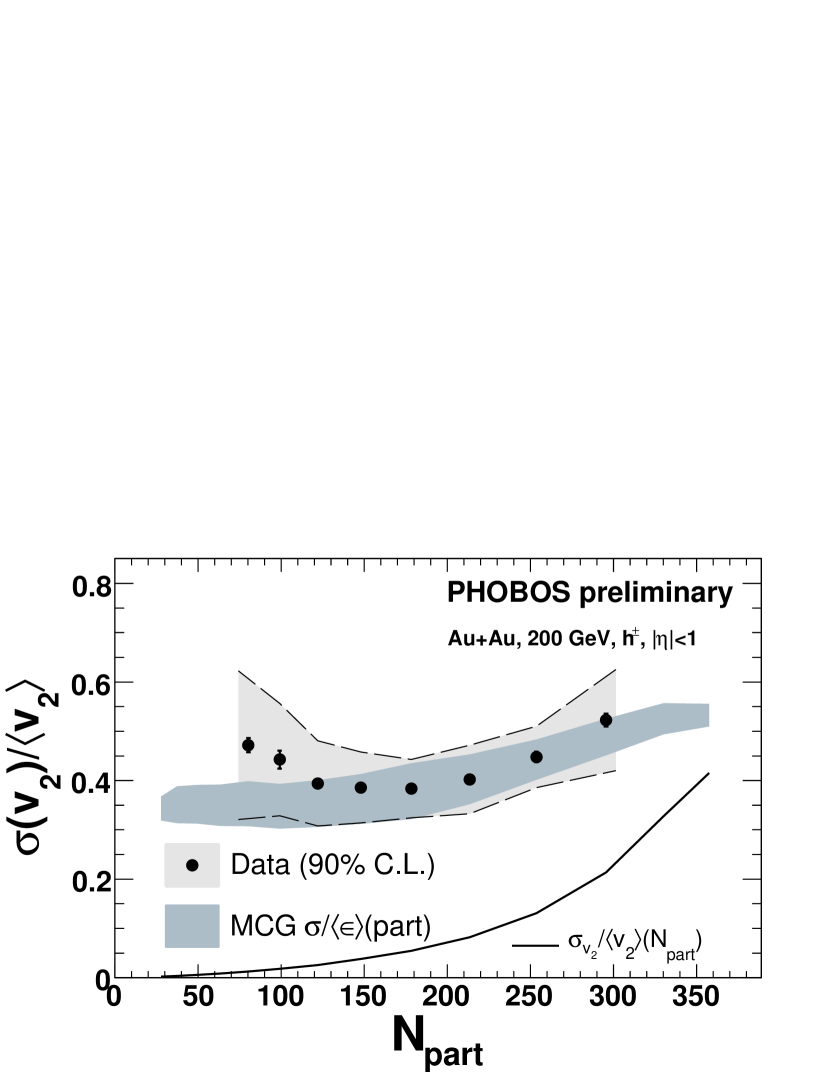
The analysis chain is applied to the GeV Au+Au data set from Run 4 in bins of centrality. The results ( and ) are obtained separately for triangular and trapezoidal shape and averaged over bins of collision vertex position. The systematic errors (all sources added in quadrature) are estimated by including variations from different vertex and bins and changes introduced by the triangular and trapezoidal shapes. Since the functional form of the true distribution is unknown, differences arising from a flat rather than a Gaussian ansatz for are included. Furthermore, we have performed extensive studies of the analysis response to MC samples, prepared to match the observed multiplicity distribution and , in bins of centrality and known input values of fluctuations (including zero). The discrepancies of the obtained to the input fluctuations evaluated per centrality bin are an additional source of the systematic error. Their contribution becomes increasingly important for low values of , and therefore the most central collision bin (–%) was excluded from the analysis. Fig. 2 shows the mean flow results obtained with the event-by-event analysis projected to mid-rapidity by , which —within the systematic errors— agree very well with the published results of the event-averaged sub-event based technique using hits or tracks [7]. This constitutes an important, completely independent verification of the event-by-event analysis. Fig. 2 presents the relative flow fluctuations, . In the ratio, most of the aforementioned systematic errors scale out. We find large relative fluctuations of about –%, with little centrality dependence. The data are well described by the fluctuations in the participants eccentricity, , obtained in MCG simulations. These are shown as the shaded band in Fig. 2, corresponding to 90% confidence level boundaries obtained by varying the Glauber parameters within reasonable limits (see LABEL:PhobosFlowPRL3). The contribution from fluctuations is estimated using a fit to the data folded with the known distributions from the PHOBOS centrality trigger studies. Over the range of measured centrality, their contribution (taken in quadrature) is small, less than 15%.
3 Conclusions
First results on event-by-event elliptic flow fluctuations in Au+Au collisions at GeV measured with the PHOBOS detector are presented. Large relative fluctuations of about –% are found, independent of centrality. The new data are well described by fluctuations in the shape of the initial collision region, as predicted with the participant eccentricity using MCG simulations. These results substantiate our conclusions from previous studies on the relevance of such fluctuations for the elliptic flow across nuclear species: The initial-geometry seems to drive the hydrodynamic evolution of the system, not only on average, but event-by-event.
References
References
- [1] Poskanzer A M and Voloshin S A 1998 PRC 58 1671.
- [2] Manly S et al. [PHOBOS] 2006 NPA 774 523-526.
- [3] Alver B et al. [PHOBOS] 2006 sub.to PRL (Preprint nucl-ex/0610037).
- [4] Mrowczynski S and Shuryak E 2003 Acta Phys.Polon. B34 4241.
- [5] Alver B et al. [PHOBOS] 2006 , Preprint nucl-ex/0608025.
- [6] Back B B et al. [PHOBOS] 2005 NPA 757 28.
- [7] Back B B et al. [PHOBOS] 2005 PRC 72 051901(R).
- [8] Ollitrault J Y 1992 PRD 46 229.