Incident-energy and system-size dependence of directed flow
Abstract
We present STAR’s measurements of directed flow for charged hadrons in Au+Au and Cu+Cu collisions at GeV and GeV, as a function of pseudorapidity, transverse momentum and centrality. We find that directed flow depends on the incident energy, but not on the system size. We extend the validity of limiting fragmentation hypothesis to different collision systems.
1 Motivation
Directed flow is quantified by the first harmonic () in the Fourier expansion of the azimuthal distribution of produced particles with respect to the reaction plane [1]. It describes the collective sideward motion of produced particles and nuclear fragments, and carries information from the very early stage of the collision [2]. Charged-hadron results at RHIC have been previously reported over a wide range of incident energies in Au+Au collisions [3, 4, 5, 6], and they support the limiting fragmentation hypothesis [4, 5, 7]. In RHIC run V (2005), lighter nuclei were collided at GeV and GeV, which enables us to study the system-size dependence of directed flow, as well as the incident-energy dependence.
2 Data sets and the study
This study is based on eight million 200 GeV Au+Au events, five million 62.4 GeV Au+Au events, twelve million 200 GeV Cu+Cu events, and eight million 62.4 GeV Cu+Cu events. All of them were obtained from a minimum-bias trigger. All errors are statistical. Tracks of charged particles are reconstructed by STAR’s main TPC [8] and forward TPCs [9], with the pseudorapidity () coverage of and , respectively. The centrality definition and cuts used are the same as in Ref. [10].
| Centrality | 200 GeV Au+Au | 62.4 GeV Au+Au | 200 GeV Cu+Cu | 62.4 GeV Cu+Cu |
|---|---|---|---|---|
At RHIC energies, it is a challenge to measure accurately due to the small signal of itself and the large systematic error arising from non-flow correlations. In this talk, STAR’s preliminary {ZDC-SMD} results are obtained with non-flow effects minimized by determining the event plane from spectator neutrons, the same approach as used in Ref. [5, 6]. The resolution, as defined in Ref. [1], of the first-order event plane reconstructed with STAR ZDC-SMDs [11] is listed in Table 1. The magnitude of the event plane resolution increases with the spectator and the detector efficiency of the ZDC-SMDs, and the latter is smaller for a lower incident energy and/or a smaller collision system. The method {ZDC-SMD} fails in some centralities, where the event plane resolution is consistent with zero.
3 Results
Figures in this talk follow the same convention as in Ref. [5].
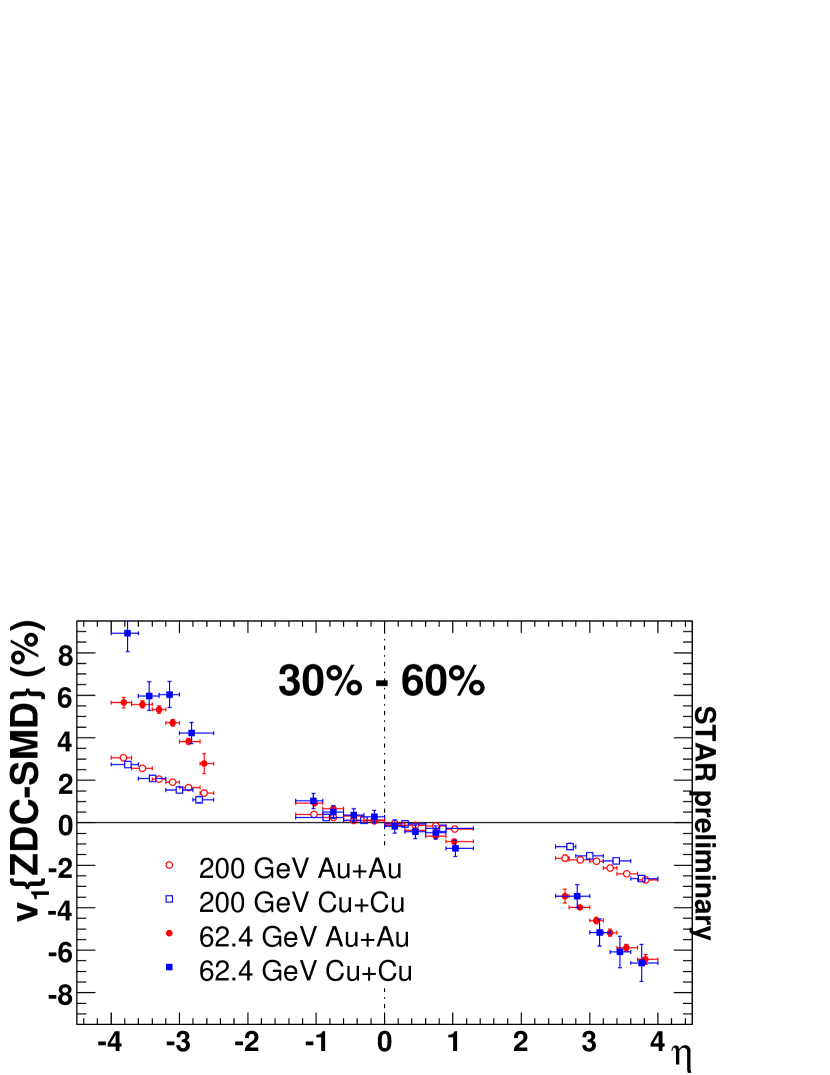
Fig. 2 shows as a function of pseudorapidity, , in most central Au+Au and Cu+Cu collisions at GeV and GeV. Data points in Fig. 2 fall into two bands, and the higher band corresponds to the lower energy, which reveals the incident-energy dependence of . For the pseudorapidity and centrality range we studied, in Au+Au collisions and Cu+Cu collisions are consistent within errors if both of them were obtained at the same incident energy. It is interesting that does not change from Au+Au collisisons to Cu+Cu collisions, while the system size is reduced by . A good consistency of between Au+Au and Cu+Cu collisions is observed even for the region near midrapidity, where in Cu+Cu collisions is considerably lower than that in Au+Au collisions [12]. Unlike which scales with (interpreted to be the participant density [12] or the system length [13]), is found to be independent of the system size. Instead, it scales with the incident energy. A possible explanation to the different scalings for and might come from the way in which they are developed : to produce , intensive momentum exchanges among particles are needed (and the number of momentum exchanges is related to the participant density or the system length), while to produce , one in principle needs only different rapidity losses (related to the incident energy) for particles with different distances to the center of the participant zone.
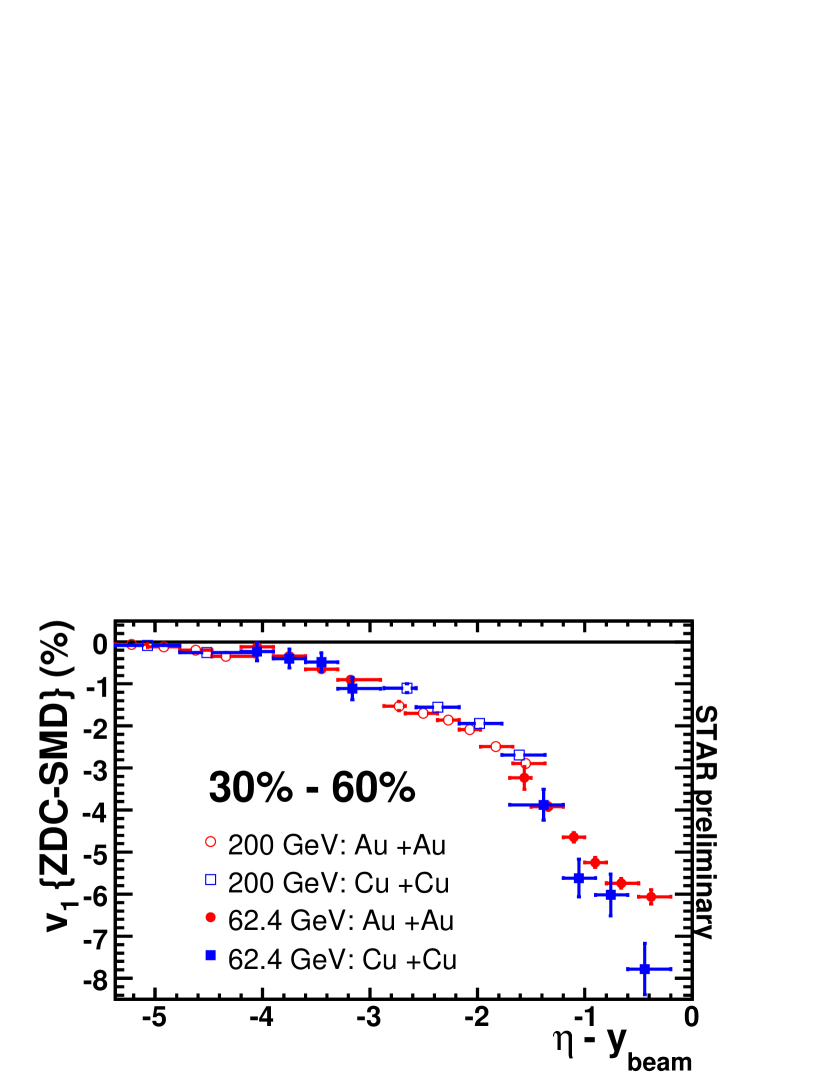
In Fig. 2, we re-arrange the data points of Fig. 2 in the projectile frame, where zero on the horizontal axis corresponds to the beam rapidity, , for each of the incident energies. Within three units from , most data points fall into a universal curve of as a function of . This incident-energy scaling behavior of directed flow suggests that the limiting fragmentation hypothesis [7] holds even for different collision systems.
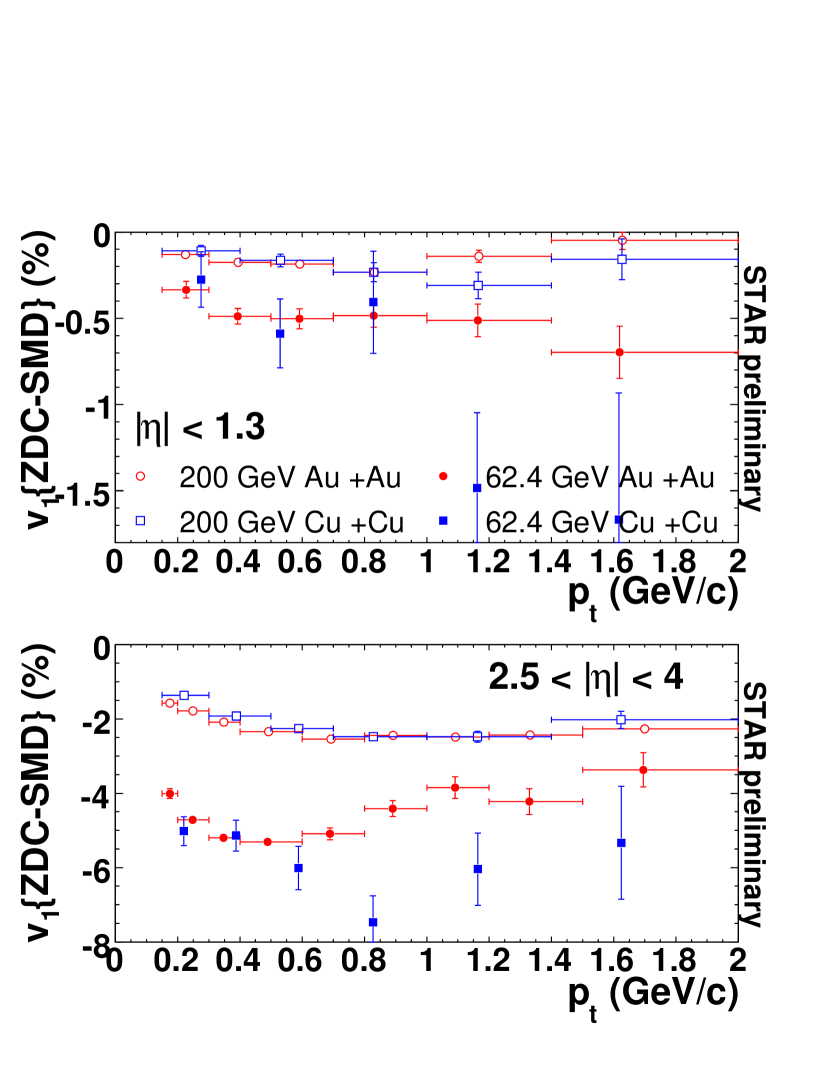
The transverse-momentum () dependence of for charged hadrons is shown in Fig. 4. The upper panel shows the results measured in the main TPC, and the lower panel, in the forward TPCs. Since is asymmetric about , the integral of over a symmetric range goes to zero. We change of particles with negative into , and integrate over all . At 200 GeV, in Au+Au and Cu+Cu collisions are very close to each other (better visible in the forward pseudorapidity region), and saturates above GeV/. At 62.4 GeV, reaches its maximum in magnitude at GeV/, then saturates () or slightly decreases (). Within statistical errors, the incident-energy scaling holds in as well.
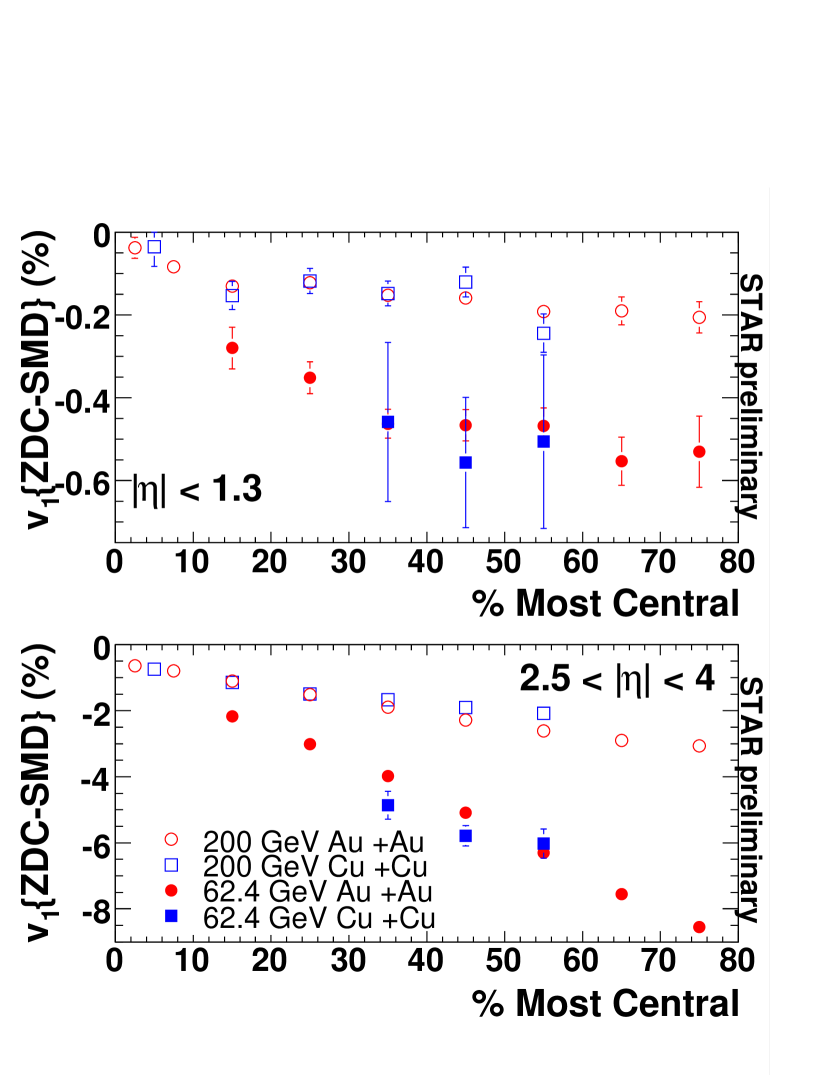
Fig. 4 shows charged-hadron -integrated as a function of centrality for the two collision systems at 200 GeV and 62.4 GeV, and the results are presented in two panels defined in the same way as Fig. 4. On the whole, the magnitude of integrated approaches zero in central collisions and increases as the collisions become more peripheral. At 200 GeV, the -integrated in Au+Au collisions is consistent with that in Cu+Cu collisions in almost all centrality bins, in regions both near the midrapidity () and away from it (). This system-size independence is seemingly true at 62.4 GeV. We can see that the incident-energy scaling of works well as a funtion of centrality, instead of the participant density, with which the scales [12]. This indicates that the initial geometrical shape, but not the density of produced particles, plays an important role in the formation of directed flow.
References
References
- [1] Poskanzer A M and Voloshin S A 1998 Phys. Rev. C 58 1671
- [2] Adams J et al (STAR Collaboration) 2005 Nucl. Phys. A 757 102, and refs. therein
- [3] Adams J et al (STAR Collaboration) 2004 Phys. Rev. Lett. 92 062301
- [4] Back B B et al (PHOBOS Collaboration) 2004 J. Phys. G 30 S1243; Back B B et al (PHOBOS Collaboration) 2006 Phys. Rev. Lett. 97 012301
- [5] Adams J et al (STAR Collaboration) 2006 Phys. Rev. C 73 034903
- [6] Wang G et al (STAR Collaboration) 2006 Nucl. Phys. A 774 515
- [7] Benecke J, Chou T T, Yang C -N and Yen E 1969 Phys. Rev. 188 2159
- [8] Anderson M et al 2003 Nucl. Instr. Meth. A 499 659
- [9] Ackermann K H et al 2003 Nucl. Instr. Meth. A 499 713
- [10] Adams J et al (STAR Collaboration) 2005 Phys. Rev. C 72 014904
- [11] Adler C et al 2001 Nucl. Instr. Meth. A 470 488; The STAR ZDC-SMD has the same structure as the STAR EEMC SMD: Allgower C E et al 2003 Nucl. Instr. Meth. A 499 740; Crawford H et al 2003 STAR ZDC-SMD proposal STAR Note SN-0448
- [12] Back B B et al (PHOBOS Collaboration) 2006 Preprint nucl-ex/0610037; Voloshin S A et al (STAR Collaboration) these proceedings
- [13] Tang A H these proceedings