The anisotropic flow coefficients and in Au+Au collisions at RHIC
Abstract
We present measurements by STAR of the anisotropic flow coefficients and as a function of particle-type, centrality, transverse momentum and pseudorapidity in Au+Au collisions at RHIC.
Anisotropic flow is an azimuthal correlation of the particle momenta with respect to the reaction plane. This flow is recognized as one of the main observables that provide information on the early stage of a heavy-ion collision [1].
In this study, we used minimum-bias Au+Au events taken at a center-of-mass energy of 200 GeV and events taken at 62.4 GeV. The particles were detected by the STAR main TPC [2] and by the forward TPCs [3] and cover a pseudorapidity of and , respectively. From these data, is obtained by the 4-particle cumulant method [4] and is denoted by . This method is less sensitive to non-flow effects compared to measurements based on two particle correlations like or . The coefficient is obtained with respect to the second harmonic event plane and is denoted by . The flow coefficients are studied for different particle species as function of transverse momentum (), pseudorapidity () and centrality. Only statistical errors are shown unless specified.
Transverse momentum dependence.
The left panel of Fig. 1 shows the charged particle
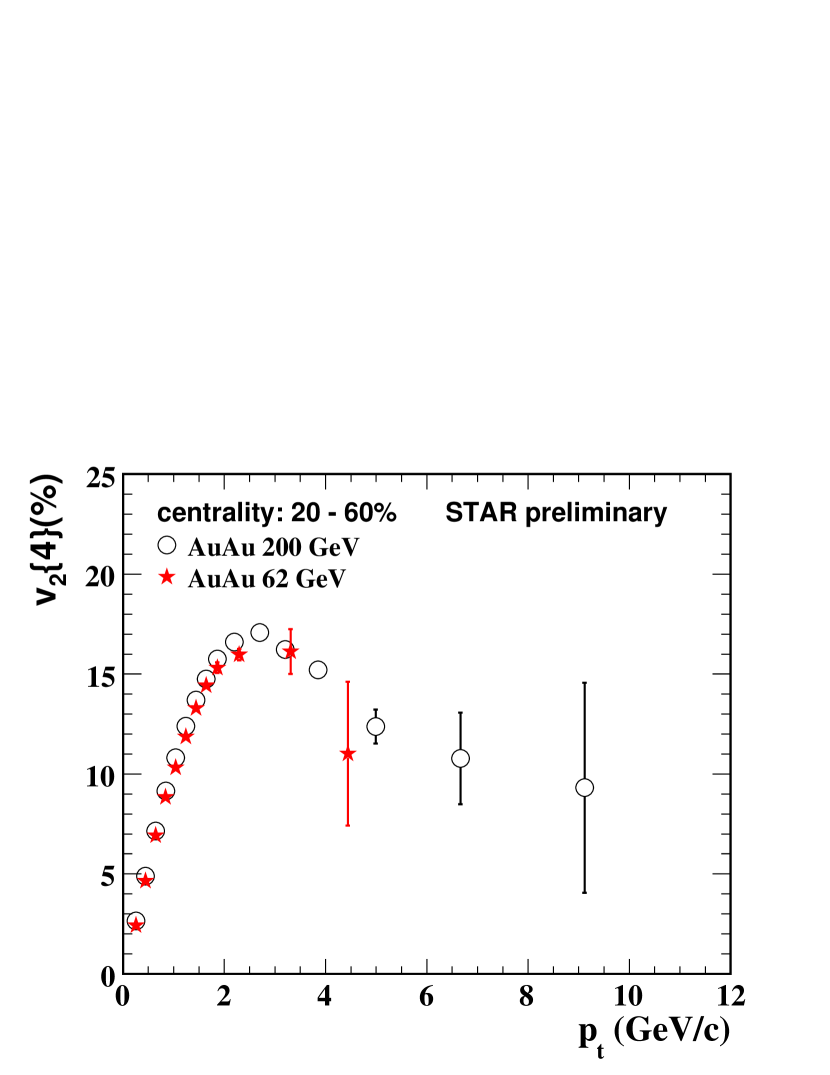
as a function of for mid-central (20–60%) Au+Au collisions at 200 and 62.4 GeV. It is seen that the measured increases with , reaches its maximum around 3 GeV/ and then decreases again. At 200 GeV, is measured up to 10 GeV/ and is still sizable above 8 GeV/. The behavior of at 62.4 GeV is similar to that observed at 200 GeV. It is argued in [5] that at large might be related to the parton energy loss mechanism and may thus provide a constraint on the initial gluon density.
The dependence of the charged particle is shown for both energies in the right panel of Fig. 1. It is seen that increases quadratically at low and has, like , its maximum around 3 GeV/. At 200 GeV, is measured up to 7 GeV/ and is still sizable above 6 GeV/. Similar values are obtained at 62.4 GeV.
Rapidity dependence.
It has been shown that particle production in the fragmentation region exhibits longitudinal scaling when plotted as a function of [6]. It is also known that the integrated elliptic flow for fixed centrality at mid-rapidity is proportional to the particle yield [7]. If this scaling with holds at all rapidities, then is also expected to show a longitudinal scaling behavior. Figure 2 (left) shows as a function of
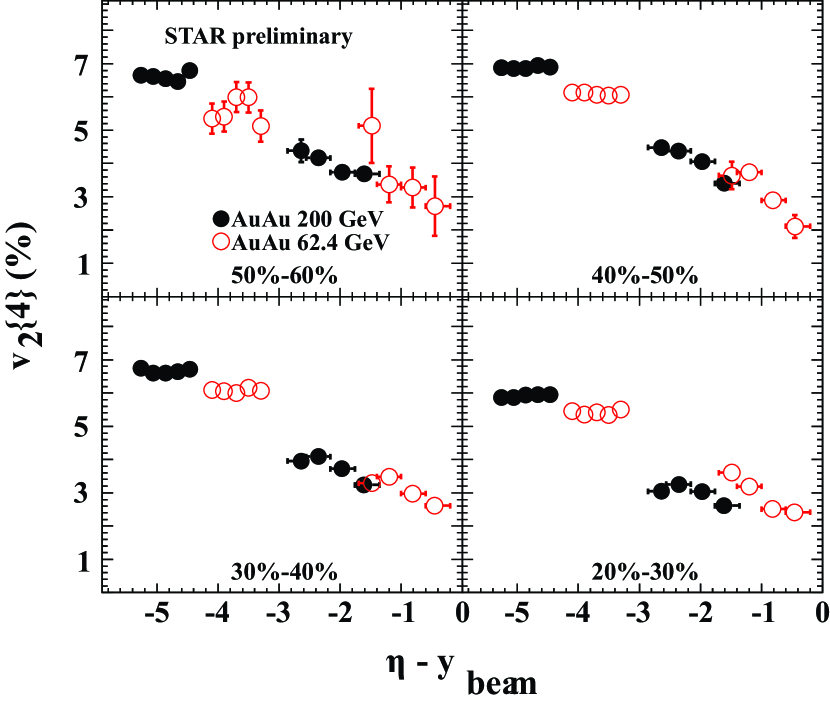
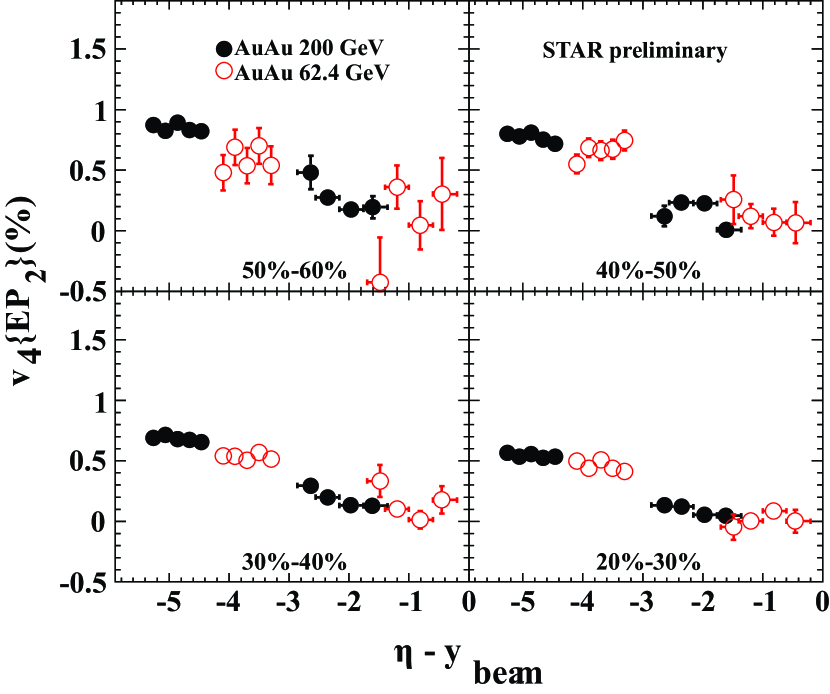
for different centralities at 200 and 62.4 GeV. The values measured at both energies fall on a universal curve, indicating that the longitudinal scaling approximately holds. This scaling is also observed for as can be seen in the right panel of Fig. 2.
Mass and particle type dependence.
It has been shown by STAR [8] that for identified particles at low exhibits a mass ordering. This ordering is well described by hydrodynamic calculations which indicates that all particles flow with a common velocity. At intermediate , scales with the number of constituent quarks [9]. This scaling can be explained in the coalescence picture and is indicative of the partonic origin of flow [10]. The ratio is shown in Fig. 3 (left)
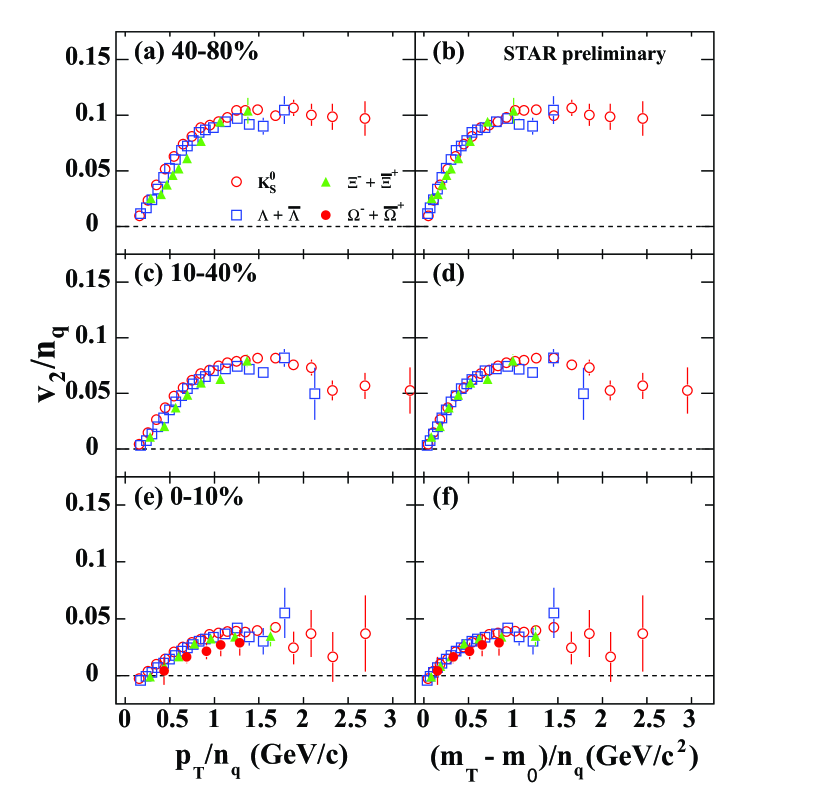
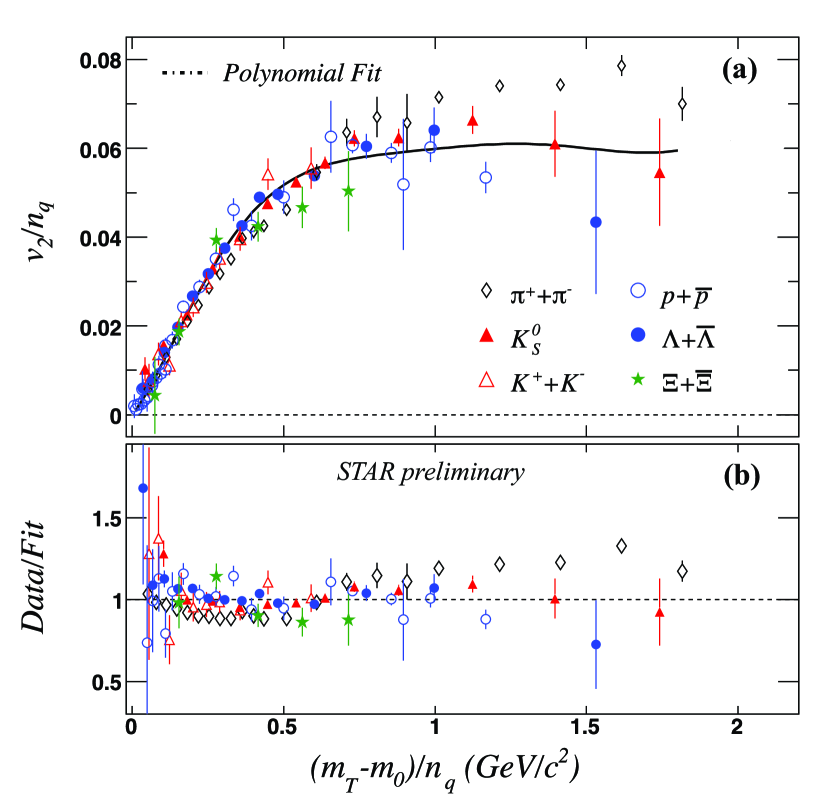
for three different centralities at 200 GeV as a function of and as a function of the scaled transverse mass . The scaled transverse mass, which takes into account relativistic effects, is sometimes considered to be a better scaling variable than [11].
An indication that follows constituent quark scaling independent of centrality is given by the fact that the falls onto a universal curve for each centrality bin. Figure 3 shows that the constituent quark scaling holds at both 200 GeV and 62.4 GeV.
The ratio
In recent work [12], is proposed as a more
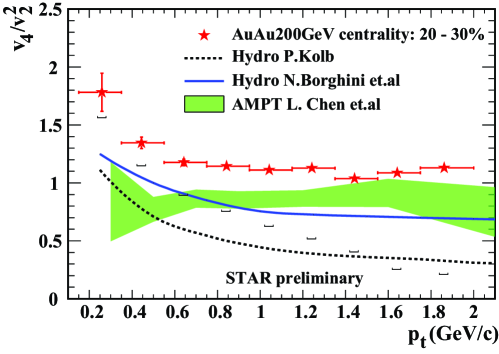
sensitive probe of ideal hydrodynamic behavior. Furthermore, this ratio is directly related to the degree of thermalization of the medium, see also [13]. Under the assumption that is a genuine measure of elliptic flow, the systematic error in the ratio is dominated by non-flow contributions to . It can be shown that the non-flow contribution to is proportional to the difference . Obtaining this difference from the data allows us to estimate the systematic error on . However, the difference can also originate from flow fluctuations [14]. In that case, the systematic error will be reduced. A detailed description of this systematic analysis is beyond the scope of these proceedings and will be described in a future publication.
Figure 4 shows the ratio measured at 200 GeV in the 20–30% centrality interval. The horizontal brackets in this figure show the lower limit of the systematic uncertainty as presently estimated. In this figure, the data are compared to two hydrodynamic model calculations [12, 15] (curves) and to model predictions based on a microscopic partonic and hadronic description of the collision (AMPT model, filled area) [16]. It is seen that the data lie above the model predictions. However, the present systematic uncertainties do not allow us to either validate or exclude these two models.
References
References
- [1] STAR Collaboration, Adams J et al., 2005 Nucl. Phys. A 757 102, and references therein.
- [2] Anderson M et al., 2003 Nucl. Instr. Meth. A 499, 659.
- [3] Ackermann K H et al., 2003 Nucl. Instr. Meth. A 499, 713.
- [4] Borghini N, Dinh P M and Ollitrault J-Y, 2001 Phys. Rev. C 64 054901.
- [5] Snellings R, Poskanzer A M and Voloshin S A, nucl-ex/9904003; Gyulassy M, Vitev I and Wang X N, 2001 Phys. Rev. Lett. 86 2537.
- [6] PHOBOS Collaboration, Back B B et al., 2006 Phys. Rev. C 74 021901.
- [7] STAR Collaboration, Adler C et al., 2002 Phys. Rev. C 66, 034904.
- [8] STAR Collaboration, Adler C et al., 2001 Phys. Rev. Lett. 87, 182301.
- [9] STAR Collaboration, Adams J et al., 2004 Phys. Rev. Lett. 92, 052302.
- [10] Molnar D, Voloshin S A, 2003 Phys. Rev. Lett. 91 092301.
- [11] PHENIX Collaboration, Adare A et al.,nucl-ex/0608033.
- [12] Borghini N, Ollitrault J-Y, 2006 Phys.Lett. B 642, 227-231.
- [13] Ko C M, in these proceedings;
- [14] Miller M, Snellings R, nucl-ex/0312008; Sorensen P, in these proceedings; Tang A H, in these proceedings; Voloshin S A, in these proceedings.
- [15] Kolb P F, 2003 Phys. Rev. C 68, 031902.
- [16] Chen L, Ko C M and Lin Z, 2004 Phys. Rev. C 69, 031901.