NA60 results on the spectral function in In-In collisions
Abstract
The NA60 experiment at the CERN SPS has studied low-mass muon pairs in 158 AGeV In-In collisions. A strong excess of pairs is observed above the yield expected from neutral meson decays. After subtraction of the decay sources, the shape of the resulting mass spectrum is largely consistent with a dominant contribution from annihilation. The associated spectral function exhibits considerable broadening, but essentially no shift in mass. The acceptance-corrected spectra have a shape atypical for radial flow. They also significantly depend on mass, pointing to different sources in different mass regions. Both mass and spectra are compared to recent theoretical predictions.
keywords:
Relativistic heavy-ion collisions , Quark-gluon plasma , Lepton PairsPACS:
25.75.-q , 12.38.Mh , 13.85.Qkfor the NA60 Collaboration: ,
1 Introduction
Thermal dilepton production in the low-mass region is largely mediated by the light vector mesons , and . Among these, the (770 MeV/c2) is the most important, due to its strong coupling to the channel and its short lifetime of only 1.3 fm/c, much shorter than the lifetime of the fireball. Theoretical predictions exist for changes both of the mass and the width which are tied directly [1, 2] or indirectly [3] to chiral symmetry restoration. While broadening of the is generally expected, changes of the mass are controversial. For masses 0.9 GeV/c2, other hadronic processes set in, and partonic processes start to play a larger role as well. The first NA60 results focused on the space-time averaged spectral function of the [4]; more details were added recently [5]. The present paper therefore concentrates on new developments: an analysis of the shape of the excess mass spectra [5], and in particular first results on acceptance-corrected and spectra for different mass windows. Mass and spectra are also compared to the latest theoretical developments [6, 7, 8].
2 Experimental results
Details of the NA60 apparatus are contained in [9, 10], while the different analysis steps (including the critical assessment of the combinatorial background from and decays through event mixing) are described in [11]. The results reported here were obtained from the analysis of data taken in 2003 for In-In at 158 AGeV. The left part of Fig. 1 shows the opposite-sign, background and signal dimuon mass spectra, integrated over all collision centralities. After subtracting the combinatorial background and the signal fake matches, the resulting net spectrum contains about 360 000 muon pairs in the mass range 0-2 GeV/c2, roughly 50% of the total available statistics. The associated average charged-particle multiplicity density measured by the vertex tracker is =120. The vector mesons and are completely resolved; the mass resolution at the is 20 MeV/c2. A major part of the subsequent analysis is done in four classes of collision centrality (defined through the charged-particle multiplicity density): peripheral (430), semiperipheral (30110), semicentral (110170) and central (170240).
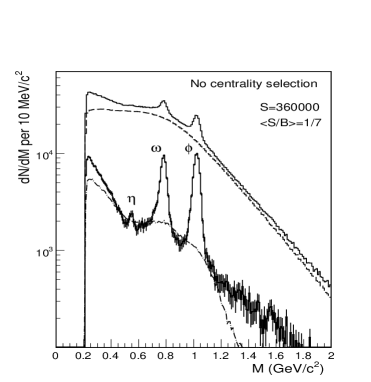
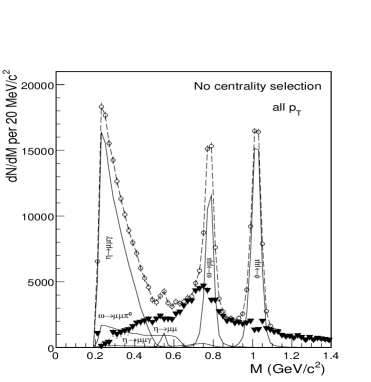
The peripheral data can essentially be described by the expected electromagnetic decays of the neutral mesons, i.e. the 2-body decays of the , , and resonances and the Dalitz decays of the , and [4, 5]. This is not true in the more central bins, due to the existence of a strong excess. To isolate this excess with a priori unknown characteristics without any fits, we have used a novel procedure as shown in Fig. 1 (right), made possible by the high data quality. For each centrality bin, the cocktail of the decay sources is subtracted from the data by using solely local criteria [4, 5]. The on the contrary, is not subtracted. Examples for the resulting difference spectra are contained in Fig. 1 (right) for all centralities and in Fig. 6 for the semicentral bin. The qualitative features of the spectra are striking: a peaked structure is always seen, residing on a broad continuum with a yield strongly increasing with centrality, but remaining essentially centered around the position of the nominal pole. Further details on the subtraction procedure and the results, including a discussion of the systematic errors (which reach up to 25% in the continuum region), can be found in [4, 5].
A more quantitative analysis of the shape of the excess mass spectra vs. centrality has recently been performed, using a finer subdivision of the data into 12 centrality bins. The data (Fig. 1, right) were subdivided into 3 windows, one central (C) in the mass range 0.640.84 GeV/c2, and two adjacent ones on the left (L) and the right (R) with equal widths. The spectral shape can then roughly be characterized by two yields: C-(L+R)/2 for the -like peak, and 3(L+R)/2 for the underlying continuum. The ratios peak/, continuum/ and peak/continuum (where stands for the cocktail ) are plotted in the left part of Fig. 2, compared to the RMS of the total mass interval 0.441.04
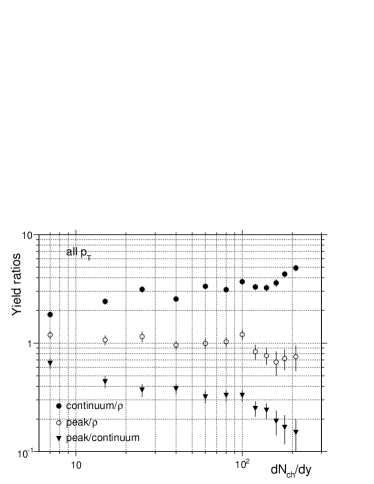
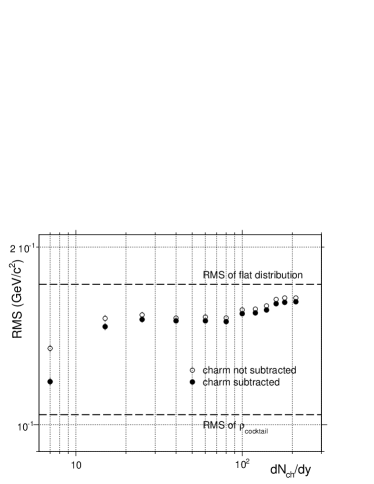
GeV/c2 on the right. Three essential features should be noted. First, the ratio peak/ decreases from the most peripheral to the most central bin by nearly a factor of 2, ruling out the naive view that the shape can simply be explained by the cocktail residing on a broad continuum, independent of centrality. Second, the sum of the ratios (peak+continuum)/ is the total enhancement factor relative to the cocktail ; it reaches about 5.5 in the most central bin. Third, the centrality dependences are largely consistent in the two plots. In particular, the flat part up to dNch/dy=100 is followed by more rapid changes in all variables, statistically highly significant for the ratio continuum/ and the RMS.
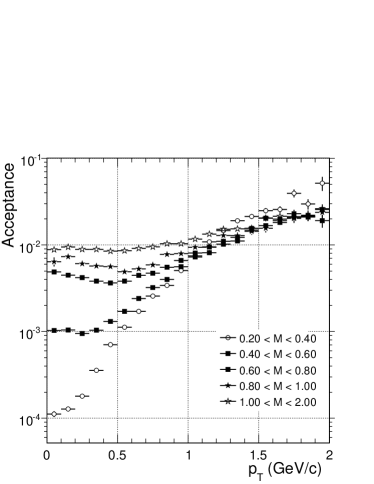
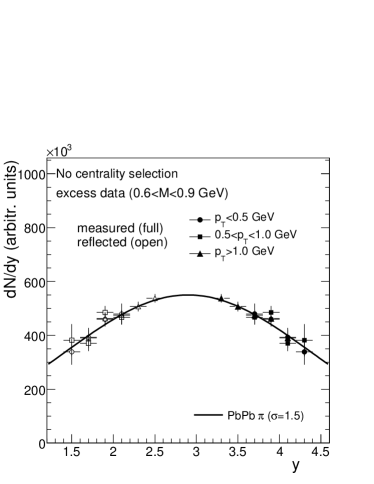
Dependences on were so far shown only as mass spectra associated with three different windows, without acceptance correction [5]. We have now obtained acceptance-corrected spectra associated with three different mass windows. The NA60 acceptance relative to as a function of is shown in Fig. 3 (left). In principle, the acceptance correction requires a 3-dimensional grid in space. However, the low populated bins in the phase space corners can introduce large errors once the correction is applied. To overcome this problem, the correction is performed in 2-dimensional space, using the measured rapidity distribution as an input. The latter was determined with an acceptance correction found, in an iterative way, from Monte Carlo simulations matched to the data in mass and . On the basis of this rapidity distribution, 0.1 GeV/ bins in mass and 0.2 GeV/ bins in were used to determine the remaining 2-dimensional correction. Once corrected, the results were integrated over the three extended mass windows 0.40.6, 0.60.9 and 1.01.4. GeV/c2. The rapidity distribution of the central mass window is shown in Fig. 3 (right) for three different windows. It is interesting to note that it resembles closely the distribution of inclusive pion production, as measured by NA49 for Pb-Pb.

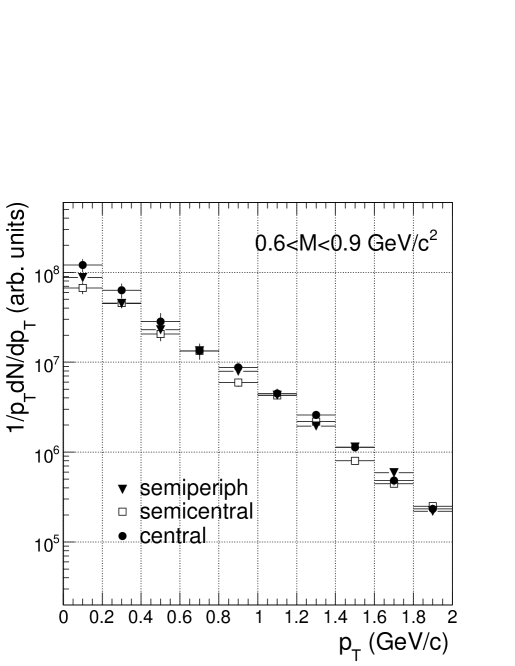

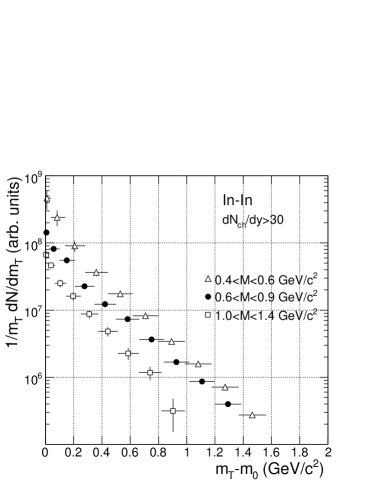
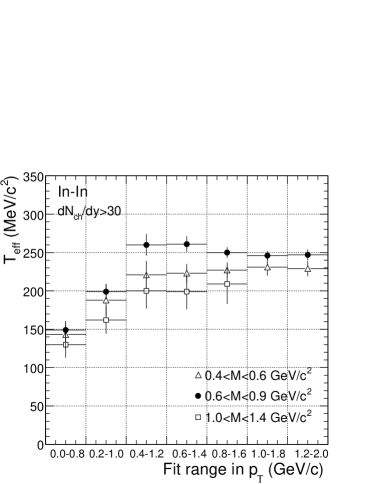
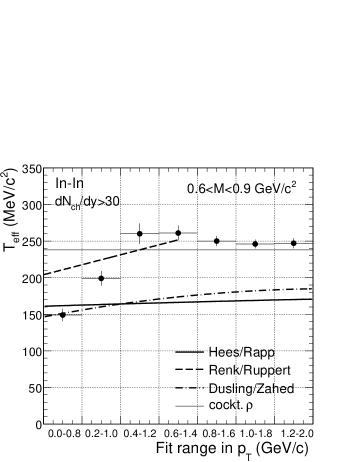
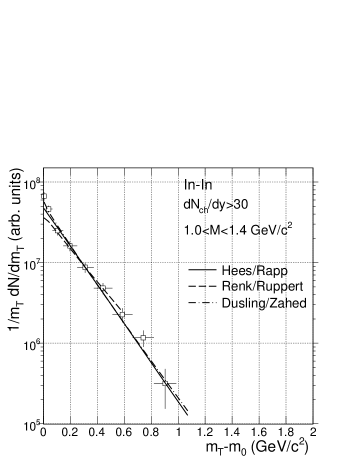
The results for the acceptance-corrected spectra are summarized in Fig. 4. The errors shown are purely statistical. Systematic errors arise from the acceptance corrections including the rapidity distribution used, the subtraction of the cocktail, and the subtraction of the combinatorial background plus fake matches. For 0.5 GeV/c, the combinatorial background contributes most, ranging from 10 to 25% for semiperipheral up to central. For 1 GeV/c, the statistical errors dominate. The data show a significant dependence on mass, but hardly on centrality. To bear out the differences in mass more clearly, the data were summed over the three more central bins and plotted vs. transverse mass in place of , as shown in Fig. 5 (left). The inverse slope parameter as determined from differential fits of the spectra with , using a sliding window in , is plotted on the right. The main features of the results are remarkable and somewhat unexpected. At very low , all spectra steepen rather than flatten, as expected from radial flow, equivalent to very small values of (the resonance, placed just in between the upper two mass windows, does flatten as expected). Moreover, depending on the fit region, covers an unusually large dynamic range. Finally, the largest masses have the steepest spectrum, i.e. the smallest value of everywhere, again contrary to radial flow and to what is usually observed for hadrons. All this suggests that different mass regions are coupled to basically different emission sources.
3 Comparison to theoretical models
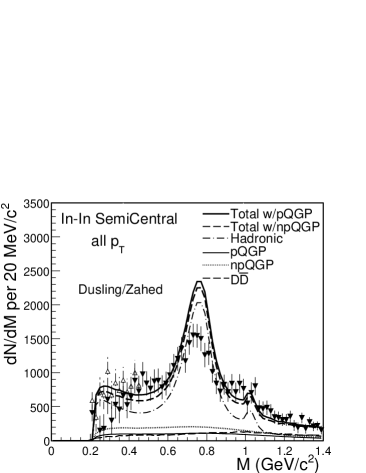
The qualitative features of the excess mass spectra shown above are consistent with an interpretation as direct thermal radiation from the fireball, dominated by annihilation. As explained in detail in [4, 5], the excess mass spectra, with no acceptance correction and no selection, can be approximately interpreted as the spectral function of the intermediate , averaged over momenta and the complete space-time history of the fireball.
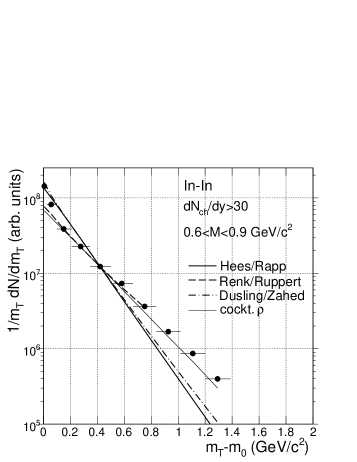
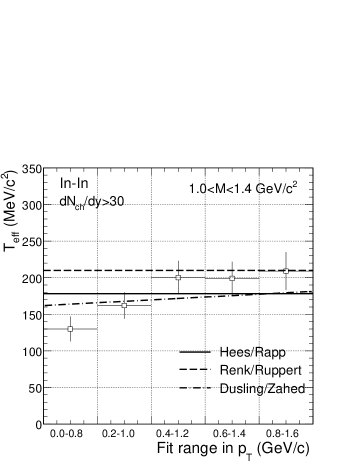
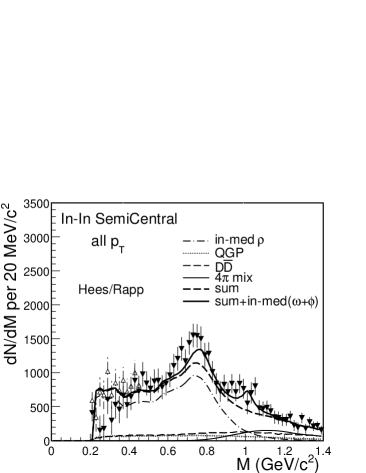
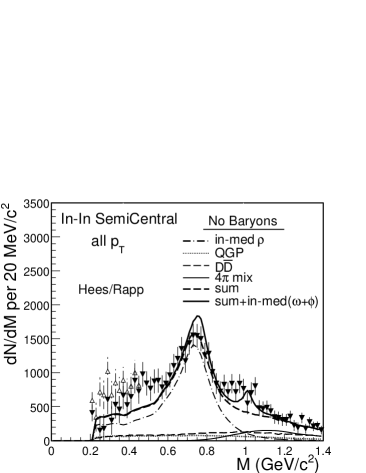
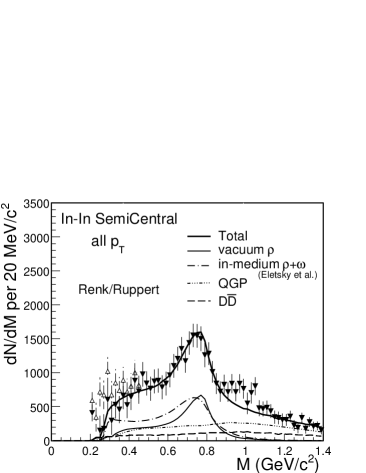
As already discussed in the first NA60 publications (see [4, 5] and earlier ref. cited ibd.), the moving-mass scenario à la Brown/Rho scaling [2] was found to be incompatible with the experimental excess mass spectra. Even considering fireball variations within extremes, this has basically remained unchanged. Other scenarios, characterized essentially by a broadening of the , have in the meantime been refined [6] or newly developed [7, 8]. A summary of the comparison of these latest theoretical results to the excess mass spectrum for the semicentral bin is contained in Fig. 6. Hees/Rapp [6] have modified the fireball part of the original predictions for In-In in the 2 region (based on [3]) and have now also added 4 processes, reflecting vector-axialvector mixing; the latter makes a strong contribution for 1 GeV/c2. Renk/Ruppert [7] use the spectral function of Eletsky et al. including baryonic effects in the 2 region, coupled to a strong partonic contribution which dominates the yield for 1 GeV/c2. Dusling/Zahed [8] use a chiral virial approach including baryonic interactions, coupled again to some partonic contribution which is on a similar level as the hadronic yield for 1 GeV/c2. All models achieve a reasonable description of the mass spectrum over the whole mass range, even in absolute terms. For 0.5 GeV/c2, the decisive role played by baryonic interactions in [6] is seen in the upper right of Fig. 6 by switching them off. For 1 GeV/c2, the agreement of all predictions with the data implies a low (if any) sensitivity to the dynamics here, equivalent to hadron-parton duality. The spectra predicted by the models above are compared to the data in Fig. 7. In contrast to the mass spectra, none of the predictions is presently able to provide a satisfactory description of the spectra over their full range. It seems that the spectra are, in some sense, more sensitive to the dynamics than the mass spectra. A quantitative understanding of the spectra may thus help to discriminate between the different sources and provide further insight beyond hadron-parton duality (e.g. different radial flow effects for hadrons and partons).
Summarizing, the previously measured excess mass spectra and the new acceptance-corrected and spectra present rather strict boundary conditions to theoretical modeling. Beyond the spectral function itself, this may also lead to a better understanding of the continuum part of the spectra.
References
- [1] R. D. Pisarski, Phys. Lett. 110B, 155 (1982)
- [2] G. E. Brown, M. Rho, Phys. Rept. 363, 85 (2002)
- [3] R. Rapp and J. Wambach, Adv. Nucl. Phys. 25, 1 (2000)
- [4] R. Arnaldi et al. (NA60 Collaboration), Phys. Rev. Lett. 96 (2006) 162302
- [5] S. Damjanovic et al. (NA60 Collaboration) (2006) nucl-ex/0609026
- [6] H. van Hees and R. Rapp, Phys. Rev. Lett. 97 (2006) 102301
- [7] T. Renk and J. Ruppert, arXiv:hep-ph/0612113; T. Renk et al., in preparation
- [8] K. Dusling, D. Teaney and I. Zahed, arXiv:nucl-th/0604071
- [9] G. Usai et al. (NA60 Collaboration), Eur. Phys. J. C43, 415 (2005)
- [10] M. Keil et al., Nucl. Instrum. Meth. A539, 137 (2005) and A546, 448 (2005)
- [11] R. Shahoyan et al. (NA60 Collaboration), Nucl. Phys. A774, 677 (2006)