Production of and of
Mesons in Heavy-Ion Collisions
from 0.6 to 2.0 GeV Incident Energy
Abstract
This paper summarizes the yields and the emission patterns of K+ and of K- mesons measured in inclusive C+C, Ni+Ni and Au+Au collisions at incident energies from GeV to GeV using the Kaon Spectrometer KaoS at GSI. For Ni+Ni collisions at and at GeV as well as for Au+Au at GeV detailed results of the multiplicities, of the inverse slope parameters of the energy distributions and of the anisotropies in the angular emission patterns as a function of the collision centrality are presented. When comparing transport-model calculations to the measured K+ production yields an agreement is only obtained for a soft nuclear equation of state (compression modulus MeV). The production of K- mesons at energies around to GeV is dominated by the strangeness-exchange reaction () which leads to a coupling between the K- and the K+ yields. However, both particle species show distinct differences in their emission patterns suggesting different freeze-out conditions for K+ and for K- mesons.
pacs:
25.75.Dwversion of
I Introduction
Relativistic heavy-ion collisions at incident energies ranging from to GeV provide a unique opportunity to study the behavior of nuclear matter at high densities. These studies are important challenges for testing the present understanding of nuclear matter. In addition, they are of relevance for astrophysics, as the modelling of neutron stars or of supernovae depends on the properties of nuclear matter under these extreme conditions SN .
In central Au+Au collisions at the incident energies under investigation densities of 2 – 3 times normal nuclear matter density can be reached Hart_NP94 ; Fuchs_Rev ; hart_habil . A sensitive probe to test these conditions is the production of strange mesons at or below the production thresholds of these particles in free NN collisions. The rest mass of charged kaons is 0.454 GeV. For the K+ production the threshold in NN collisions is 1.58 GeV (in the laboratory system) as defined by the associate production and it is 2.5 GeV for the K- production via pair creation .
The key mechanism for the K+ production in heavy-ion reactions at these incident energies is the accumulation of the necessary energy by multiple collisions of particles inside the reaction zone. Higher densities increase the number of these collisions and especially second generation collisions like with sufficiently high relative momentum to create a K+ occur most frequently during the high-density phase of the reaction. The density reached in the reaction zone depends on the stiffness of nuclear matter. Because of their specific production mechanism and because of their rather long mean free path ( fm at normal nuclear density) K+ mesons are ideal probes to explore the high-density phase of a heavy-ion reaction and to study the stiffness of the nuclear equation of state (EoS) ko84 ; aich ; sturm ; fuchs ; Hart_eos .
In contrast, the behavior of K- mesons in a dense nuclear medium is expected to be very different from the one of the K+ mesons due to two distinct properties:
(i) The interaction with nuclear matter: The K+ are hardly absorbed in nuclear matter due to strangeness conservation. It is very unlikely that a rare K+ (containing an quark) encounters an equally rare hyperon Y (, ) containing an quark. The K- on the contrary, can easily be absorbed on a nucleon converting it into a hyperon and a pion. Consequently, the mean free path of the K- is significantly shorter than the one of the K+. The strangeness-exchange reaction has a large cross section and is therefore responsible for the appearance and disappearance of K- mesons. This channel has been suggested to be the dominant production mechanism in nucleus-nucleus collisions ko84 and this has been demonstrated in AF ; Oe00 ; Hart03 .
(ii) The influence of KN potentials: According to various theoretical approaches the KN interaction is governed by the superposition of a scalar and a vector potential kaplan ; gbrown ; waas ; schaf ; lutz ; laura . While the scalar potential acts attractively on both kaon species, the vector potential repels K+ and attracts K-. For K+ these two contributions almost cancel leading to a small repulsive interaction. For the K- the addition of both attractive interactions results in a strongly attractive potential. Attempts to observe these effects in the respective production cross sections are under discussion laue ; menzel ; crochet ; wisniewski ; brown ; cass_brat ; Hart03 . These potentials are predicted to have a sizeable effect on the azimuthal emission patterns of K+ and of K- (elliptic flow) li_v2 ; wang_v2 which has been observed at the Kaon Spectrometer shin ; FU .
This paper intends to give a comprehensive overview on the cross sections and on the emission patterns of the K+ and of the K- production in mass-symmetric heavy-ion reactions in the incident energy range from to GeV. It summarizes new as well as previously published laue ; laue_epj ; menzel ; sturm ; AF results on inclusive collisions of Au+Au, Ni+Ni and C+C collisions. Furthermore, new results focussing on the centrality dependence of Ni+Ni collisions at and at GeV and of Au+Au collisions at GeV are presented. Results on the kaon production in the mass-asymmetric collision systems C+Au and Au+C have been published recently schmah . The results on the azimuthal distributions of kaons shin ; FU as well as of pions and of protons Brill have been published and further publications on this topic are in preparation as well as a review on pion production.
This paper is structured in the following way: First, in Section II, a description of the experimental setup and of the data analysis is given. In Section III.1 we summarize the results on cross sections, energy distributions, and polar angle distributions for inclusive collisions, i.e. without any selection in the collision centrality. Section III.2 presents a detailed study of the centrality dependence of the K+ and of the K- production. In Section IV.1 the measured yields of K+ and of K- mesons are discussed showing that their production is correlated. Despite this correlation of the production yields the emission patterns of K+ and of K- mesons differ significantly. Section IV.2 discusses these differences with respect to the influences of the KN-potentials and with respect to different emission times of the two kaon species. Section IV.3 compares the production yields of K+ mesons in different collision systems to recent transport model calculations to extract information on the stiffness of the nuclear equation of state.
II The Experiment
II.1 The Setup
The experiments were performed with the Kaon Spectrometer (KaoS) at the heavy-ion accelerator SIS (Schwerionensynchrotron) at the GSI (Gesellschaft für Schwerionenforschung) in Darmstadt, Germany. A detailed description is presented in senger . Here we just briefly review the main features.
The setup of the quadrupole-dipole spectrometer KaoS is shown in Fig. 1. Positively and negatively charged particles are measured separately using different magnetic field polarities. The magnetic spectrometer has an acceptance in solid angle of msr and covers a momentum bite of . The short distance of - m from the target to the focal plane minimizes the number of kaon decays in flight. The loss of kaons by decay and due to the geometrical acceptance is accounted for by corrections which are determined by Monte-Carlo simulations using the code GEANT GEANT . Particle identification is based on momentum and on time-of-flight (TOF) measurements. The trigger system is as well based on the time-of-flight information to separate pions, kaons and protons. For the separation of high momentum protons from kaons a threshold Cherenkov detector misko_nim is used in addition. The trigger system suppresses pions and protons by factors of 102 and of 103, respectively.
In total there are three time measurements using segmented plastic scintillator arrays: The TOF Start detector between the quadrupole and the dipole (16 modules), the TOF Stop detector in the focal plane of the spectrometer (30 modules), and the Large-Angle Hodoscope (LAH) around the target point covering polar laboratory angles of (84 modules). The latter allows for a second time-of-flight measurement for background rejection and for the determination of the collision centrality using the number of measured charged particles.
The trajectory reconstruction is based on three large-area Multi-Wire Proportional Counters (MWPC 1 - 3) stelzer , one between the quadrupole and the dipole and two behind the dipole magnet, each of them measuring two spatial coordinates. The efficiencies for kaon detection are larger than 95% for each of these detectors.
The beam intensity is monitored using two scintillator telescopes positioned at backward angles (), measuring the flux of charged particles produced in the target which is proportional to the beam intensity. The absolute normalization is obtained in separate measurements at low beam intensities using a plastic scintillation detector directly in the beam line. The beam intensities have been chosen such, that the efficiency of the data acquisition system (DAQ) due to dead time was always above 50%.
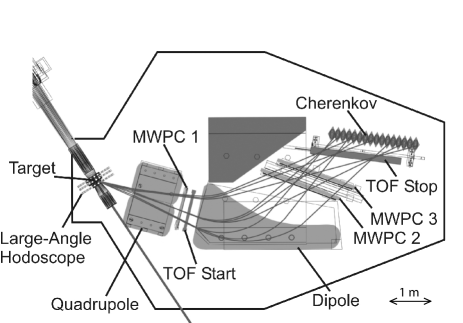
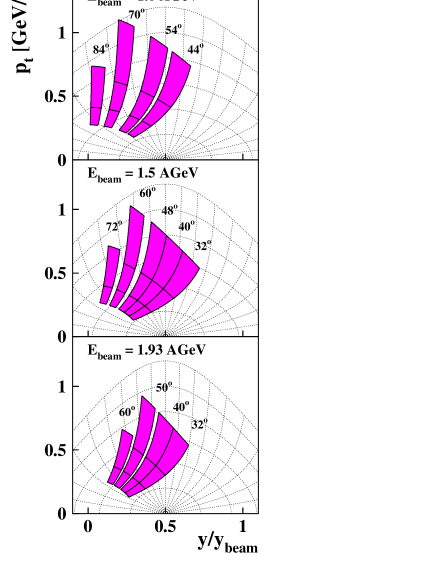
The spectrometer is mounted on a platform which can be rotated around the target point on an air cushion in a polar angel range from to . The angular range covered at each position is . Throughout this paper we will always quote the mean value. The momentum coverage is maximized by measuring different magnetic field settings (, , and T). The resulting coverage for kaons in rapidity normalized to the beam rapidity and in transverse momentum is sketched in Fig. 2 for three different beam energies (, , and GeV ). The shaded areas correspond to different angular settings of the spectrometer in the laboratory as denoted in the figure and to various magnetic field settings.
In this paper we report on measurements of the collision systems C+C (, , , , , and GeV beam energy), Ni+Ni (, , and GeV), and Au+Au (, , , , and GeV). The targets as well as their respective thicknesses and interaction probabilities are given in Table 1.
| target | thickness [mm] | interact. prob. |
|---|---|---|
| C | 3.0 | 2.7% |
| Ni | 0.8 | 2.1% |
| Au (,, GeV) | 1.0 | 3.6% |
| Au (, GeV) | 0.5 | 1.8% |
Due to the energy loss in the Au targets the average effective beam energies for kaon production in these cases are , , , , and GeV. For the other target materials the energy loss is negligible. Throughout the text we use the values of the nominal beam energies . However, in all figures displaying data as a function of the beam energy the data points are plotted at .
In the case of the GeV Au beam an exceptional operation of the GSI accelerator facility was required: acceleration of ions with the synchrotron SIS up to an energy of GeV, then extraction and full stripping, followed by injection into the Experimental Storage Ring (ESR) where the beam was cooled (electron cooling) and finally re-injection into the SIS and acceleration up to GeV.
II.2 Data Analysis
II.2.1 Track Reconstruction
For the reconstruction of particle tracks in the spectrometer, reconstruction functions correlating the spatial coordinates measured by different detectors are used to combine the information of different detectors to track candidates. For example, one reconstruction function is used to calculate the -coordinate in the MWPC between the quadrupole and the dipole () as a function of the -coordinates of the two MWPCs behind the dipole (). By comparing a measured position in one detector with the calculated position based on the hits in other detectors using the reconstruction functions, track candidates are created. This is done for the spatial coordinates in the MWPCs as well as for the assignment of the modules of the TOF detectors.
The reconstruction functions are determined by Monte-Carlo simulations using a complete description of the experimental setup within GEANT. Single tracks are followed through the spectrometer and the correlation functions are determined by fitting polynomial functions up to seventh order and with up to three -coordinates and up to three -coordinates to all these simulated tracks.
After the reconstruction a resulting track candidate consists of - and -coordinates in all the three MWPCs, the module numbers, the time and the energy-loss information of the TOF Start and of the TOF Stop detector as well as the time and the multiplicity information of the Large Angle Hodoscope.
To determine the efficiency of the tracking procedure GEANT is used. This time not only single tracks are generated but combinations of one or several tracks and additional background hits in the different detectors as observed in the experiment. The resulting efficiencies vary with the laboratory angle, the magnetic field strength, and the size of the collision system because of varying track and background multiplicities. The resulting efficiencies of the tracking procedure are always larger than 90%.
For each track candidate constructed in the preceding steps, the momentum and the length of the flight path between the TOF Start and the TOF Stop detector modules are obtained from a lookup table generated with GEANT. From these quantities together with the measured time difference between the two TOF detectors, the squared mass over charge ratio is calculated using
| (1) |
Since the particles under investigation have we simply use ’mass’ in the following.
II.2.2 Background Reduction and Cross Section Calculation
Figure 3 shows mass distributions
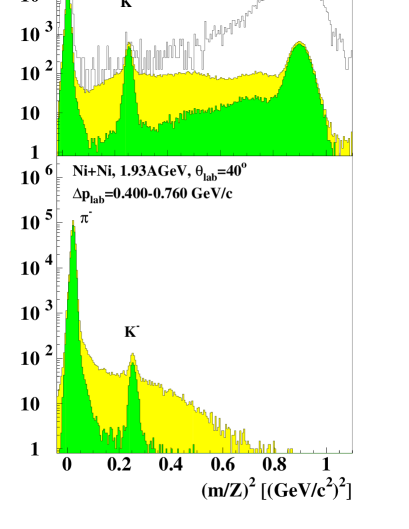
for Ni+Ni collisions at . The distribution in the upper panel has been measured at a beam energy of GeV and at particle momenta GeV/ using the magnetic field setting for positively charged particles. In this case of low beam energy and of low particle momenta the region of the kaon mass is dominated by background. The distribution labelled “w/o TOF-Trigger” was measured using trigger conditions that forced every particle passing through the spectrometer to be recorded. The distribution labelled “with TOF-Trigger” shows the clear reduction of pions and protons being recorded when using the time-of-flight trigger, but still no clear K+ signal can be seen. The situation is different at higher beam energies or at higher particle momenta where the kaons are clearly visible already in the distributions “with TOF-Trigger” as can be seen in the two lower panels of Fig. 3. They show mass distributions for Ni+Ni at GeV for positively charged particles in the middle panel and for negatively charged particles in the lower panel. In the latter case, the trigger condition “w/o TOF-Trigger” was not measured.
To reduce the remaining background effectively without loosing too many kaons two types of selection criteria are applied:
(i) The so-called “geometrical cuts”: These selection criteria are based on the comparison between measured positions in one of the MWPCs and those extrapolated from hits in the other two using the reconstruction functions described in the previous section. These selection criteria are adjusted using measurements during the same experiment which are nearly free of background (highest beam energy and/or largest laboratory angle). This can be done since the particle trajectories inside the spectrometer only depend on the magnetic field and the geometrical setup but not on quantities like or .
(ii) The so-called “velocity cut”: For each track candidate the particle velocity between the TOF Start detector and the TOF Stop detector is calculated as well as the velocity between the Large-Angle Hodoscope and the TOF Stop detector. The comparison of these two velocities is a powerful tool to suppress background created by fake track candidates. The “velocity cut” is adjusted using the measurements nearly free of background as in the case of the “geometrical cuts”.
Depending on the initial signal-to-background ratio the strength of these cuts is varied between and . After the application of the selection criteria the final signal-to-background ratio varies between and . The impact of the cuts on the mass distributions is as well shown in Fig. 3 (labelled “with TOF Trigger and Cuts”). In many cases the remaining background is rather small as can be clearly seen in the two lower mass distributions measured at GeV. Even in the case of low beam energy and low particle momenta a clear K+ signal can be observed after applying the selection criteria (upper panel, please note the logarithmic scale).
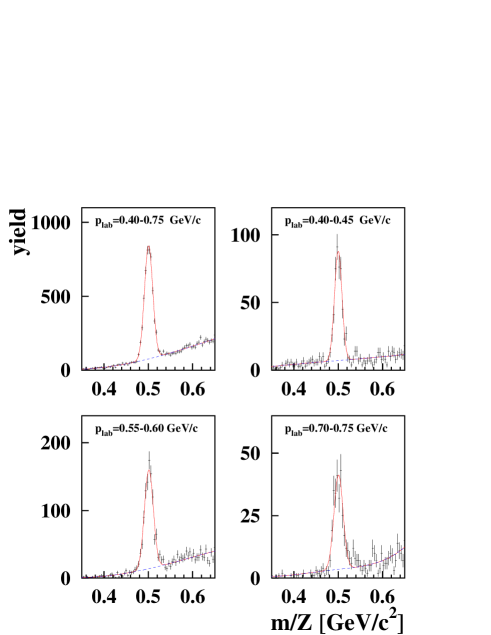
In order to subtract the remaining background in the mass distributions, a combined fit using a Gaussian and a polynomial function to the mass distribution is performed within a window around the kaon mass. The polynomial part is used to estimate the background below the kaon peak and is subtracted. Figure 4 shows mass distributions for Ni+Ni collisions at GeV at as an example with a significant background contamination. The fits are performed separately for each bin in particle momentum (in most cases having a width of GeV/), the upper left graph shows the distribution integrated over the full momentum range of this particular magnetic field setting for illustration purposes only. The solid lines depict the result of the combined fit to the background and to the peak at the kaon mass, the dashed lines show the background part only.
The cross sections are calculated from the number of kaons as
| (2) | |||||
with being the molar mass, being the density and being the thickness of the target material. denotes Avogadro’s constant and the number of projectiles impinging on the target.
The correction for the geometrical acceptance of the spectrometer and for the particle decay is calculated using a GEANT simulation. The simulated data sets are analyzed with the same analysis procedure as the experimental data. The correction is deduced from the ratio of particles found after the analysis to those initially simulated.
The total efficiency is calculated by multiplying the detector, the DAQ, and the tracking efficiencies described before as well as the trigger efficiency and the efficiency of the application of the selection criteria .
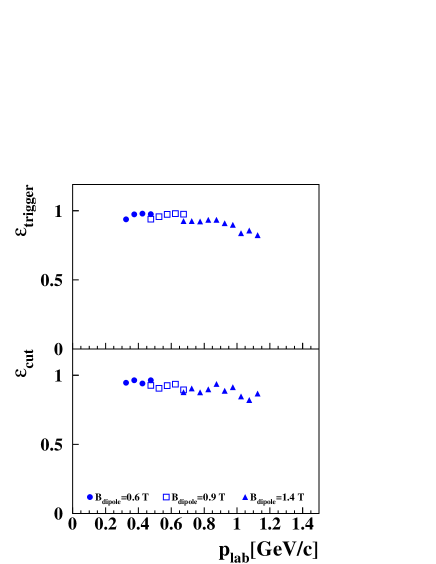
To determine the efficiency of the trigger system (which is based on particle velocities) pions and protons measured at magnetic fields scaled by the mass ratios or are used which then have the same velocities as kaons measured at the nominal fields. These pions and protons are called “TOF-simulated kaons” in the following. Using an open trigger condition that forces every event for which a particle enters the spectrometer to be recorded (“w/o TOF”) and keeping track of the decisions the TOF trigger would have taken, the efficiency of the TOF trigger can be determined. The resulting trigger efficiencies are larger than 90% but they depend on the particle momentum. The upper panel of Fig. 5 shows for Ni+Ni at GeV for the three magnetic field settings measured (, , and T).
The efficiency of the applied selection criteria as a function of is determined using the background-free measurements as described above. In some data sets the statistics of these settings was not sufficient. In these cases the efficiencies of the “geometrical cuts” were determined using GEANT simulations, the efficiency of the “velocity cut” was determined using the “TOF-simulated kaons”. This method has been validated by comparing its results to efficiencies calculated from real data in cases where this is possible. The resulting efficiencies range from 75% to 100%. For the example Ni+Ni at GeV they are depicted in the lower panel of Fig. 5.
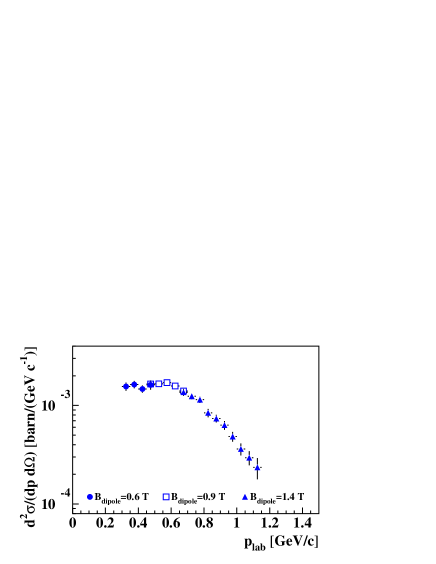
Figure 6 shows the resulting differential cross sections for K+ mesons in Ni+Ni collisions at GeV at according to Eq. (2) as a function of . This momentum distribution consists of data measured at three different magnetic field settings (, , and T) which are analyzed separately but overlap very well.
III Experimental Results
III.1 Inclusive Reactions
In this section the inclusive cross sections for the production of K+ and of K- mesons in C+C, in Ni+Ni and in Au+Au collisions are presented as a function of their laboratory momentum as well as of their energy and their emission angle in the center-of-momentum frame. Inclusive means that no centrality selection has been applied to the data, neither in the analysis nor implicitly by the experimental setup or the trigger. Let us recall that the trigger is generated by a time-of-flight signal in the spectrometer and that the multiplicity detector is not part of the trigger system. The determination of the functional dependencies of the production cross sections on and on allows for an extrapolation to phase space areas not covered by the experiment and for a determination of integrated production yields. All results of this section are summarized in Table 2. Throughout the figures of this paper we use a consistent color code for an easy distinction of the collision systems while of course keeping full descriptions for black-and-white printed versions: Results of Au+Au collisions appear in red, Ni+Ni in blue, and C+C in green.
Some of the data sets presented in this section are published here for the first time, some have already been published previously laue ; laue_epj ; menzel ; sturm . As slightly different procedures have been used in these publications to extrapolate and to integrate the data, we have recalculated the total production cross sections using one consistent procedure for all data sets. Earlier measurements with large errors are not taken into account misko ; Barth ; ahner .
III.1.1 Energy Distributions
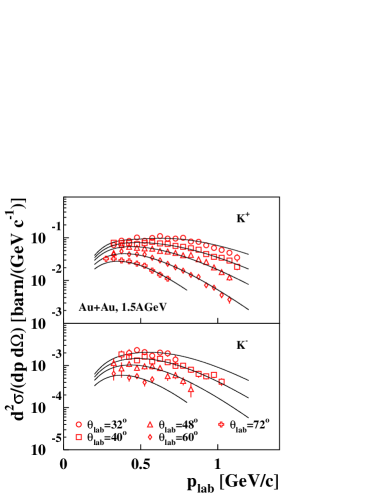
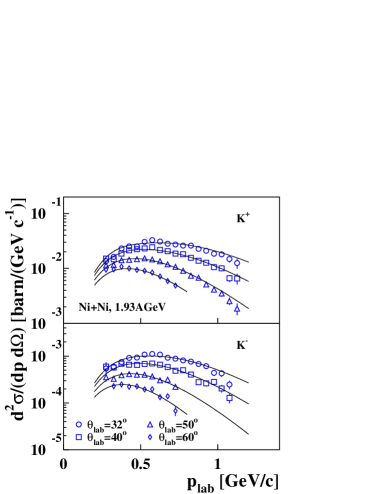
Figure 7 shows the inclusive production cross sections for K+ (upper panels) and for K- (lower panels) as a function of their momentum in the laboratory system for three different collision systems. The upper part of the figure depicts data taken in Au+Au collisions at a beam energy of GeV, the middle part those for Ni+Ni at GeV and the lower part those for C+C at GeV. To obtain a wide coverage of the phase space (see Fig. 2) measurements at several polar angle settings of the spectrometer in the laboratory have been performed. The lines in Fig. 7 are the results of simultaneous fits to all angular settings measured for a given system assuming a Maxwell-Boltzmann shaped dependence of the invariant production cross section on the center-of-momentum energy and a quadratic dependence on the cosine of the polar emission angle in the c.m. system . This procedure will be discussed in detail later.
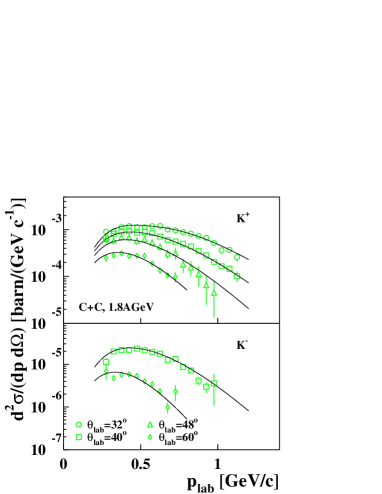
The necessity for using a non-isotropic distribution in is depicted in Fig. 8. Here the invariant cross sections are shown as a function of the kinetic energy in the c.m. system for Au+Au at GeV. Full symbols denote K+, open symbols K-. The data measured at a small angle in the laboratory system (K+: , K-: ) are depicted by circles, those measured at a large angle (K+: , K-: ) are represented by squares. The lines are Maxwell-Boltzmann distributions
| (3) |
fitted to the data with being the inverse slope parameter. For an isotropic emission in the c.m. system all spectra of a given particle type are expected to fall on top of each other regardless of the laboratory angle at which they have been measured. For K+ mesons this is clearly not the case pointing towards an anisotropic emission.
Since the distributions have been measured at fixed values of in the laboratory, data points at different particle energies correspond to different emission angles in the c.m. system. Therefore, this anisotropy might affect the determination of the inverse slope parameter of the energy spectra if data measured at a fixed would be transformed into the c.m. system and then fitted.
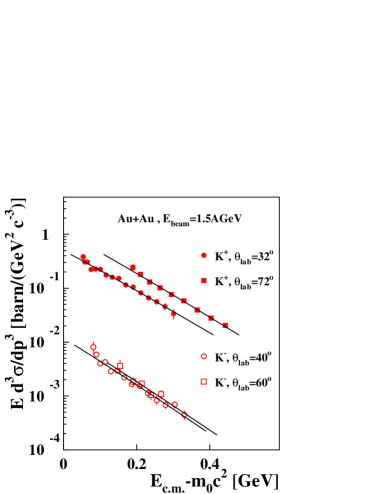
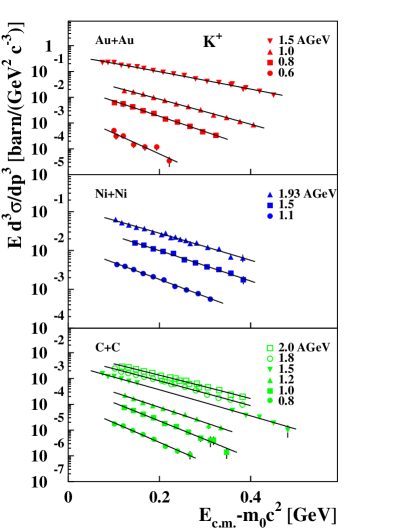
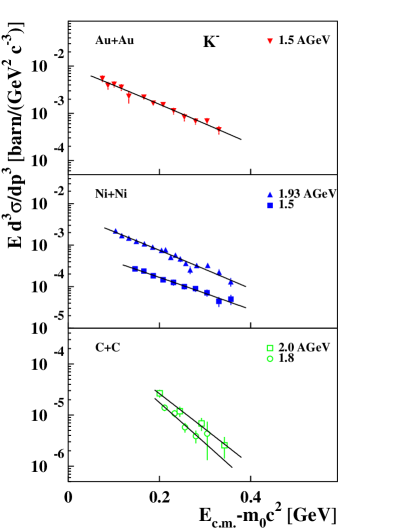
Therefore, we created “midrapidity distributions” by selecting data points within from measurements at various laboratory angles. The results are shown in Fig. 9, in the upper part for K+, in the lower part for K-. The figure summarizes the energy distributions of the K+ and of the K- production as measured in three different collision systems (Au+Au, Ni+Ni, C+C) at different incident energies ( GeV up to GeV). The measurements of K+ in Au+Au at GeV and of K- in C+C at GeV are not displayed in Fig. 9 since they do not cover midrapidity. The lines are fits to the data according to Eq. (3). The resulting inverse slope parameters are given in Table 2.
III.1.2 Polar Angle Distributions
To extract the angular emission pattern we assume that the dependence of the invariant cross sections on the polar angle and on the energy can be factorized. The energy dependence is determined at midrapidity by fitting Maxwell-Boltzmann distributions to the data as described above and shown in Fig. 9. As already mentioned, each of the data points measured at a given center-of-momentum energy and a laboratory angle corresponds to a different emission angle in the center-of-momentum frame.
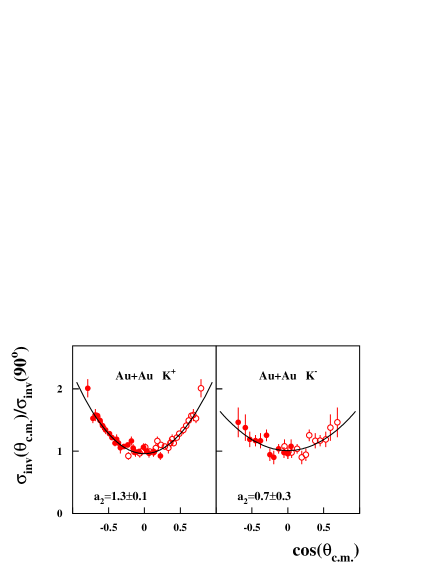
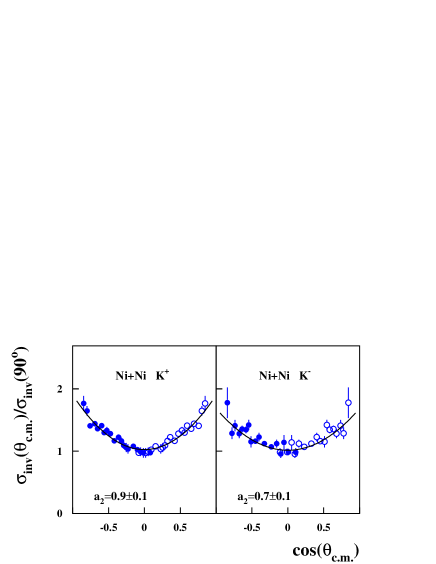
To disentangle the dependencies on the energy and on the polar emission angle we normalized each measured data point to the corresponding value . The latter is determined using the fits to “midrapidity distributions” according to Eq. (3). Assuming that the energy dependence of the kaon production is fully described by these midrapidity fits the results are the polar-angle emission pattern. They are shown in Fig. 10 as a function of , in the upper part for Au+Au at GeV and in the lower part for Ni+Ni at GeV. Full symbols are measured data points, open symbols have been reflected at since for mass-symmetric systems the polar angle distributions have to be symmetric around . Both systems show a forward-backward preference in the emission pattern which is more pronounced for K+ (left hand side) than for K- (right hand side).
To quantify the anisotropy, the distributions have been fitted with a quadratic dependence on
| (4) |
as depicted by the lines in the figure. This procedure has been applied to most data sets resulting in the values for as given in Table 2. In the cases for which only one laboratory angle has been measured the coverage in is rather small making the determination of impossible.
The super(sub)scripts ’div’ for the angular anisotropy and ’midrap’ for the inverse slope parameters are used for the two-step procedure presented above. Since the energy dependence of the kaon production is well described by a Maxwell-Boltzmann distribution and the polar angle distribution by a quadratic dependence on we additionally performed simultaneous fits to all momentum distributions measured at different laboratory angles for a given system using the combined function
| (5) |
with , and the normalization being the three variable parameters. The results of this procedure are denoted by the super(sub)script ’sf’. For Au+Au at GeV, Ni+Ni at GeV, and C+C at GeV the results of these fits are shown as solid lines in Fig. 7. The parameters obtained for all collision systems at all beam energies are given in Table 2. They agree very well with the values obtained by the two-step procedure denoted by and by . The combined fits in addition provide the correlations between the three parameters and thus the full error matrix which is necessary for calculating the errors of the integrated production cross sections. In those cases for which only one angle has been measured we take an interval for the polar angle anisotropy , denoted by square brackets in Table 2, with values set according to the trend at neighboring beam energies. This variation of yields additional errors on the inverse slope parameters as well as on the integrated cross sections as tagged by the superscript ’a2’ in Table 2.
III.1.3 Total Production Cross Sections
The results of the simultaneous fits have been used to extrapolate the data to phase-space regions not covered by the experiment and to calculate total production cross sections by integrating Eq. (5) over the full phase space. The extrapolation in contributes with about to the total production cross sections. The resulting total production cross sections for K+ and for K- for all collision systems and for all beam energies are summarized in Table 2. The error bars of the data points in the figures showing energy spectra and polar angle distributions contain the statistical uncertainties as well as point to point systematic errors due to the background subtraction. The overall systematic error of the absolute normalization is stated separately in Table 2 and is quadratically added to the statistical errors in all figures comparing cross section or multiplicities from different collision systems.
In several cases only one polar angle has been measured. As already described for the inverse slope parameters in the previous section, for each of those cases an interval for guided by the systematics given by neighboring beam energies has been used to determine an additional error on the integrated cross section denoted by the superscript ’a2’ in Table 2.
Part of the data has been published earlier with the methods to extrapolate the measured data to the full phase space being slightly different in the various publications. In this paper, we consistently apply one single method to extrapolate and integrate the data.
For C+C collisions and for K+ and for K- were published laue assuming the angular anisotropy for all incident energies to contribute with 20% to the total cross section independent of the incident energy which is equivalent to . Now we determine for each measurement separately. The differences between the values for and in Table 2 and those published in laue are nevertheless smaller then the statistical errors.
In the case of Ni+Ni, cross sections for the K+ and for the K- production at GeV have been published in menzel with the angular anisotropy being taken from a two-step procedure rather than from a simultaneous fit. Also in this case the differences between the results in Table 2 and the previously published values are smaller than the statistical errors.
For Au+Au , and have been published for K+ sturm . The results in Table 2 for , , and GeV differ less than the statistical errors from the published values. For K+ at GeV the results published in sturm are: mb, MeV and . They correspond to a low statistics measurement using a thicker target reducing the effective beam energy for the K+ production to GeV. This difference in effective energy accounts for a difference of about in cross section compared to the new high statistics experiment reported upon in this paper using a thinner target (with GeV). In addition in the experiment described in sturm the anisotropy in the polar angle emission pattern was underestimated due to a reduced coverage in accounting for an additional difference in the cross section.
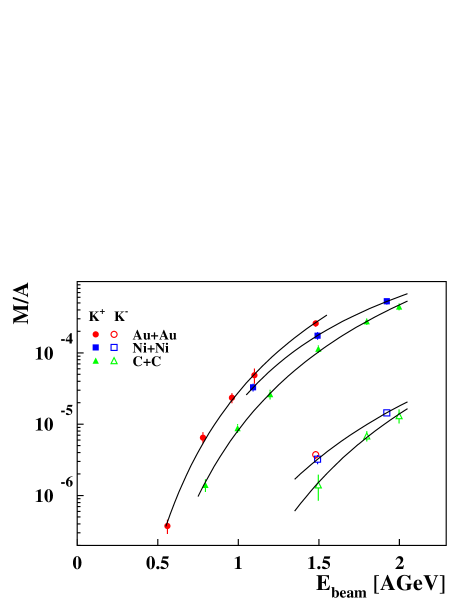
To calculate particle multiplicities the integrated production cross sections (see Table 2) need to be divided by the total reaction cross section which cannot be determined easily as the particle-multiplicity distribution measured with a multiplicity trigger condition has a cutoff at low multiplicities (see also Sect. III.2). Therefore, we determine the reaction cross sections using Glauber calculations glauber resulting in barn, barn, and barn. Figure 11 summarizes the multiplicities of K+ and of K- mesons as a function of the beam energy as determined in inclusive reactions (Au+Au, Ni+Ni, C+C) and normalized to the mass number of the respective colliding nuclei. Both particle species exhibit strongly rising excitation functions as expected due to the proximity of the thresholds in binary NN collisions (1.58 GeV for K+, 2.5 GeV for K-). The solid lines reflect fits according to the formula Kolo
| (6) |
with . The variable parameters in the fit are , and . As well for K+ as for K- the multiplicities per mass number increase with system size from C+C to Au+Au at the same incident energy.
| reaction | ||||||||
| [ GeV] | [∘] | [mb] | [MeV] | [MeV] | ||||
| K+ | ||||||||
| C+C | 0.8 | 44 | —— | |||||
| 1.0 | 44,54,70 | |||||||
| 1.2 | 40 | —— | ||||||
| 1.5 | 32,48 | |||||||
| 1.8 | 32,40,48,60 | |||||||
| 2.0 | 32,40 | |||||||
| Ni+Ni | 1.1 | 40 | —— | |||||
| 1.5 | 40 | —— | ||||||
| 1.93 | 32,40,50,60 | |||||||
| Au+Au | 0.6 | 50 | —— | |||||
| 0.8 | 44,84 | |||||||
| 1.0 | 44,84 | |||||||
| 1.135 | 56 | —— | —— | |||||
| 1.5 | 32,40,48,60,72 | |||||||
| K- | ||||||||
| C+C | 1.5 | 40 | —— | —— | ||||
| 1.8 | 40,60 | —— | ||||||
| 2.0 | 40 | —— | ||||||
| Ni+Ni | 1.5 | 40 | —— | |||||
| 1.93 | 32,40,50,60 | |||||||
| Au+Au | 1.5 | 32,40,48,60 |
III.2 Centrality Dependence
The collision centrality was derived from the multiplicity of charged particles measured in the Large-Angle Hodoscope (). Figure 12 shows the respective multiplicity distributions for Au+Au at GeV (upper panel) and for Ni+Ni at GeV (lower panel) measured with a multiplicity trigger. In order to study the centrality dependence of the K+ and of the K- production the data were grouped into five centrality bins both for Ni+Ni at and at GeV as well as for Au+Au at GeV. These bins are also depicted in Fig. 12.

The distributions have been normalized to the beam intensity, to the target thickness and to the efficiency of the DAQ system so that the area between the respective bin boundaries represents the corresponding fraction of the total reaction cross sections for a given bin. Very peripheral collisions in the first centrality bin might be missed by the multiplicity trigger, however, kaons from such peripheral events are measured since they are triggered by the time-of-flight trigger in the spectrometer. The fraction of for this most peripheral bin is determined by taking the inclusive total reaction cross section from a Glauber calculation glauber and subtracting the sum of the experimentally measured values of the four other centrality bins. For Au+Au, the five bins correspond to , , , , and of from central to peripheral collisions, for Ni+Ni to , , , , and of . The corresponding mean numbers of participating nucleons have as well been calculated using Glauber calculations.
III.2.1 Multiplicities
The multiplicity of a particle species for each centrality bin is defined as with being the production cross section for the respective particle species and being the fraction of the total reaction cross-section for the respective bin. Figure 13 presents the multiplicities per number of participating nucleons as a function of at a beam energy of GeV for Au+Au and for Ni+Ni. To calculate these multiplicities only data measured at have been used since for Ni+Ni this is the only laboratory angle measured at that beam energy. The K+ are shown in the upper panel, the K- in the middle panel and the pions in the lower panel. Since neutral particles can not be detected by the spectrometer, the total pion multiplicity has been calculated as . In all panels full symbols denote Au+Au, open symbols Ni+Ni.
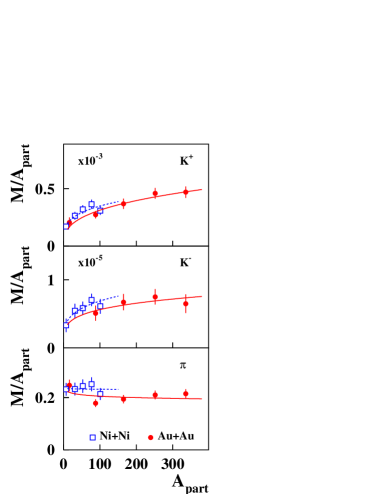
The lines in Fig. 13 are functions fitted to the data separately for Au+Au (continuous lines) and for Ni+Ni (dashed lines). For both systems the pions show a linear dependence of on with close to 1 (, ) which means that the number of pions produced is proportional to the number of nucleons participating in the reaction. For K+ on the other hand the multiplicities rise stronger then linear with (, ). The same holds for K- (, ).
III.2.2 Energy Distributions
Although the multiplicities of K+ and of K- mesons per in Au+Au and Ni+Ni show the same rise with and even have the same absolute values, significant differences between K+ and K- have been found AF .
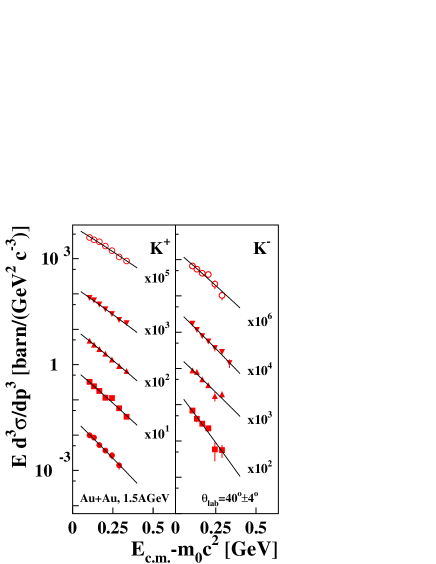
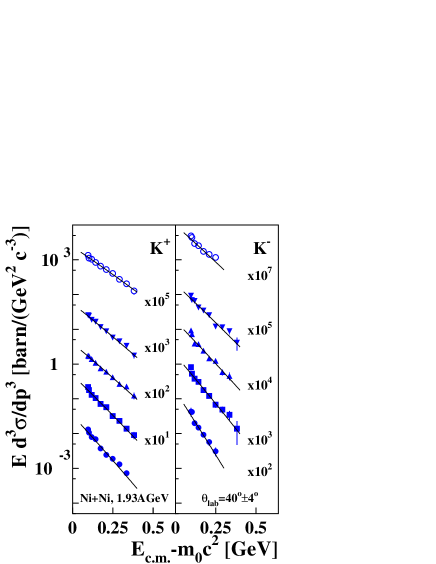
Figure 14 shows the invariant cross sections for K+ and for K- mesons measured close to midrapidity () as a function of the kinetic energy in the center-of-momentum system, in the upper part for Au+Au collisions at GeV, in the lower part for Ni+Ni at GeV. The left panel of each graph depicts K+, the right panel K-. The uppermost distributions correspond to the most central reactions, the subsequent bins are shown from the top to the bottom of each graph with decreasing centrality. The solid lines represent Maxwell-Boltzmann distributions according to Eq. (3) fitted to the data.
The resulting inverse slope parameters for K+ and K- mesons are shown in Fig. 15 as a function of . The upper part displays Au+Au and Ni+Ni collisions at 1.5 GeV, the lower part Ni+Ni collisions at 1.93 GeV.
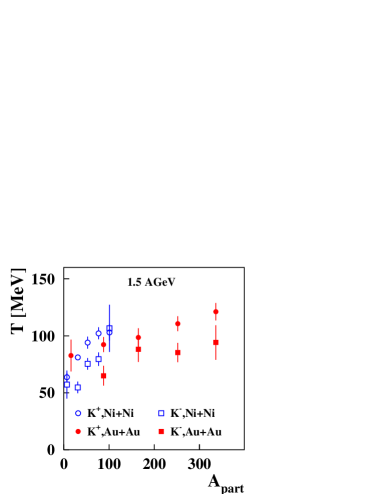
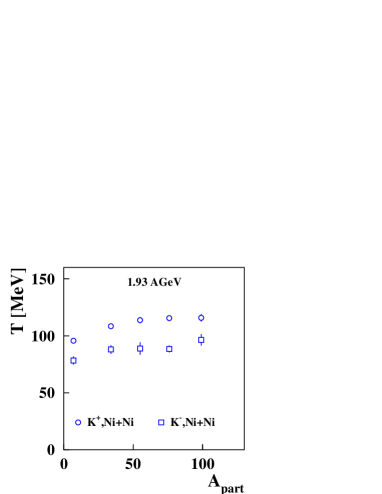
In Fig. 15 two distinct features can be observed:
(i) The inverse slope parameters increase with centrality for both particle species for both collision systems and both beam energies.
(ii) The inverse slope parameters of the K+ spectra are larger than those of the K- spectra for both systems, at both energies and for all centralities. This is discussed in detail in Sect. IV.2.
III.2.3 Polar Angle Distributions
Another observable showing a distinct difference between K+ and K- is their polar angle emission pattern. Deviations of the angular distributions from isotropy can be studied by the ratio / as a function of as demonstrated in Sect. III A. Here, are the invariant particle production cross sections measured at polar angles in the center-of-momentum frame and is deduced from Maxwell-Boltzmann fits to the midrapidity spectra. These spectra have been obtained for the centrality-dependent data in the same way as described for the inclusive data in Sect. III.1. For an isotropic distribution this ratio would be constant and identical to 1.
Due to limited statistics we divided the data sets into two centrality bins only: non-central collisions ( of for Ni+Ni, of for Au+Au) and near-central collisions ( of for Ni+Ni, of for Au+Au).
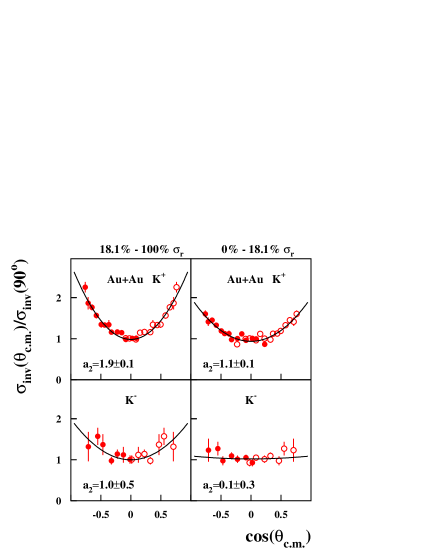
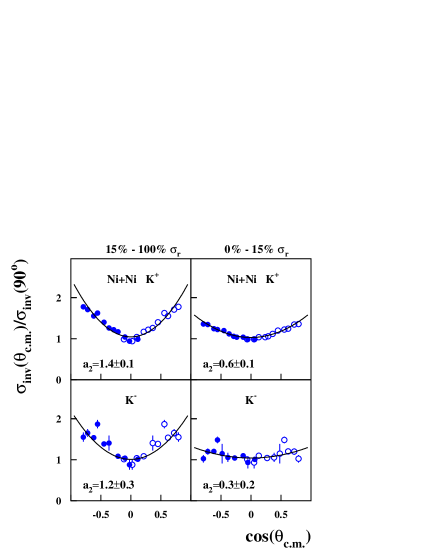
Figure 16 displays the polar angle distributions for Au+Au at GeV (upper part) and for Ni+Ni at GeV (lower part). The upper panels of both parts of the figure show K+, the lower panels K-, both for non-central (left) and near-central collisions (right).
As for the inclusive data the distributions have been fitted with a quadratic dependence on according to Eq. (4) to quantify the anisotropy. The solid lines and the values for the parameter in Fig. 16 represent the results of these fits. For both systems the K- mesons exhibit a nearly isotropic emission pattern in near central collisions whereas the emission of the K+ mesons is forward-backward peaked.
IV Discussion
In this section we discuss the observed centrality and system-size dependences of the K+ and of the K- multiplicities in the context of the production mechanisms of these particles, we address the dynamics of the emission of the two particle species in terms of energy spectra and polar angle distributions, and we extract information on the stiffness of the nuclear equation of state by comparing the K+ multiplicities from different collision systems to recent transport model calculations.
IV.1 The Connection between the and the Production
As presented in Sect. III.2 the production yields of K+ and of K- mesons exhibit a very similar dependence on the collision centrality. Figure 13 shows that the multiplicities of both kaon species exhibit the same rise with the number of participating nucleons despite the fact that the thresholds for the production of the two particles species in binary NN-collisions are very different. This is observed in Au+Au as well as in Ni+Ni collisions.
Figure 17 shows the multiplicities of K+ mesons from inclusive reactions as a function of the system size at several incident energies as well as those of K- mesons at GeV. To interpolate between measured data points in case of slight differences in the effective beam energies due to different energy losses in the respective targets the fits to the excitation functions according to Eq. (6) as shown in Fig. 11 have been used. The lines in Fig. 17 are functions fitted to the data with the resulting values for given in the figure. Please note: To distinguish the two approaches, we use the exponent to quantify the rise of the multiplicities from inclusive reactions as a function of the system size and the exponent for the rise with the number of participating nucleons as determined from the analysis of the centrality dependence in Sect. III.2.
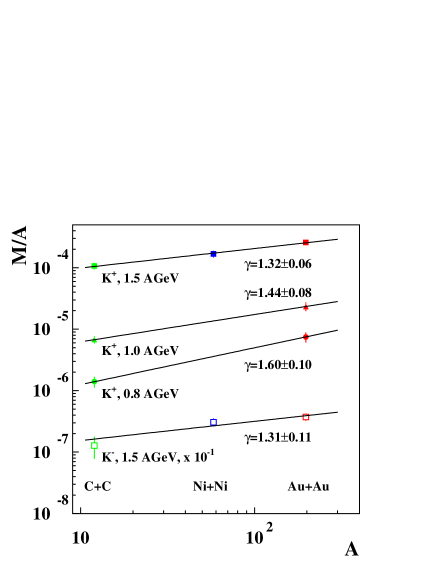
For K+ at GeV is extracted which is almost identical to the value of as determined from the dependence of the multiplicity on for the K+ production in Au+Au at the same energy as shown in Fig. 13. As can be seen in Fig. 17 increases towards lower incident energies. This is in good agreement with the assumption of multiple collisions being needed to accumulate the necessary energy for the K+ production at beam energies below the threshold in binary nucleon-nucleon collisions. The lower the incident energy the more collisions seem to be needed. Since the densities reached in heavy reaction systems are significantly larger than in light systems the difference between the K+ yield in C+C and Au+Au increases with decreasing beam energy. The same holds for the differences between peripheral and central collisions in which different levels of baryon densities are created. The similarity between the dependencies on and on is therefore not astonishing. These observations will be used in Sect. IV.3 to extract the stiffness of the nuclear equation of state.
The yield of the K- mesons as a function of the system size increases with at GeV . This is roughly the same rise as for the dependence on in Au+Au which was determined to be (see Sect. III.2). As in the case of the dependence the rises of the K- and of the K+ multiplicities with are rather similar although the K- production happens much farther below its respective nucleon-nucleon threshold ( GeV) than the K+ production ( GeV). In the case of the analysis of the centrality dependence at GeV not only the same rise of the K+ and of the K- multiplicities with centrality was observed but also a rough agreement between the data measured in Au+Au and Ni+Ni (see Fig. 13).
The similar rise with yields a rather constant K-/K+ ratio as a function of as can be seen in Fig. 18 for three cases.
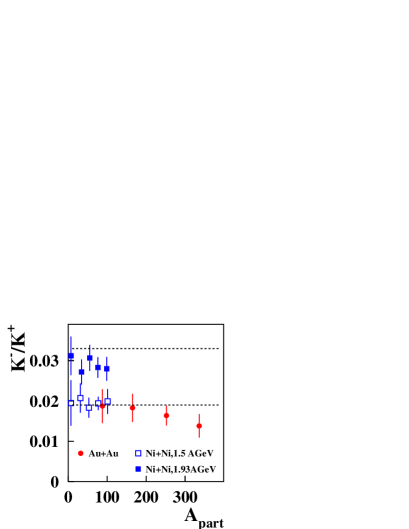
At GeV the ratios for Au+Au and for Ni+Ni are the same. The dashed lines denote the K-/K+ ratios as calculated within the statistical model CLE99 .
The similar rise of both, K+ and K-, as a function of the collision centrality as shown in Fig. 13 and as a function of the system size (see Fig. 17) suggests that the production mechanisms of the two kaon species might be linked. As already suggested in ko84 and supported by transport model calculations Hart03 ; cass_brat , the K- in heavy-ion collisions at SIS energies are mainly produced via the strangeness-exchange reaction , with Y denoting the hyperons and . On the other hand, strangeness has to be conserved when producing these hyperons and the energetically most favorable way is to produce them together with K+ (and K0) mesons (associate production). Thus the production of K+ and of K- mesons is coupled via the strangeness-exchange reaction and the K- inherit the same dependence on the system size and on the collision centrality. In Cl04 it was argued that the strangeness-exchange channel reaches chemical equilibrium resulting in the K-/K+ ratio to be proportional to the pion density and that such a proportionality was observed for beam energies lower than approximately GeV as reached at the SIS and at the AGS (Alternating Gradient Synchrotron) accelerators at the GSI and at the Brookhaven National Laboratory (BNL).
IV.2 The Dynamics of the and of the Emission
The strangeness exchange reaction couples the yields of the K- and of the K+ mesons as discussed in Sect. IV.1. On the other hand, K+ and K- show rather distinct differences in observables like energy spectra or polar angle distributions which are sensitive to the dynamics of the particle emission.
Figure 19 presents the inverse slope parameters (see Table 2) as determined by the simultaneous fits to the momentum distributions of the production cross sections. They are shown as a function of the incident energy for inclusive C+C, Ni+Ni and Au+Au reactions, on the left hand side for K+, on the right hand side for K-. The inverse slope parameters are higher for heavier systems and in case of the K+ they rise with increasing incident energies. They are always higher for K+ than for K- mesons at the same beam energy.
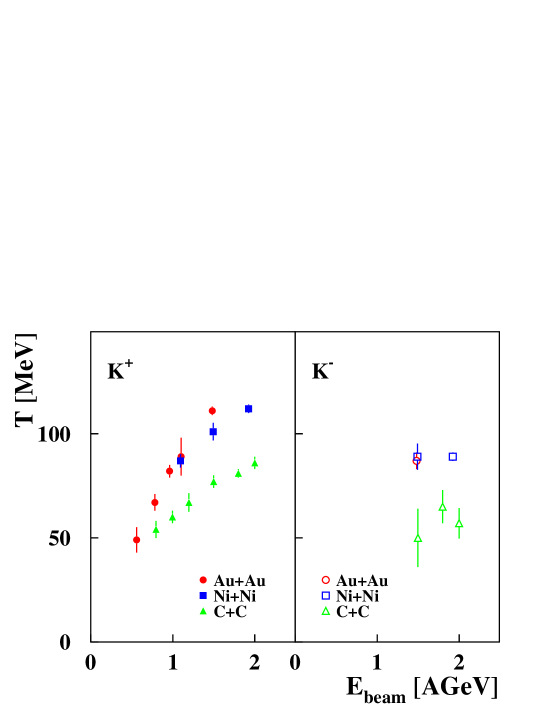
The same trend is as well observed as a function of the collision centrality as shown in Fig. 15 in Sect. III.2. Figure 20 shows the correlation between the inverse slope parameters of the K- mesons and those of the K+ mesons measured in the same collision system and at the same incident energy. For C+C the results from inclusive collisions at , , and GeV are shown. For Ni+Ni at and at GeV as well as for Au+Au at GeV the results of the centrality-dependent analyses are shown.
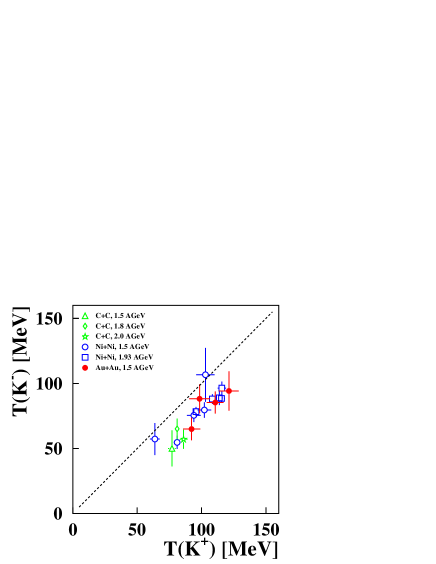
The dashed line indicates equal inverse slope parameters for K- and for K+. The data clearly deviate from this line. The inverse slope parameters of the K+ are about 15 - 25 MeV higher than those of the K-, independent of the collision centrality, of the collision system and of the beam energy (within the measured energy range from to GeV).
While the measured K-/K+ ratio agrees well with statistical-model calculations CLE99 , the different values for the inverse slope parameters for K+ and for K- clearly contradict the assumption of a simultaneous freeze out of both kaon species. For K- mesons the chemical and the kinetic freeze out coincide as nearly no elastic scattering occurs due to the strong absorption. If the kinetic decoupling of the K+ is at a higher “temperature” as the chemical freeze out of the K-, they cannot have a unique chemical decoupling.
Different inverse slope parameters for K+ and for K- mesons have been proposed to result from the influence of the repulsive and of the attractive KN potentials in early Boltzmann-Uehling-Uhlenbeck (BUU) and in Relativistic-Quantum-Molecular-Dynamics (RQMD) transport-model calculations cass_brat ; li_brown ; wang . The experimentally observed difference between the inverse slope parameters of K+ and of K- mesons is about the same for all reaction systems from C+C to Au+Au collisions as well as for all collision centralities and hence for very different densities inside the collision zone. The KN potentials on the other hand are predicted to have a strong dependence on the density schaf . Yet, the data do not show such a dependence. This is a hint, that other effects besides the KN potentials might as well be important for the explanation of the different inverse slope parameters of the K+ and of the K- mesons.
Comparisons of data from the KaoS-Collaboration to various transport-model calculations have been shown in several publications. Some of the more recent comparisons can e.g. be found in Fuchs_Rev ; hart_habil ; Mishra ; cas_tol ; larionov and in the references therein. Another comprehensive report is in preparation PR_Nantes . A comparison of the various transport models can be found in Trento . Here, we concentrate on the description of spectra and angular distribution and their sensitivity to in-medium modifications of kaons in dense nuclear matter. This comparison will be short as further developments are expected from the theoretical side. Most transport models use parameterizations for the KN-potentials that result in density-dependent K+ and K- selfenergies (see schaf for examples). A more recent concept to describe the in-medium properties via spectral functions of the K- by Lutz et al. lutz has not been implemented into transport models so far. Another approach using coupled-channel G-matrix calculations laura has been used for the K-N interaction in the Hadron String Dynamics Model (HSD) cas_tol .
In the following we compare energy distributions and polar angle distributions to results of calculations obtained with the Isospin Quantum Molecular Dynamics model (IQMD) hart_habil ; IQMD and with the HSD model cas_tol . These calculations have been performed by the authors of the respective codes analyzing the results within the experimental acceptance of the KaoS measurements.
Figure 21 displays the invariant cross sections for K+ and for K- mesons as a function of their kinetic energy for Au+Au collisions at 1.5 GeV. In the upper part the comparison to IQMD calculations is shown, in the lower part the comparison to HSD results.

In both calculations the energy distributions of the K+ are slightly steeper than for the measured data. The yields favor the option with a repulsive K+N potential. For the K-, the slopes of both model calculations without an in-medium K-N interaction agree rather well with the data. The comparison of the absolute yields, however, does not allow to draw a conclusion as the two calculations differ strongly. The discrepancy is only seen for K-, while the results of the two transport models agree rather well with each other for the K+.
As has been demonstrated, for the experimental data the inverse slope parameters of the K+ are significantly larger than those of the K-. This trend is seen as well in the transport model calculations, rather pronounced in those calculations including in-medium KN interactions but already visible without them.
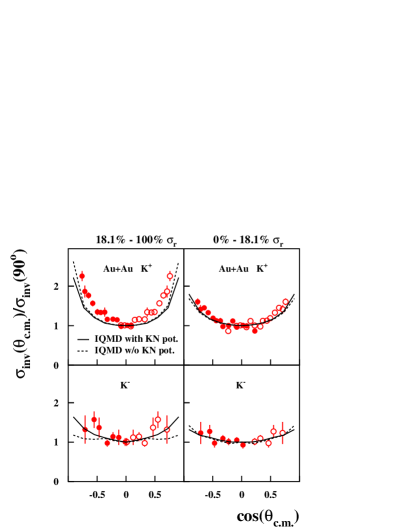
Figure 22 compares the angular emission patterns of K+ and of K- in Au+Au at GeV, normalized to the yield at , to the results of the transport models IQMD and HSD. For the K- mesons from near-central collisions ( - ) a rather flat distribution is observed, whereas the K+ are preferentially emitted to forward and backward angles. The measured data are rather well described by both models. However, as can be seen in Fig. 22 this observable is hardly sensitive to the choice of the KN in-medium interaction.

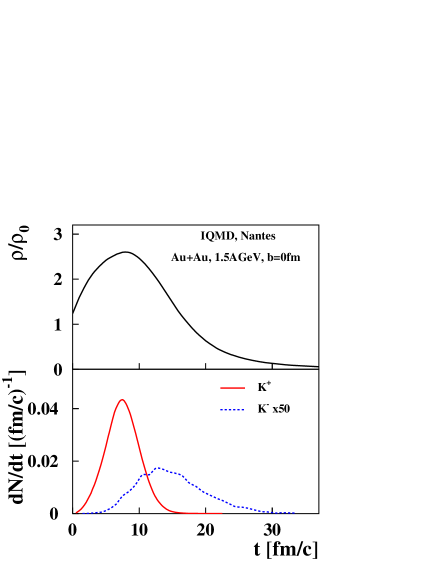
The differences in the inverse slope parameters and in the polar angle distributions of the K+ and of the K- mesons may as well be influenced by different emission times of the two particle species. This is demonstrated in Fig. 23 showing the results of IQMD calculations. The upper panel shows the density reached in the collision zone normalized to normal nuclear matter density as a function of time. The lower panel shows the rate of emitted K+ and K- mesons as a function of their creation time. It can clearly be seen that according to this transport-model calculation those K- leaving the reaction zone are created at a rather late stage of the reaction, significantly later than the K+ which are mainly created during the high-density phase. This difference in emission times is caused by the strangeness-exchange reaction reabsorbing most of the K- produced during the high-density phase. According to IQMD the primary production of both, K+ and K- mesons, is isotropic. As will be discussed in detail in PR_Nantes the polar angle anisotropy of the K+ is mainly caused by rescattering. The K- on the contrary are emitted at a late stage of the reaction when the spectator matter has moved away and can not cause a significant anisotropy.
IV.3 The Nuclear Equation of State
Positively charged kaons are expected to carry information on the high density-phase of the heavy-ion collision due to two reasons:
i) The K+ production occurs via multiple collisions e.g. via processes like followed by a subsequent interaction of the resonance like . These multi-step processes occur predominantly at higher densities Hart_NP94 ; Fuchs_Rev ; hart_habil .
ii) The rather large mean free path of the K+ ( fm at normal nuclear density ) reduces the probability of further inelastic interactions prior to their emission. As a result of the K+ production mechanism their yields are sensitive to the density reached in the collision which is related to the stiffness of the nuclear equation of state (EoS) as parameterized by the compression modulus defined as
| (7) |
which quantifies the curvature of at normal nuclear density .
Figure 11 in Sect. III.1 summarizes the multiplicities of K+ mesons as determined in inclusive reactions of Au+Au, Ni+Ni, and C+C and normalized to the mass number of the respective colliding nuclei as a function of the beam energy. The K+ excitation functions for all three collision systems rise strongly as expected due to the proximity of the threshold in NN collisions ( GeV). The multiplicities per are the higher the heavier the collision system is. This reflects that the K+ mesons are predominantly produced in multiple collisions which are more likely to occur the higher the density is in the reaction.
Early transport-model calculations predicted that the K+ yield in Au+Au collisions would be enhanced by a factor of about 2 if a soft rather than a hard nuclear equation of state is assumed aich ; li_ko . Recent calculations take into account modifications of the kaon properties in the dense nuclear medium leading to a repulsive potential which depends on the baryonic density schaf and which leads to a reduction of the calculated K+ yields. To disentangle these two competing effects we use the ratio of two K+ excitation functions sturm , one from C+C and one from Au+Au. The maximum baryonic density reached in Au+Au reactions is about 2 – 3 times normal nuclear matter density while the increase in density in C+C collisions is significantly less pronounced. Moreover, the maximum baryonic density reached in Au+Au reactions depends on the compression modulus of nuclear matter aichelin ; li_ko whereas in C+C collisions this dependence is rather weak fuchs . Hence, the ratio of the K+ multiplicity per nucleon in Au+Au to the one in C+C is expected to be sensitive to the compression modulus . Furthermore, it provides the advantage that systematic uncertainties within the experimental data are partly cancelled. This ratio in addition has turned out to be hardly affected by input quantities of the transport-model calculations which are less well known, like cross sections of individual reaction channels, the strength of the KN potentials, or the lifetime of the resonance, as has been systematically studied in Hart_eos .
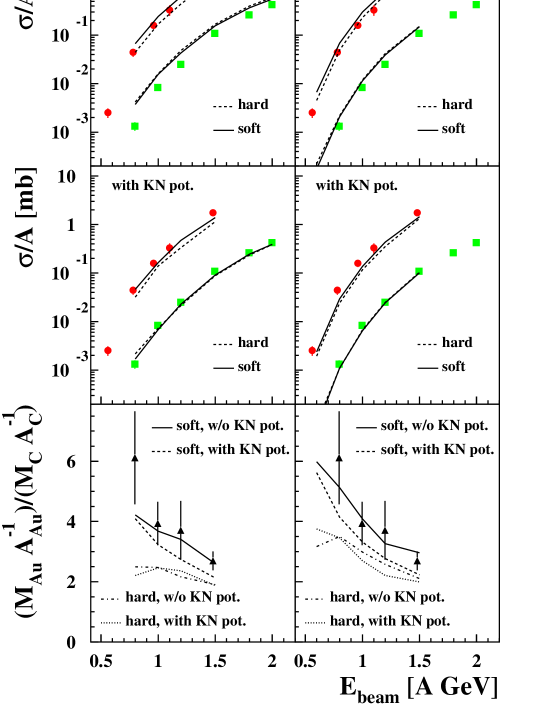
The upper and the middle panels of Fig. 24 show a detailed comparison of the K+ excitation functions ( as a function of ) for Au+Au and for C+C collisions with transport-model calculations. On the left hand side of the figure the data are compared to results from RQMD calculations fuchs . On the right hand side a comparison to results from IQMD Hart_eos calculations is presented. The upper panels show calculations without KN potentials, the middle panels those with KN potentials. Solid lines denote calculations with a soft nuclear equation of state ( MeV), dashed lines denote a hard EoS ( MeV).
The lower panels of Fig. 24 show the double ratio as a function of the beam energy. Since due to the different energy loss in the Au and in the C target the effective energies for the K+ production are slightly different, the fits as displayed in Fig. 11 were used for interpolation. The error bars contain the statistical uncertainties as well as those systematic errors that do not cancel by calculating the double ratio (approximately 6%), added quadratically. The double ratios as determined from the various transport-model calculations are shown as well. Only the calculations using a soft EoS are in agreement with the data.
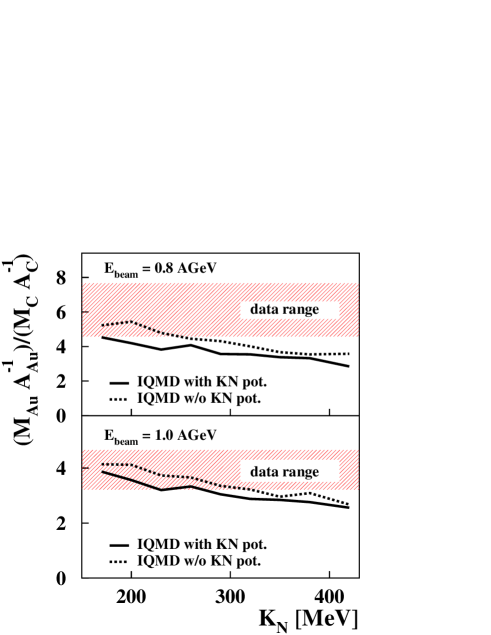
A reliable error estimate for the compression modulus strongly depends on the transport model calculations and their input. A detailed study of this topic will be subject of a theory publication PR_Nantes . The sensitivity of the double ratio to the stiffness of the EoS within the standard version of IQMD is shown in Fig. 25. It compares the measured double ratio at 0.8 and 1.0 GeV (shown as red bands) to results of IQMD calculations as a function of , both with and without KN potentials. The figure allows to establish upper limits for , being 180 MeV (at 0.8 GeV) and 240 MeV (at 1.0 GeV) assuming a KN potential. Higher limits are obtained without KN potential resulting in 240 MeV (at 0.8 GeV) and 315 MeV (at 1.0 GeV).
In Ref. schmah a detailed comparison of the K+ production in the mass-asymmetric collision system C+Au as well as in Ni+Ni, both measured at the Kaon Spectrometer, with RQMD calculations is presented. Although the mean number of nucleons participating in the reaction is rather similar in both cases, the densities reached are significantly different. The compression in C+Au hardly exceeds the values obtained in C+C and therefore the K+ yield in the calculations does not show a dependence on the stiffness of the EoS. For Ni+Ni the compression is significantly higher and the difference in the calculated yields is about . Again, the RQMD calculation for MeV is in good agreement with the data.
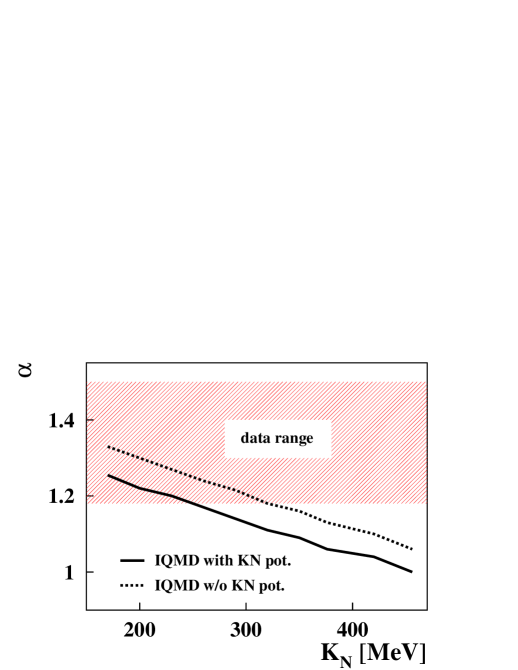
In Ref. Hart_eos the centrality dependence of the K+ production has been suggested as a further observable to extract the stiffness of the nuclear EoS from heavy-ion collisions. As shown in Fig. 13 the K+ multiplicity in Au+Au at GeV rises stronger than linear with the number of participating nucleons . This is due to the production via multiple collisions which is needed to accumulate the necessary energy and due to the dependence of the number of collisions on the density reached in the reaction zone. In Sect. III.2 this rise has been quantified by a fit to the data of the form with . Figure 26 compares this value (shaded area) to results of IQMD transport-model calculations on the dependence of on the compression modulus Hart_eos ; PR_Nantes . Only values for less than MeV are compatible with the measured data assuming a KN potential, and MeV for the case without a KN potential.
We would like to stress that two independent observables, the centrality dependence of the K+ yields, shown in Figs. 13 and 26, as well as the system-size dependence presented in Figs. 17 and 24, yield very similar results on the compressibility of nuclear matter when compared to transport-model calculations. Both observables support a soft nuclear EoS within the density regime explored by heavy-ion reactions at beam energies between and GeV.
V Summary
In this paper we have presented a comprehensive review of the production of charged kaons in heavy-ion collisions at incident energies ( to GeV) below and at the respective thresholds in NN collisions as measured with the Kaon Spectrometer KaoS at GSI. This subject has been systematically studied by analyzing total production cross sections, energy distributions and polar angle distributions as a function of the size of the collision system, of the incident energy, and of the collision centrality. The key observations and trends can be summarized as follows:
-
•
The multiplicities of both, K+ and K- mesons, per mass number of the collision system are higher in heavy collision systems than in light systems. This difference increases with decreasing beam energy.
-
•
The multiplicities per number of participating nucleons of K+ and of K- mesons within the same collision system rise stronger than linearly with whereas the pion multiplicity is proportional to . Moreover the rise is rather similar for K+ and for K- although the respective NN-thresholds for their production are significantly different.
-
•
The K-/K+ ratio is almost constant as a function of the collision centrality. At GeV this ratio is the same for Au+Au and for Ni+Ni collisions.
-
•
The inverse slope parameters of the energy distributions of K+ and of K- mesons are higher in heavy than in light collision systems.
-
•
The inverse slope parameters of the energy distributions of K+ mesons are about to MeV higher than those of the K- distributions. This is observed for all collision systems and for all centralities.
-
•
The polar angle distributions exhibit a forward-backward rise which is more pronounced for K+ than for K- mesons. K- mesons produced in central collisions are emitted almost isotropically.
From the systematics of these experimental results and from detailed comparisons to transport model calculations the following conclusions on the properties of dense nuclear matter as created in heavy-ion collisions and on the production mechanisms of K+ and of K- mesons can be drawn:
-
•
The K- and the K+ yields are coupled by strangeness exchange: Despite their significantly different thresholds in binary NN collisions the multiplicities of K+ and of K- mesons show the same dependence on the collision centrality. They are even similar for different collision systems. This can be explained by the K- being predominantly produced via strangeness exchange from hyperons which on the other hand are created together with the K+ mesons. Strangeness exchange is predicted to be the main contribution to the K- production in heavy-ion collisions at SIS energies by transport model calculations as well.
-
•
K+ and K- mesons exhibit different freeze-out conditions: Transport-model calculations predict different emission times for K+ and for K- mesons as a consequence of the strangeness-exchange reaction. The K- are continuously produced and re-absorbed and finally leave the reaction zone much later than the K+ mesons. This and the kinematics of the strangeness-exchange process manifests itself in an isotropic emission of the K- in central collisions and by systematically lower inverse slope parameters of the K- energy distributions compared to K+ .
-
•
The nuclear equation of state is soft: The increase of with the size of the collision system points towards a dependence of the K+ production on the density reached in the collision. The ratio of the K+ multiplicities in Au+Au and C+C as a function of the incident energy allows to extract the compression modulus of nuclear matter by comparing to transport-model calculations. Only calculations using a soft nuclear equation-of-state ( MeV) can describe the data. This conclusion is rather insensitive to the various input parameters of such calculations. A soft nuclear equation of state is further supported by comparing the centrality dependence of the K+ multiplicities in Au+Au collisions to transport model calculations.
Our results demonstrate the importance of the strangeness-exchange reaction for the production and propagation of negatively charged kaons in heavy-ion collisions at incident energies from to GeV, on the one hand coupling their yield to the K+ -production, on the other hand causing a rather late emission of the K-. The production of positively charged kaons itself is strongly linked to the high-density phase of a heavy-ion collision allowing to determine that the equation-of-state of nuclear matter is soft within the density regime explored by heavy-ion collisions between and GeV.
Acknowledgements
We would like to thank all our colleagues with whom we had numerous fruitful discussions over the past years. We explicitly acknowledge the intense collaboration with the various theory groups providing the results of the transport model calculations, especially J. Aichelin, E. Bratkovskaya, W. Cassing, C. Fuchs, and C. Hartnack. This work was supported by the German Federal Government (BMBF), by the Polish Committee of Scientific Research (No. 2P3B11515) and by the GSI fund for Universities.
References
- (1) H. A. Bethe, Rev. Mod. Phys. 62 (1990) 801; J. M. Lattimer, F. D. Swesty, Nucl. Phys. A 535 (1991) 331; H. Shen, H. Toki, K. Oyamatsu, K. Sumiyoshi, Nucl. Phys. A 637 (1998) 435.
- (2) C. Hartnack, J. Jaenicke, L. Sehn, H. Stöcker, J. Aichelin, Nucl. Phys. A 580 (1994) 643.
- (3) C. Fuchs, Prog. Part. Nucl. Phys. 56 (2006) 1.
- (4) C. Hartnack, Thesis of Habilitation, nucl-th/0507002.
- (5) C. M. Ko, Phys. Lett. B 138 (1984) 361.
- (6) J. Aichelin and C. M. Ko, Phys. Rev. Lett. 55 (1985) 2661.
- (7) C. Sturm et al. (KaoS Collaboration), Phys. Rev. Lett. 86 (2001) 39.
- (8) C. Fuchs, A. Faessler, E. Zabrodin, Y. M. Zheng, Phys. Rev. Lett. 86 (2001) 1974.
- (9) C. Hartnack, H. Oeschler, J. Aichelin, Phys. Rev. Lett. 96 (2006) 012302.
- (10) A. Förster, F. Uhlig et al. (KaoS Collaboration), Phys. Rev. Lett. 91 (2003) 152301.
- (11) H. Oeschler, J. Phys. G: Nucl. Part. Phys. 27 (2001) 257; A. Förster et al., J. Phys. G: Nucl. Part. Phys. 28 (2002) 20111.
- (12) C. Hartnack, H. Oeschler, J. Aichelin, Phys. Rev. Lett. 90 (2003) 102301; Phys. Rev. Lett. 93 (2004) 149903.
- (13) D. B. Kaplan, A. E. Nelson, Phys. Lett. B 175 (1986) 57.
- (14) G. E. Brown, C. H. Lee, M. Rho, V. Thorsson, Nucl. Phys. A 567 (1994) 937.
- (15) T. Waas, N. Kaiser, W. Weise, Phys. Lett. B 379 (1996) 34.
- (16) J. Schaffner, J. Bondorf, I. N. Mishustin, Nucl. Phys. A 625 (1997) 325.
- (17) M. Lutz, Phys. Lett. B 426 (1998) 12.
- (18) L. Tolós, A. Ramos, A. Polls, T. T. S. Kuo, Nucl. Phys. A 690 (2001) 547; L. Tolós, A. Ramos, A. Polls, Phys. Rev. C 65 (2002) 054907.
- (19) F. Laue, C. Sturm et al. (KaoS Collaboration), Phys. Rev. Lett. 82 (1999) 1640.
- (20) M. Menzel et al. (KaoS Collaboration), Phys. Lett. B 495 (2000) 26.
- (21) P. Crochet et al. (FOPI Collaboration), Phys. Lett. B 486 (2000) 6.
- (22) K. Wisniewski et al. (FOPI Collaboration), Eur. Phys. Jour. A 9 (2000) 515.
- (23) G. Q. Li, C. H. Lee, G. E. Brown, Phys. Rev. Lett. 79 (1997) 5214.
- (24) W. Cassing, E. Bratkovskaya, Phys. Rep. 308 (1999) 65.
- (25) G. Q. Li, C. M. Ko, G. E. Brown, Phys. Lett. B 381 (1996) 17.
- (26) Z. S. Wang, C. Fuchs, A. Faessler, T. Gross-Boelting, Eur. Phys. J. 5 (1999) 275.
- (27) Y. Shin et al. (KaoS Collaboration), Phys. Rev. Lett. 81 (1998) 1576
- (28) F. Uhlig, A. Förster et al. (KaoS Collaboration), Phys. Rev. Lett. 95 (2005) 012301.
- (29) F. Laue et al. (KaoS Collaboration), Eur. Phys. J. A 9 (2000) 397.
- (30) A. Schmah, S. Lang et al. (Kaos Collaboration), Phys. Rev. C 71 (2005) 064907.
- (31) D. Brill et al. (KaoS Collaboration), Phys. Rev. Lett. 71 (1993) 336; D. Brill et al. (KaoS Collaboration), Z. Phys. A 355 (1996) 61; D. Brill et al. (KaoS Collaboration), Z. Phys. A 357 (1997) 207.
- (32) P. Senger et al. (KaoS Collaboration), Nucl. Instr. Meth. A 327 (1993) 393.
- (33) R. Brun, F. Bouyant, M. Maire, A. C. McPherson, and P. Zanarini, CERN Publication DD/EE/84-1.
- (34) D. Miśkowiec et al., Nucl. Instr. Meth. A 350 (1994) 174.
- (35) H. Stelzer, Nucl. Instr. Meth. A 310 (1991) 103.
- (36) D. Miśkowiec et al. (KaoS Collaboration), Phys. Rev. Lett. 72 (1994) 3650.
- (37) R. Barth et al. (KaoS Collaboration), Phys. Rev. Lett. 78 (1997) 4007.
- (38) W. Ahner et al. (KaoS Collaboration), Phys. Lett. B 72 (1997) 31.
- (39) K. J. Eskola, K. Kajantie, J. Lindfors, Nucl. Phys. B 323 (1989) 37; D. Miśkowiec, http://www-linux.gsi.de/misko/overlap .
- (40) E. Kolomeitsev, private communication.
- (41) J. Cleymans, H. Oeschler, K. Redlich, Phys. Rev. C 59 (1999) 1663; J. Cleymans, H. Oeschler, K. Redlich, Phys. Lett. B 485 (2000) 27.
- (42) J. Cleymans, A. Förster, H. Oeschler, K. Redlich, F. Uhlig, Phys. Lett. B 603 (2004) 146.
- (43) G. Q. Li and G. E. Brown, Phys. Rev. C 58 (1998) 1698.
- (44) Z. S. Wang, A. Faessler, C. Fuchs, V. S. Uma Maheswari, T. Waindzoch, Phys. Rev. C 57 (1998) 3284.
- (45) A. Mishra, E. Bratkovskaya, J. Schaffner-Bielich, S. Schramm, H. Stöcker, Phys. Rev. C 70 (2004) 044904.
- (46) W. Cassing, L. Tolós, E. L. Bratkovskaya, and A. Ramos, Nucl. Phys. A 727 (2003) 59.
- (47) A. B. Larionov and U. Mosel, Phys. Rev. C 72 (2005) 014901.
- (48) C. Hartnack, H. Oeschler, J. Aichelin, in preparation.
- (49) E. Kolomeitsev et al., J. Phys. G: Nucl. Part. Phys. 631 (2005) S741.
- (50) C. Hartnack et al., Eur. Phys. J. A 1 (1998) 151.
- (51) G. Q. Li, C. M. Ko, Phys. Rev. C 54 (1996) R2159.
- (52) J. Aichelin, Phys. Rep. 202 (1991) 233.