Identification of photons in double beta-decay experiments using segmented germanium detectors - studies with a GERDA Phase II prototype detector
Abstract
The sensitivity of experiments searching for neutrinoless double
beta-decay of germanium was so far limited by the background induced
by external -radiation. Segmented germanium detectors can be
used to identify photons and thus reduce this background component.
The GERmanium Detector Array, GERDA, will use highly segmented
germanium detectors in its second phase. The identification of
photonic events is investigated using a prototype detector. The
results are compared with Monte Carlo data.
keywords:
double beta-decay, germanium detectors, segmentationPACS:
23.40.-s , 14.60Pq , 29.40.-n, , , , ,
1 Introduction
Neutrinoless double beta-decay () is expected to
occur, if the neutrino is a massive Majorana particle. The observation
of the -process would not only reveal the nature of
the neutrino as a Majorana particle but could also provide information
about the absolute neutrino mass scale (see, e.g. [1]).
The germanium isotope 76Ge is a prominent candidate for the
observation of the -process. Experiments searching for
neutrinoless double beta-decay of 76Ge use high purity germanium
detectors as source and detector simultaneously. Their sensitivity is
limited by unidentified background events which in previous
experiments were mostly induced by external -radiation. The
Heidelberg-Moscow and IGEX experiments set 90% C.L. lower limits on
the half-life of the process of
years [2] and
years [3], respectively. An evidence
for the observation of the -process was claimed by
parts of the Heidelberg-Moscow collaboration with
years [4].
The GERmanium Detector Array, GERDA [5], is a new
germanium double beta-decay experiment being installed in Hall A of
the INFN Gran Sasso National Laboratory (LNGS), Italy. Its main design
feature is to operate germanium detectors directly in liquid argon
which serves as cooling medium and as a shield against external
-radiation. A detailed description of the experiment can be
found in [5, 6].
The detectors for the second phase of the experiment (Phase II) will
be enriched in 76Ge to a level of about 86% and will have a mass
of approximately 2 kg each. For the first time, highly segmented
germanium detectors will be used in a double beta-decay
experiment. The segmentation scheme is chosen to minimize the
background level in the energy region around
keV. The current detector design foresees a
6-fold segmentation in the azimuthal angle and a 3-fold
segmentation in the height . All segments and the core are read out
separately to allow a better identification of photons. The estimated
gain in background reduction for the GERDA experiment is
discussed in [6].
In this paper the results of a study with a GERDA Phase II prototype detector are presented. The identification of events with photons in the final state is investigated. Section 2 summarizes the photon identification using coincidences between segments. The underlying physics processes and their signatures are described as are the event selection and the analysis strategy. Section 3 describes the experimental setup of the prototype detector and the data sets collected. The Monte Carlo simulation is introduced in section 4. The results of the study and comparisons with Monte Carlo data are given in section 5. Section 6 concludes and discusses the significance for the GERDA experiment.
2 Identification of photon events using segment coincidences
The volume over which energy in a single event is deposited inside a
detector depends on the incident particles. Segmented detectors can be
used to identify events with photons in the final state by requiring
coincidences between the segments of a detector. This technique is
well established in nuclear experiments such as AGATA [7] and GRETA [8], and provides a basis
for -ray tracking [9].
The potential of segmented detectors for double beta-decay experiments
has also been investigated by the Majorana
collaboration [10] using a clover detector, consisting of
four detectors with two longitudinal segments each, and Monte Carlo
simulations [11].
2.1 Signatures and physics processes
The signatures of events encountered in double beta-decay experiments can be classified according to the particles in the final state. A detailed classification for these events is given in [6]. For the identification of photon events only two such classes are considered here:
-
•
Class L: Local energy deposit. Three different types of events are part of this class: (a) Events with only electrons in the final state. Electrons in the MeV-energy region have a range of the order of a millimeter in germanium [6, 12]. Energy is therefore deposited locally. Double beta-decay events which have two electrons in the final state are of this type (these events correspond to Class I events in reference [6]). (b) Events with photons in the final state in which a photon Compton-scatters only once inside the fiducial volume of the detector. Energy is thus deposited locally. (c) ’Double escape’ events: If a photon produces an electron-positron pair and both photons from the subsequent annihilation escape, energy is deposited locally.
-
•
Class M: Multiple energy deposits. Photons emitted in radioactive decays have energies in the MeV-energy region and interact dominantly through Compton scattering in germanium. The range of these photons is of the order of centimeters. The different interactions are separated by distances large compared to the scale of Class L events. This class is composed of Classes II-IV in reference [6].
It should be noted that with the technique presented in this paper the three event types in Class L cannot be separated but only be distinguished from Class M events.
2.2 Event selection and identification of photon events
Due to the well separated multiple energy deposits Class M events are expected to deposit energy predominantly in more than one segment. Class L events will predominantly deposit energy in only one segment. Events in which more than one segment measures deposited energy can thus be identified as Class M events.
3 Experimental setup and data sets
3.1 Experimental setup
The GERDA Phase II prototype detector under study is a high
purity -type germanium crystal with a true coaxial geometry. It is
70 mm high and has an outer diameter of 75 mm. The inner diameter is
10 mm. The detector is 6-fold segmented in the azimuthal angle
and 3-fold segmented in the height . It is placed inside a
two-walled aluminum cryostat with a combined thickness of 6 mm. The
operation voltage of the detector is (+) V.
A schematic diagram of the detector and the experimental setup is
given in Figure 1. The core and each segment are read
out using charge sensitive PSC 823 pre-amplifiers. The pre-amplified
signals are digitized using a data acquisition system based on 5
14-bit ADC PIXIE-4 modules at a sampling rate of 75 MHz. In this
configuration the energy resolution of the core is approximately
2.6 keV (FWHM at keV), the energy resolution of the segments
varies between 2.4 keV and 4.7 keV with an average segment energy
resolution of 3.3 keV. The threshold of the core and the segments was
set to 20 keV. Cross-talk between the core and the segment
pre-amplifiers and a constraint in the DAQ system, which resulted in
the inability to handle late arriving signals, caused a fraction of
less than 10% of individual segment signals to not be recorded.
A detailed description of the setup and the prototype properties will be published [13].

3.2 Measurements and data sets
Several measurements were performed with different radioactive sources
positioned 10 cm above the center of the detector. Energy and time
information in all segments and the core were recorded on an
event-by-event basis. An event was recorded, if the energy measured in
the core exceeded the threshold. Measurements were performed with
three different sources: (1) a 60 kBq 60Co source, (2) a 100 kBq
228Th source and (3) a 75 kBq 152Eu source. The
corresponding data sets are referred to as “source data sets” in the
following and contain approximately events each. An
additional measurement without any source was performed in order to
estimate the background in the laboratory. This “background data
set” contains approximately events.
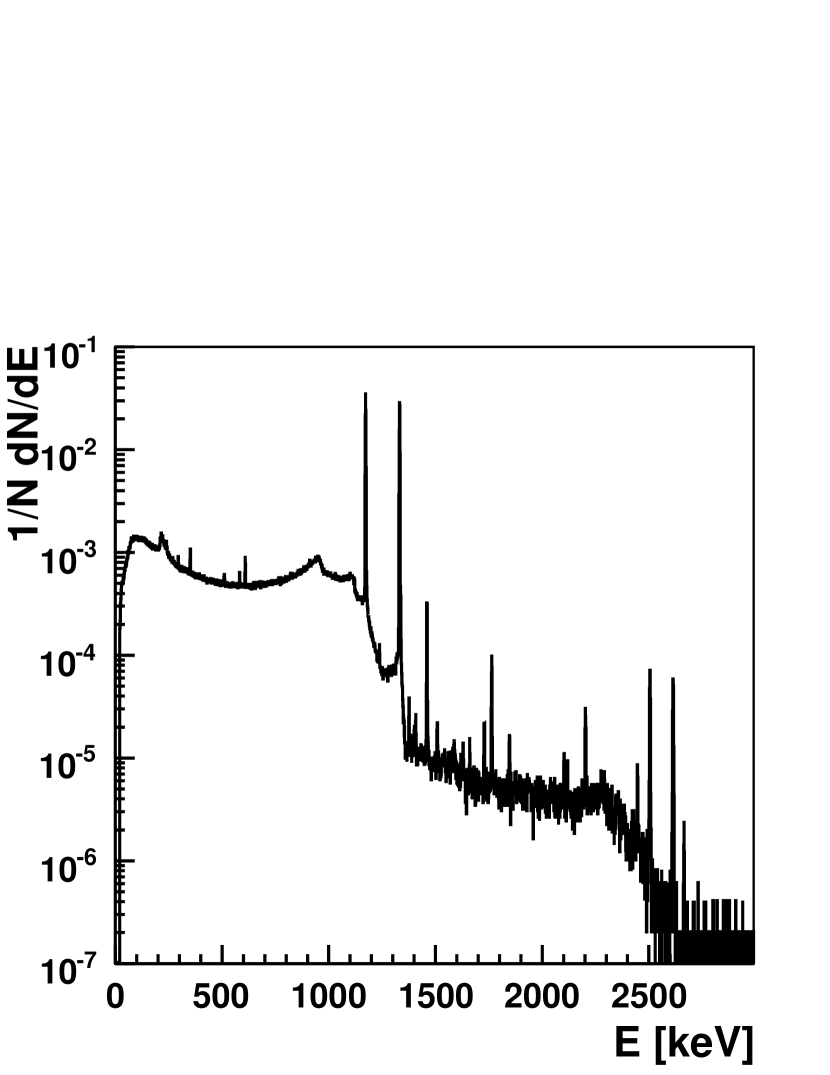
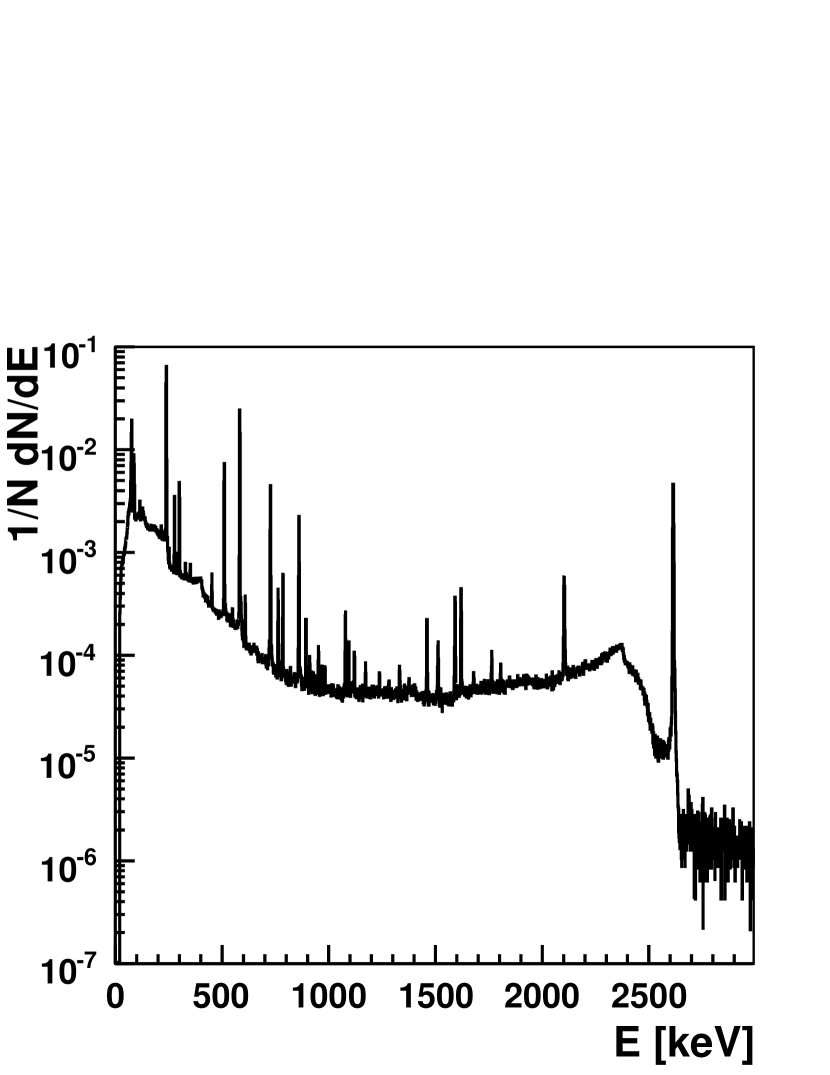
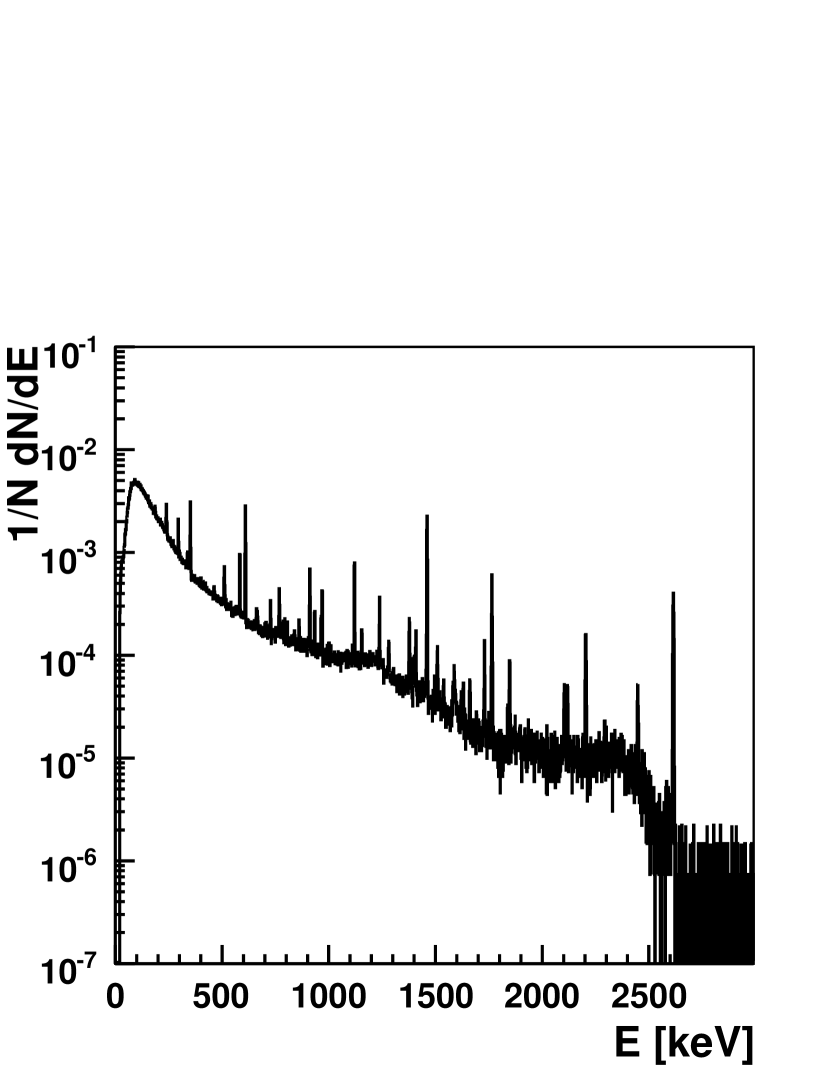
Figure 2 shows the raw energy spectra obtained with the core electrode for the three source data sets and the background data set.
|
|

|
|
4 Monte Carlo simulation
A Monte Carlo simulation of the prototype setup was performed using
the GEANT4 [14] based MaGe
framework [15]. The energy deposited in each segment is
recorded and the core energy is calculated by adding all segment
energies.
The drift anisotropy of charge carriers inside the germanium
diode [16] can cause electrons and holes to deviate from their
drift path. It is therefore possible to measure energy in one segment
even if the energy was deposited in the neighboring segment. Hence, a
correction is applied to the segment energies. An effective model is
used which assigns a segment to each energy deposit depending on its
position with respect to the axes of the crystal and the segment
borders. The maximum angular shift is 3.5∘. The directions of
the crystal axes were measured and used as input for the Monte
Carlo. This includes an overall variation of this effect by 40% with
respect to the two hemispheres.
Each segment is assigned a relative efficiency with respect to the
core on the order of 90%. This effectively models the
DAQ-inefficiency. The segment and core energies are individually
smeared according to the energy resolution of the prototype detector
measured in each channel.
5 Results
The results of the measurements are presented in the following and compared to Monte Carlo data. In order to account for background from radioactive isotopes in the laboratory the fraction of background events in each data set is estimated.
5.1 Background estimate
The number of background events in a given source data set is
estimated using characteristic photon lines in the spectrum. These
lines are associated with the decays of 214Pb (352 keV),
214Bi (609 keV, keV, keV, keV) and
40K ( keV). The photon lines are fitted with a Gaussian
plus linear function and the number of events, , under each
peak is calculated.
For the background data set, the fraction of events under the th peak is denoted , where is the number of events under the th peak and is the total number of events in the spectrum. For each source data set the total number of background events, , is estimated by minimizing a -function defined as
| (1) |
where is the Poissonian uncertainty on the
expression .
The fraction of background events in the source data sets are estimated as 14.0% () for 60Co, 8.3% () for 228Th and 15.8% () for 152Eu. An uncertainty on the background fraction of 0.1% is estimated.
5.2 Photon identification and reduction
The segment multiplicity, , is defined as the number
of segments with measured energies larger than the threshold of
20 keV.
A measure for the identification of photonic events is the
number suppression factor, , defined as the
ratio of the number of events within a 10 keV region around a certain
energy and the number of events which, in addition, have a segment
multiplicity of . In order to quantify the
identification of photons which deposit their full energy within the
detector the line suppression factor, , is defined
similarly to , but the number of events is replaced by the
number of events under the photon peak under study.
For the calculation of the suppression factors the number of events in
the source data sets are corrected for the background by subtracting
the background contribution.
The number suppression factor is calculated for the region of 76Ge ( keV) whereas the line suppression factors are calculated for the photon lines of 60Co ( keV, keV and the summation peak at keV), 208Tl (511 keV, 583 keV, 861 keV, keV and the corresponding single and double escape peaks at keV and keV), 212Bi ( keV) and 152Eu (122 keV, 245 keV, 344 keV, 779 keV, 964 keV, keV, keV and keV). The results are displayed in Table 1 for data and Monte Carlo data. For a discussion of the agreement between data and Monte Carlo see section 5.5.
| Source | Energy | (data) | (data) | (MC) | (MC) |
| [keV] | |||||
| 60Co | - | 2.56 0.01 | - | 2.56 0.01 | |
| - | 2.63 0.01 | - | 2.63 0.01 | ||
| - | 34.6 5.7 | - | 43.0 11.0 | ||
| 14.2 2.1 | - | 12.5 2.1 | - | ||
| 228Th | - | 1.92 0.01 | - | 1.91 0.02 | |
| - | 2.04 0.01 | - | 2.01 0.01 | ||
| - | 2.35 0.03 | - | 2.37 0.05 | ||
| - | 1.09 0.02 | - | 1.09 0.04 | ||
| - | 2.85 0.01 | - | 2.84 0.13 | ||
| - | 3.13 0.01 | - | 3.20 0.11 | ||
| - | 3.04 0.02 | - | 3.23 0.04 | ||
| 1.68 0.02 | - | 1.66 0.05 | - | ||
| 152Eu | - | 1.01 0.002 | - | 1.01 0.003 | |
| - | 1.26 0.01 | - | 1.22 0.01 | ||
| - | 1.54 0.01 | - | 1.55 0.01 | ||
| - | 2.29 0.01 | - | 2.26 0.02 | ||
| - | 2.46 0.02 | - | 2.41 0.02 | ||
| - | 2.54 0.02 | - | 2.50 0.03 | ||
| - | 2.52 0.02 | - | 2.54 0.04 | ||
| - | 2.64 0.02 | - | 2.72 0.02 |
The line suppression factors increases from at 122 keV
to at keV, where the suppression increases
with increasing energy. This is expected as the average number of
Compton-scattering processes increases. Figure 3
shows the line suppression factors as a function of the core energy
for data and Monte Carlo data.
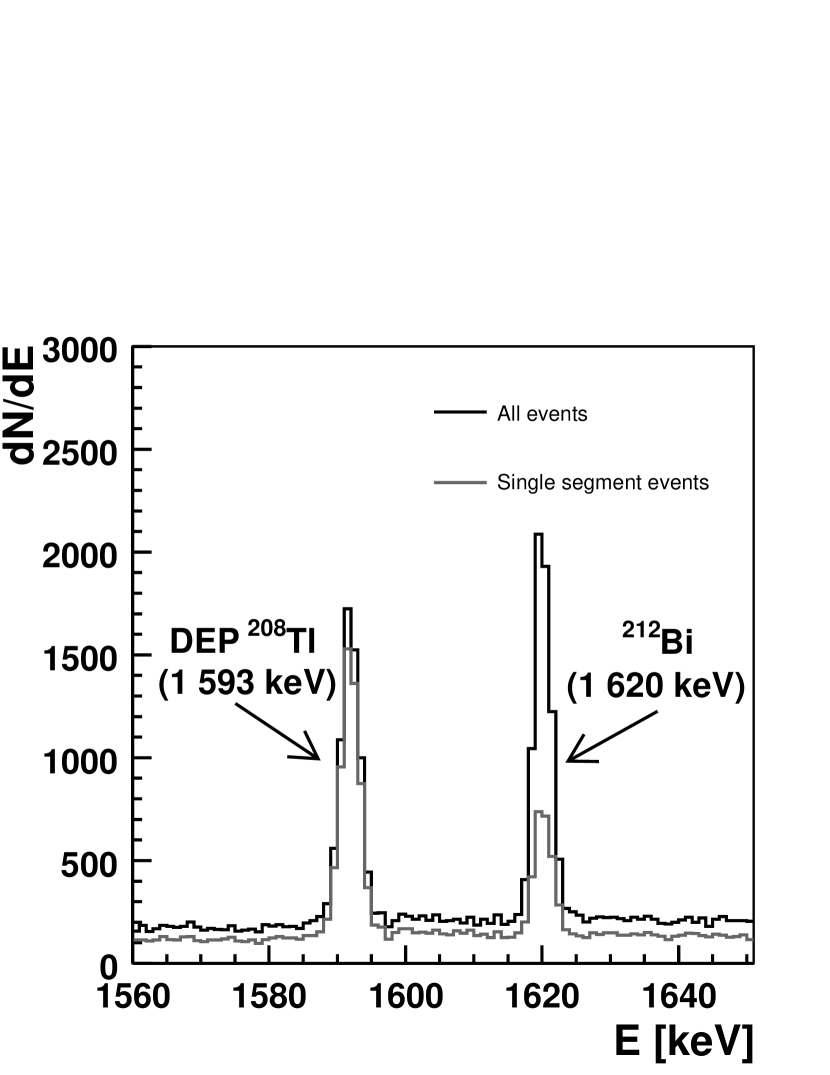
The double escape peak of the keV photon from the
de-excitation of 208Tl at keV is basically not
suppressed. These Class L events have a very localized energy
deposition. In comparison, the keV line from the 212Bi
is suppressed by a factor of . These events are
predominantly encompassed in Class M.
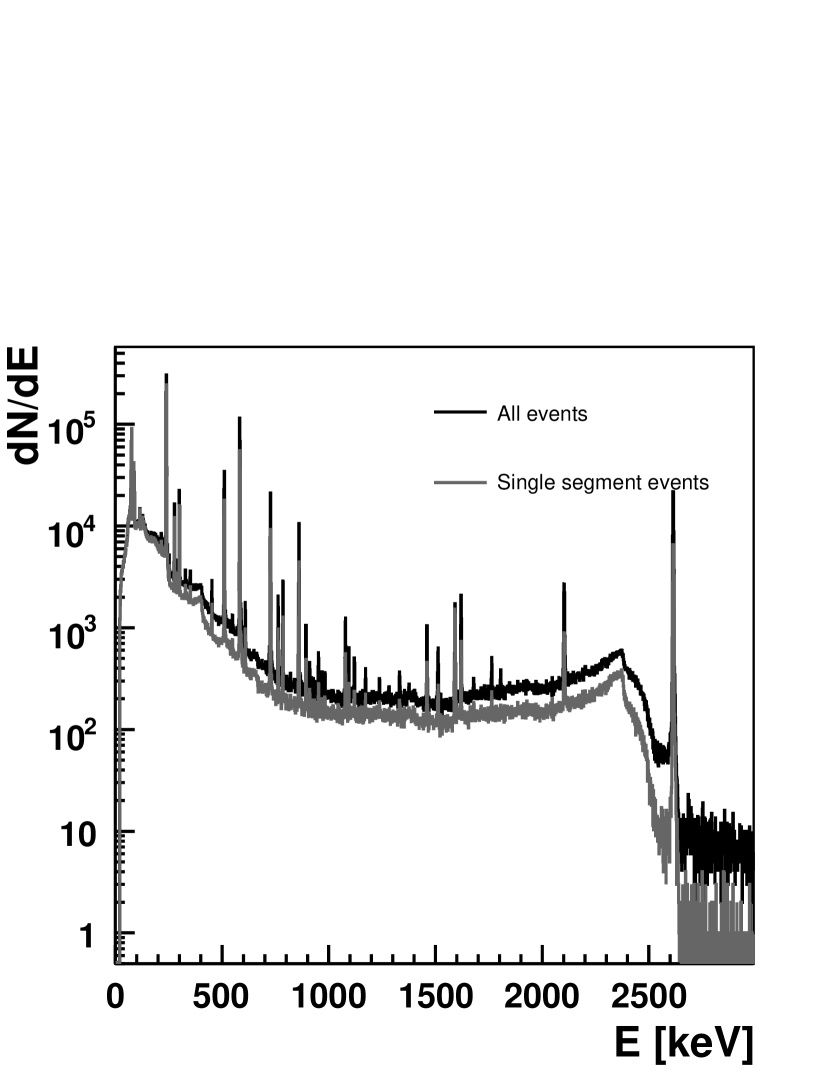
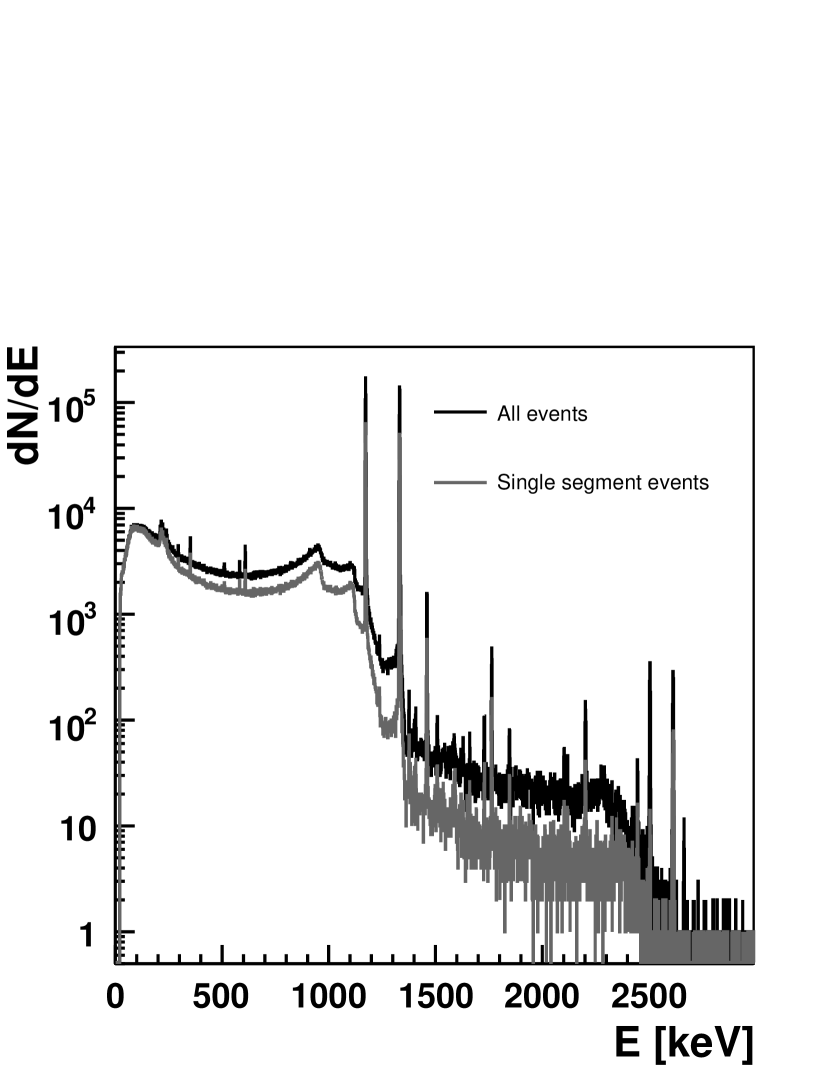
Figure 4 shows the energy spectrum for the
228Th source with and without a segment multiplicity requirement
of . The left figure shows the energy region up to
3 MeV, the right figure shows a close-up of the region around
1.6 MeV. Note that background has not been subtracted from the data
spectra.
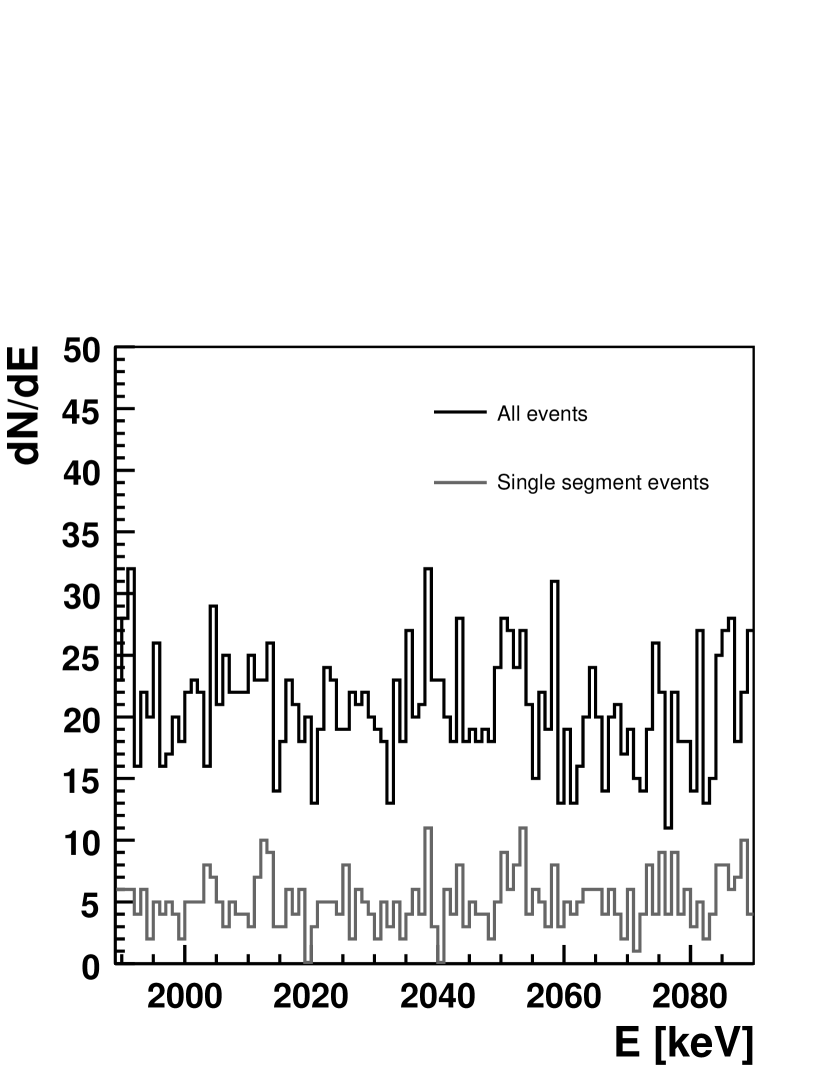
The number suppression factor for the 60Co source is
. It is large compared to the suppression factor
for the 208Th source of . For the latter,
the region lies within the Compton continuum of the
208Tl photon. A single scattering process can cause a local
energy deposit. In contrast, for the 60Co source an energy
deposit in this energy region is only possible if both photons
( keV and keV) deposit energy in the same segment. In
contrast, the number suppression factor for -decay
events is expected to be close to unity as the electrons in the final
state mostly deposit energy in only one segment.
Figure 5 shows the energy spectrum for the
60Co source with and without a segment multiplicity requirement
of . The left figure shows the energy region up to
3 MeV, the right figure shows a close-up of the region around the
-value of 76Ge. Note that background has not been
subtracted from the spectra.

|
|
|
|
5.3 Segmentation study
In order to study the identification of photons for different
segmentation schemes the segment energies are added in three patterns:
sector, ring and hemisphere. A sector is obtained by adding the
energies of equal segments. A ring is obtained by adding the
energies of equal segments. Two hemispheres are obtained by adding
the energies of sectors 0, 1, 2 and sectors 3, 4, 5, respectively. The
effective number of segments for the segmentation schemes are 6, 3 and
2, respectively.
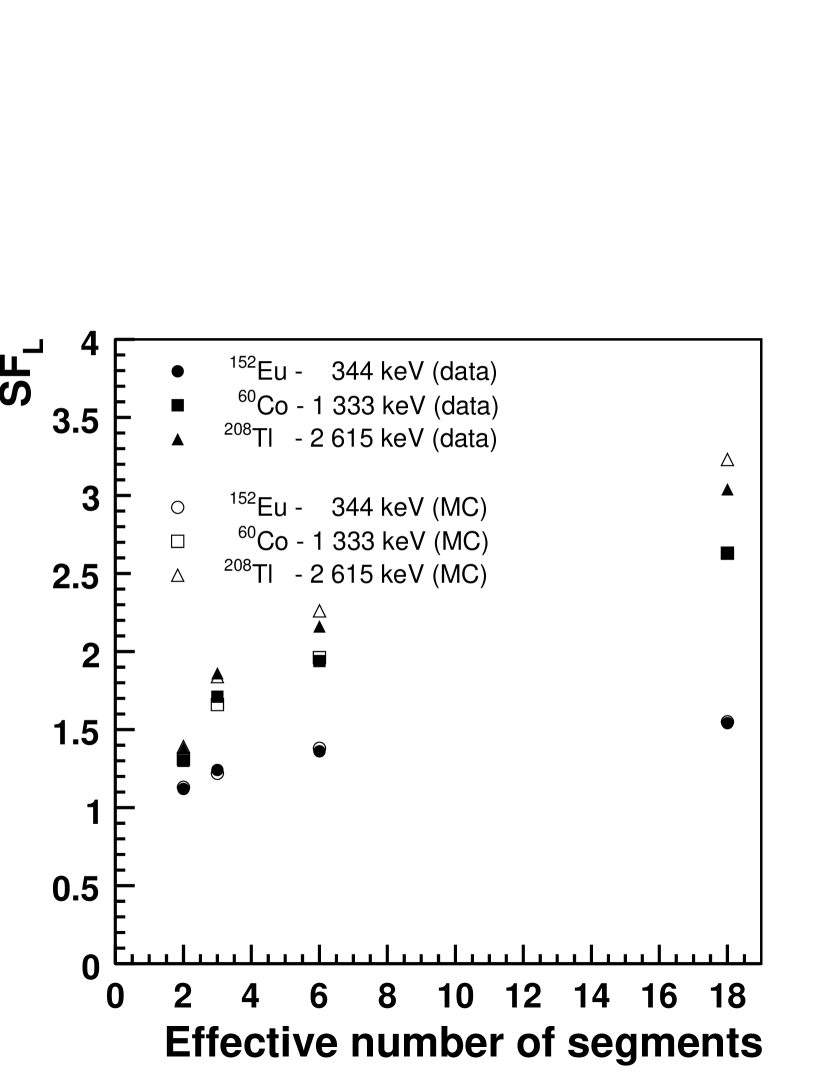
The suppression factors for each segmentation scheme are obtained as described in section 5.2 with segments replaced by sectors, rings or hemispheres. Table 2 shows the number suppression factor and line suppression factors for selected photon lines for all four schemes (including the 18-fold segmentation scheme) obtained from the measurements. As expected, the number and line suppression factors increase with an increasing effective number of segments.
| Source | Energy | (18) | (6) | (3) | (2) |
|---|---|---|---|---|---|
| [keV] | |||||
| 152Eu | 344 | 1.54 0.01 | 1.36 0.004 | 1.24 0.003 | 1.12 0.003 |
| 60Co | 2.63 0.01 | 1.94 0.01 | 1.71 0.004 | 1.30 0.003 | |
| 228Th | 3.04 0.02 | 2.16 0.01 | 1.86 0.01 | 1.38 0.01 | |
| 60Co | 14.2 2.1 | 9.63 1.21 | 3.92 0.33 | 2.61 0.19 | |
| 228Th | 1.68 0.02 | 1.43 0.02 | 1.40 0.02 | 1.18 0.02 |
Figure 6 shows the line suppression factors for the selected photon lines as a function of the effective number of segments for data and Monte Carlo.
5.4 Further studies
The effect of the energy threshold on the line suppression factors was
studied by varying the threshold of the core and segment channels from
15 keV to 100 keV. A sharp rise of the line suppression factors is
observed towards 15 keV due to an increased noise level. This behavior
is not observed in Monte Carlo. Between 20 keV and 100 keV the line
suppression factors decrease by up to 7%. In particular, the double
escape peak at keV decreases by 4%.
A variation of the position of the source was performed. The distance
between the source and the crystal was varied. In addition, the
sources were placed at half the crystal height. The radial distance
between the source and the crystal was varied. No significant
difference in the suppression factors was found.
The uncertainty on the background fraction in the data samples is estimated to be 0.1%. A variation of the estimated background fraction by this amount did not reveal significant differences in the line suppression factors. For 60Co the number suppression factor decreases with an increasing background fraction because background events in the energy region around 2 MeV are mostly singly Compton-scattered photon events from 208Tl.
5.5 Data to Monte Carlo comparison
In the following, the results of the Monte Carlo simulation introduced
in section 4 are compared with data for the
60Co measurement. Equivalent results are obtained for all three
sources used.
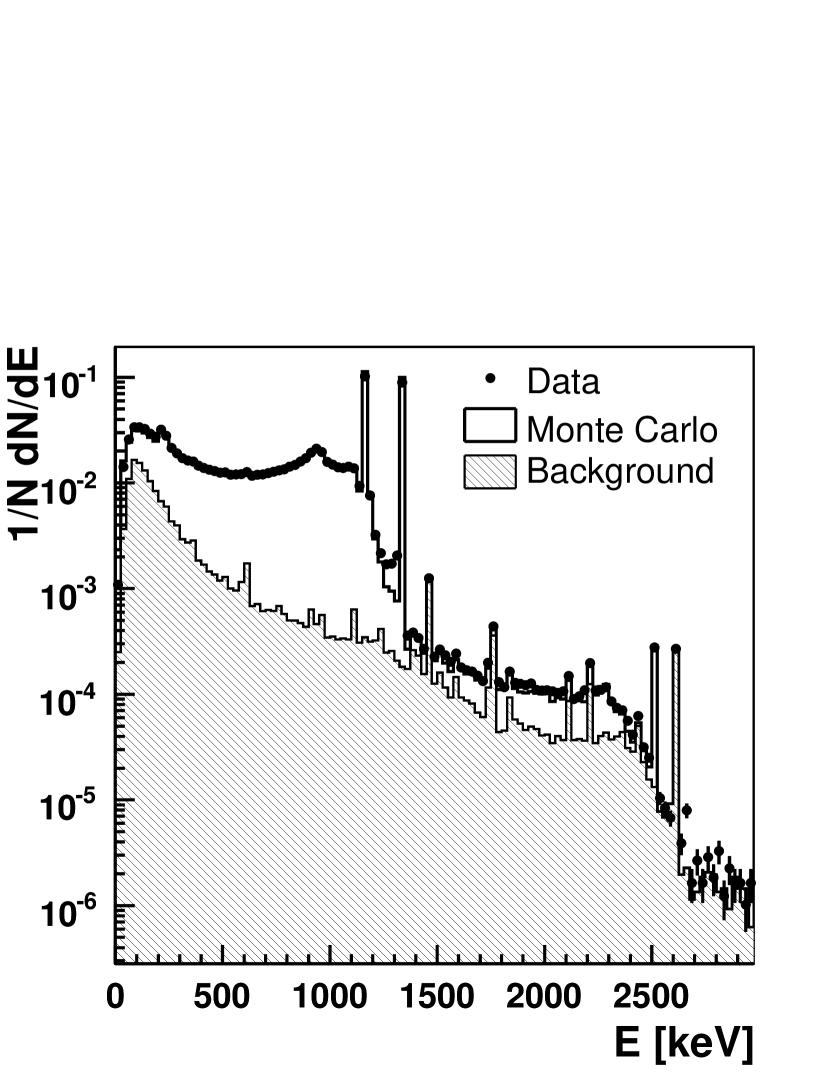
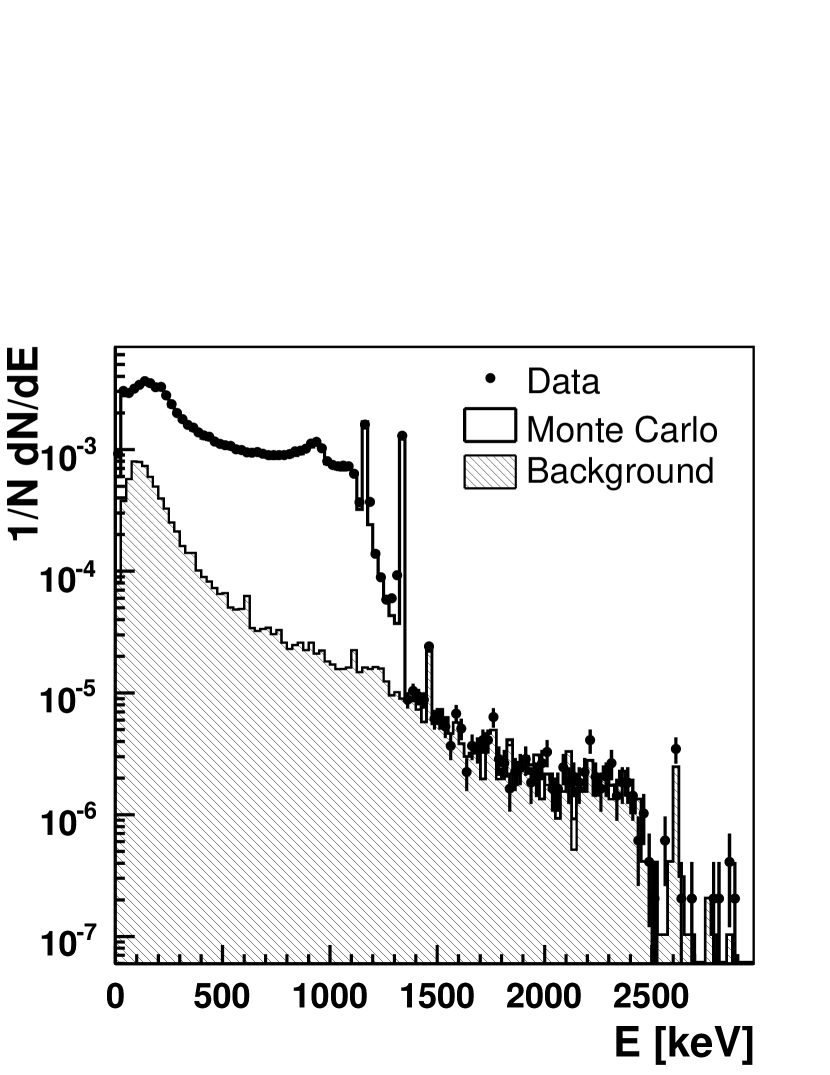
Figure 7 (top, left) shows the core energy spectrum
for the 60Co source. The data is indicated by the black
marker. Also shown is the statistical uncertainty. The background data
is represented by the hatched histogram, the Monte Carlo data by the
open histogram. The background contribution is estimated as previously
described. For energies below 100 keV the Monte Carlo plus background
data exceeds the data due to the trigger turn-on which is not
described by Monte Carlo. The Compton continuum of the two 60Co
lines is described by Monte Carlo with an average deviation of
about 5%. The number of events under the peak for the two 60Co
lines are lower in data by 10%. Tails left and right of the gamma
peaks in data are due to pile-up and not described by the
simulation. The region above 1.3 MeV is dominated by background
events. In this region the average deviation between data and Monte
Carlo plus background data is of the order of 10% or less. In
particular, the number of events under the peak for the 60Co
summation line and the 208Tl line agree within the statistical
uncertainties.
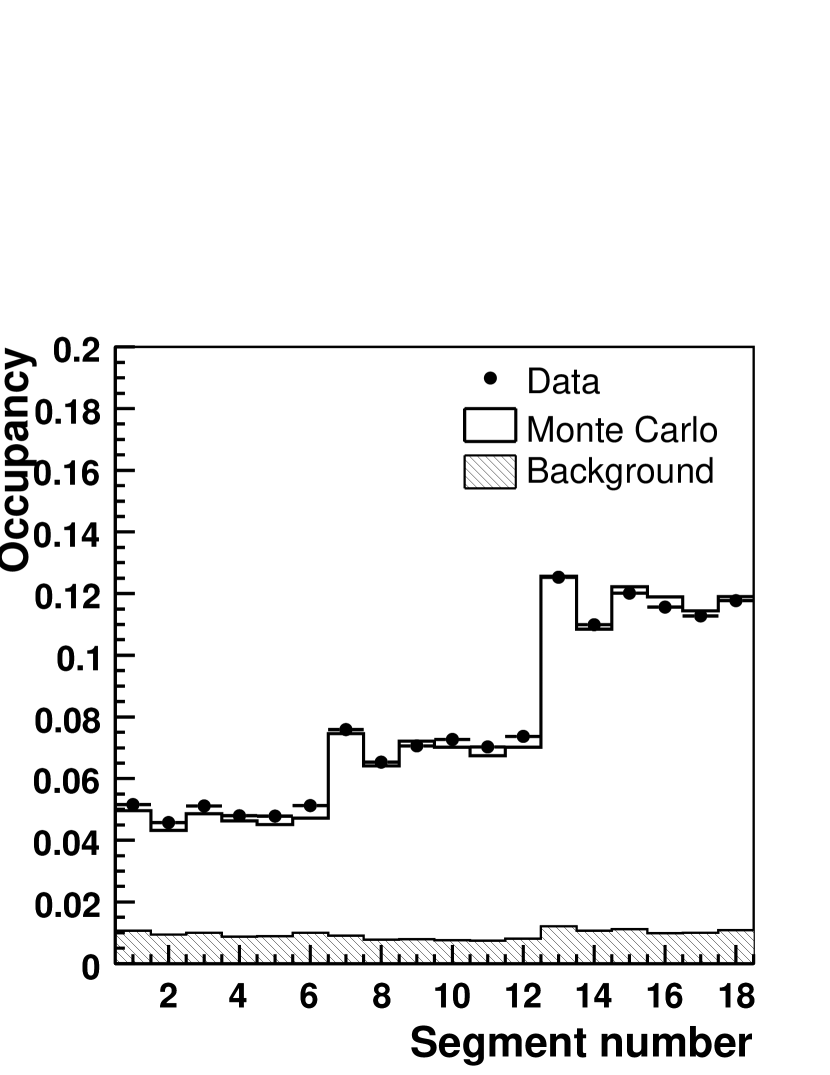
Figure 7 (top, right) shows the occupancy of each
segment, i.e. the fraction of events in which energy is deposited in
the segment under study. No cut on the energy has been
applied. Clearly visible are three groups of segments (1-6, 7-12,
13-18) which correspond to the three z-positions bottom, middle and
top, respectively. As expected, the bottom segments have the lowest,
the top segments the highest occupancy. A pattern within each group is
present which can be explained by the drift anisotropy of the charge
carriers. The structure is reproduced by Monte Carlo using an
effective model for the anisotropy. Without taking the anisotropy into
account no structure is visible. The deviation between data and Monte
Carlo plus background data ranges up to 5-10%.
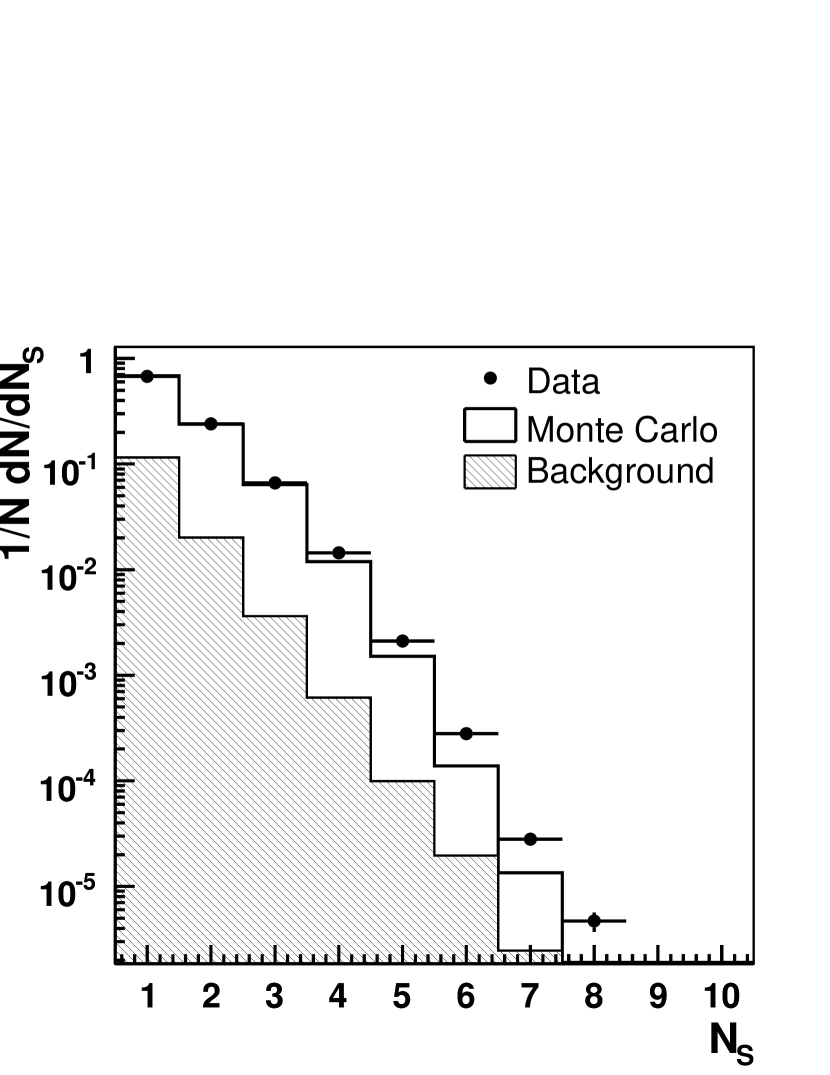
Figure 7 (middle, left) shows the segment
multiplicity . Data and Monte Carlo range up to
multiplicities of 7-8 with an average multiplicity of 1.4. For
multiplicities up to 3 the deviation between data and Monte Carlo plus
background data ranges up to 5%. For higher multiplicities the data
exceeds the Monte Carlo with increasing multiplicity.
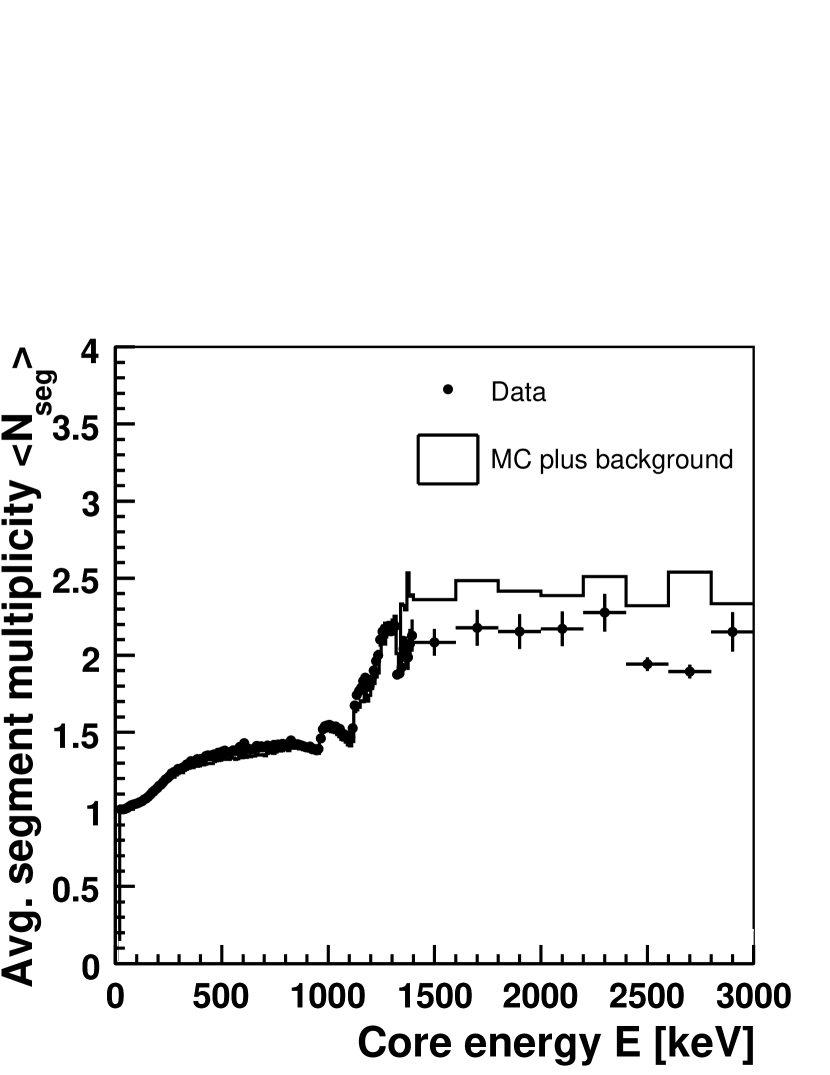
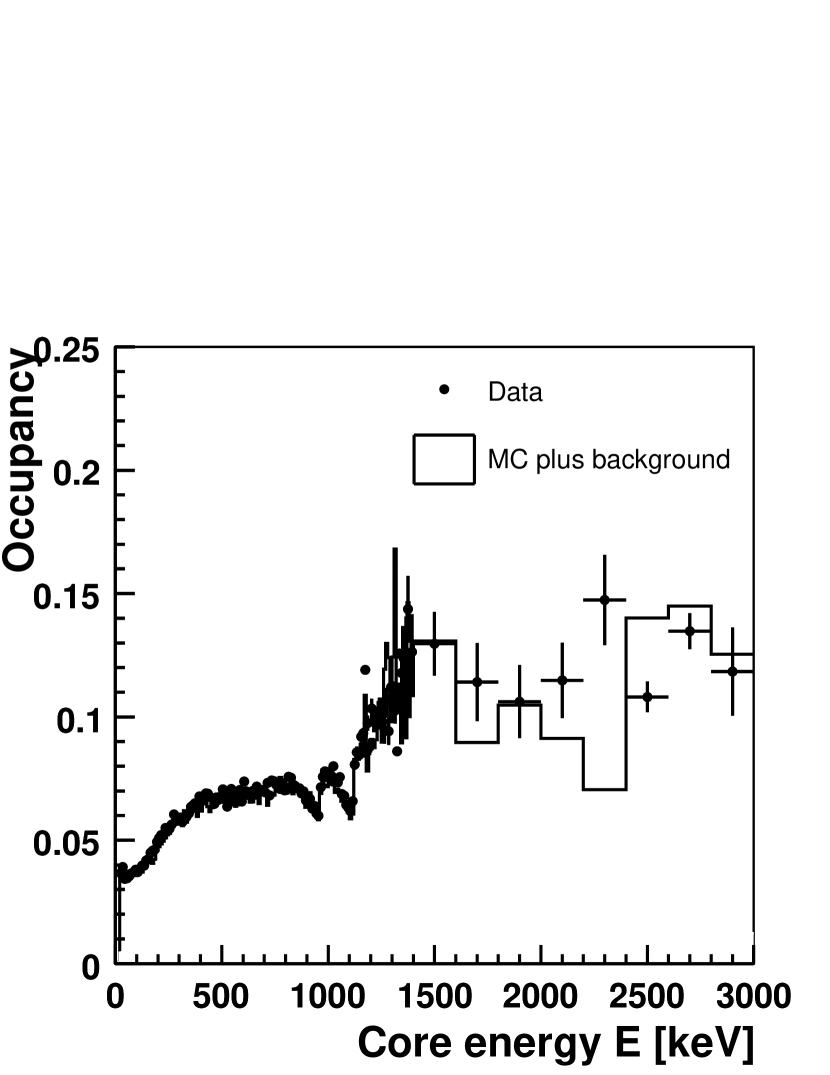
Figure 7 (middle, right) shows the average segment
multiplicity as a function of the energy measured with the core
electrode up to 3 MeV. For energies up to 1 MeV the average
multiplicity increases with energy from 1 to about 1.5. For energies
between 1 MeV and 1.3 MeV the multiplicity increases up to 2.2. The
deviation between data and Monte Carlo plus background data for
energies below 1.3 MeV ranges up to 10%. For higher energies the
average deviation is of the order of 15%, where the Monte Carlo plus
background data shows a larger average multiplicity.
Figure 7 (bottom, left) shows the energy spectrum
measured with (arbitrarily chosen) segment 10 up to energies of
3 MeV. The features described for the core electrode are also seen
here. The deviation between data and Monte Carlo plus background data
ranges up to 10%.
Figure 7 (bottom, right) shows the occupancy for
segment 10 as a function of the energy measured with the core
electrode up to 3 MeV. The occupancy ranges from 5% to 8% for
energies below 1.3 MeV. For larger energies the occupancy ranges up to
15%. The deviation between data and Monte Carlo plus background data
ranges up to 10%.
The suppression factors derived from the data are compared with those
yielded from the Monte Carlo simulation in
Table 1. The average deviation between data and
Monte Carlo data is less than 5%. The absolute values depend on the
DAQ-inefficiency.
The overall agreement between data and Monte Carlo plus background data is good. The remaining discrepancy between data and Monte Carlo plus background data could stem from (1) the modeling of the exact detector geometry including dead layers and segment borders, (2) the missing modeling of the drift of charge carriers, especially close to the surface of the crystal, (3) the missing simulation of the pre-amplifier response, (4) effects which are not accounted for in the simulation such as pile-up and trigger turn-on in the DAQ system and (5) the missing angular correlation between the photons of the cascades111Preliminary studies show that the angular correlation between the photons emitted in the decay of 60Co has no significant effect on the suppression factors..
|
|
|
|
|
|
6 Conclusions and outlook
A study with a segmented GERDA prototype detector was
performed. It was shown that the identification of events with
multiply scattered photons in the final state using segmented
detectors is feasible. The reduction of events in which only the full
photon energy is deposited inside the detector is energy dependent and
increases from at 122 keV to at
keV in the experimental setup described. The suppression of
Compton-scattered events in the -region of 76Ge
( keV) coming from 60Co and 228Th sources was
measured to be and , respectively.
An additional study showed that the identification of photon events is
improved by increasing the number of segments and that it is stable
with respect to energy threshold variations and the background
estimate.
In comparison to the suppression factors calculated in [6] the suppression for a single crystal is lower than for an array of detectors due to the geometrical acceptance.
A data to Monte Carlo comparison, considering background from
radioactive isotopes in the laboratory, showed an agreement with
deviations on the level of 5-10%. This shows that simulations based
on the MaGe tool are suitable and can reliably predict
background reductions as presented in [6].
The identification of photonic events can be further improved by the analysis of the time structure of the detector responses. This is currently under study.
7 Acknowledgements
The authors would like to thank the GERDA and Majorana Monte Carlo groups for their fruitful collaboration and cooperation on the MaGe project.
References
- [1] S. M. Bilenky, C. Giunti, W. Grimus, B. Kayser and S. T. Petcov, Phys. Lett. B 465 (1999) 193
- [2] M. Gunther et al., Phys. Rev. D 55 (1997) 54.
- [3] D. Gonzalez et al., Nucl. Instrum. Meth. A 515 (2003) 634
- [4] H. V. Klapdor-Kleingrothaus, A. Dietz, H. L. Harney and I. V. Krivosheina, Mod. Phys. Lett. A 16 (2001) 2409
- [5] S. Schönert et al. [GERDA Collaboration], Nucl. Phys. Proc. Suppl. 145 (2005) 242.
- [6] I. Abt et al. [GERDA Collaboration], Nucl. Instr. and Meth. A 570/3 (2007) 479.
- [7] J. Simpson, J. Phys. G 31 (2005) S1801.
- [8] K. Vetter et al., Nucl. Instrum. Meth. A 452 (2000) 105.
- [9] N. J. Hammond, T. Duguet and C. J. Lister, Nucl. Instrum. Meth. A 547 (2005) 535
- [10] R. Gaitskell et al. [Majorana Collaboration], arXiv:nucl-ex/0311013.
- [11] C. E. Aalseth et al. [Majorana Collaboration], Nucl. Phys. Proc. Suppl. 138 (2005) 217.
- [12] R. B. Firestone, “Table of Isotopes”, 8th edition, 1999, John Wiley & Sons, Inc., ISBN 0-471-14918-7.
- [13] I. Abt et al. [GERDA Collaboration], arxiv:nucl-ex/0701004.
- [14] S. Agostinelli et al. [GEANT4 Collaboration], Nucl. Instrum. Meth. A 506, 250 (2003).
- [15] M. Bauer et al., Journal of Physics, Conf. Series. 39 (2006) 362.
- [16] H. G. Reik and H. Risken, Phys. Rev. 126 (1962) 1737-1746