Bimodal pattern in the fragmentation of Au quasi-projectiles
Abstract
Signals of bimodality have been investigated in experimental data of quasi-projectile decay produced in Au+Au collisions at 35 AMeV. This same data set was already shown to present several signals characteristic of a first order, liquid-gas-like phase transition. For the present analysis, events are sorted in bins of transverse energy of light charged particles emitted by the quasi-target source. A sudden change in the fragmentation pattern is observed from the distributions of the asymmetry of the two largest fragments, and the charge of the largest fragment. This latter distribution shows a bimodal behavior. The interpretation of this signal is discussed.
pacs:
05.70.FhPhase transitions: general studies and 25.70.-zLow and intermediate energy heavy-ion reactions1 Introduction
The existence of different phases for infinite nuclear matter is predicted by theoretical calculations since the early 80’s history . Then, the possibility of observing a nuclear liquid-gas phase transition in the laboratory has been deduced from several experimental observations associated to the multi-fragmentation of finite nuclei. These observations indicate the occurrence of a state change in finite nuclei, which is interpreted to be the finite system counterpart of a phase transition chomaz .
Many of these signals are qualitative, and therefore cannot give information on the detailed trajectory (in terms of pressure, volume, temperature, isospin) followed by the system from one phase to the other. Other signals give in principle quantitative information, but can be distorted. Indeed the products of the reactions are detected asymptotically and not at the production time, and therefore they need to be corrected for secondary decay decay . These corrections are, at least partially, model dependent and induce systematic errors which are difficult to estimate quantitatively.
To overcome these difficulties, it is important to perform a systematic study of different phase transition signals. The best would be to exploit new generation 4 apparatuses, in order to be able to investigate several signals at the same time, with the same experimental data samples, and with a complete or quasi-complete detection praga . Waiting for these new apparatuses, some of the signals indicating a phase transition have been obtained with measurements performed by the Multics mcs , together with the Miniball mini , multi-detectors. In the last few years we have investigated in detail the properties of quasi-projectiles detected in Au + Au reactions at 35 A.MeV, with a fixed source charge, and at different excitation energies. The following signals have been obtained:
-
1.
the average size of the heaviest fragment (tentatively associated to the liquid part) decreases for increasing excitation energy of the nuclear system dag with a power law distribution of exponent ;
-
2.
temperature measurements result compatible mil ; reliability with a ”plateau” in the caloric curve caloric ;
-
3.
critical exponents have been extracted dag , close to the values expected within the liquid-gas universality class;
-
4.
the size distribution presents a scaling la Fisher critical ;
-
5.
interaction energy fluctuations, corrected for side-feeding, were shown to overcome the statistical expectation in the canonical ensemble, corresponding to a negative branch of the microcanonical heat capacity for a system in thermodynamical equilibrium negative .
Some of these signals are coherent with the findings of other experimental collaborations with different data sets ma ; natowitz ; eos ; isis . In particular, the last two signals have been confirmed in central reaction measurements performed with the Multics dag2 ; bruno and with the Indra reliability ; leneindre apparatuses. Some of these behaviors were also observed in other finite physical systems undergoing a transformation interpreted as a first order phase transition, namely in the melting of atomic clusters negclu ; turchi and in the fragmentation of hydrogen clusters neg3 .
Recently PRE , a new topological observable has been proposed to recognize first order phase transitions. When a finite system undergoes such a transition, the most probable value of the order parameter changes discontinuously, while the associated distribution is bimodal close to the transition point, i.e. it shows two separate peaks, corresponding to the two different phases binder ; dasgupta . In the case of transitions with a finite latent heat, this behavior is in agreement with the Yang-Lee theorem for the distribution of zeroes of the canonical partition sum in the complex temperature plane zeroes , and equivalent to the presence of a curvature anomaly in the microcanonical entropy intruder .
Since many different correlated observables can serve as order parameters in a finite system, the task is to choose an order parameter which can be accessible from the experimental side WCI . This is the case for observables related to the measured charges. The INDRA collaboration indra has proposed as order parameter the variable Z, where Z1 and Z2 are the charge of the largest and the second largest fragments detected, in each event, in the decay of an excited source. An indication of a bimodal distribution was obtained for this quantity. Signals of bimodality in different observables have been obtained in experiments with different projectile-target combinations, and in different energy ranges ma ; WCI ; bell .
In ref. WCI it has been pointed out that the variable Zsym can present a spurious bimodality in small three-dimensional percolation lattices close to the percolation threshold. This behavior is due to finite size, and makes a bimodality in Zsym an ambiguous signature of the transition. On the other side, the size or charge of the largest fragment have distributions which for any lattice size are consistent with the critical percolation behavior campi . These observables were then suggested as more apt to discriminate between a first order phase transition, a critical phenomenon, and a smooth cross-over.
In this paper we investigate if these different signals are present in our data. We also discuss the relation of the bimodality signal with other phase transitions indicators obtained for our data.
2 The experiment
The measurements and the analysis have been extensively described elsewhere dag . Here we recall that the measurements were performed at the K1200-NSCL Cyclotron of the Michigan State University. The Multics mcs and Miniball mini arrays were coupled to measure light charged particles and fragments with a geometrical acceptance of the order of 87% of 4. The events have been recorded if at least two different modules have been fired. Similarly to Ref. indra , the selection of the quasi-projectile (QP) source have been made by a shape analysis, keeping all the fragments with . The fragments have been considered as belonging to the QP, if forward emitted in the ellipsoid reference frame. The complete source has been obtained by doubling the forward emitted light particles in the backward direction, in order to minimize the contamination of light particles emitted by a possible mid-velocity source. At the end of this procedure, only events with total charge within 10% of the Au charge have been considered for the analysis, in order to study the decay of a well detected constant size source, in a wide range of excitation energies.

In order to visualize the source characteristics in the selected events, the fragment (Z) charge density distribution lecolley is shown in Fig. 1 as a function of the fragment velocity in the QP reference frame. The ensemble averaged charge density is defined as
where is the event-by-event distribution in the velocity for the collected charge fraction. This observable represents the distribution of the collected charge bound in fragments along the direction of the QP velocity. In Fig. 1 the continuous line (full points) represents the charge density for fragments accepted for the QP, the dashed line (open squares) for fragments of the QT. This latter is consistent with the filtered simulation of a QT source symmetric to the QP (dotted line - open circles). QP and QT can be easily recognized, showing that the imposed conditions are effective to select events where the contamination of a mid-velocity source is negligible (for more details see Refs. dag ; reliability ).
The characteristics of these events have been examined by analyzing the isotropy of the fragment angular distribution in the quasi-projectile reference frame negative ; dag2 , and by comparing the data to predictions of a statistical multifragmentation model SMM . The general conclusion is that an important degree of equilibration appears to be reached by the excited quasi-projectile sources in the whole range of excitation energies. For more details, see Refs. dag ; reliability ; negative ; dag2 .
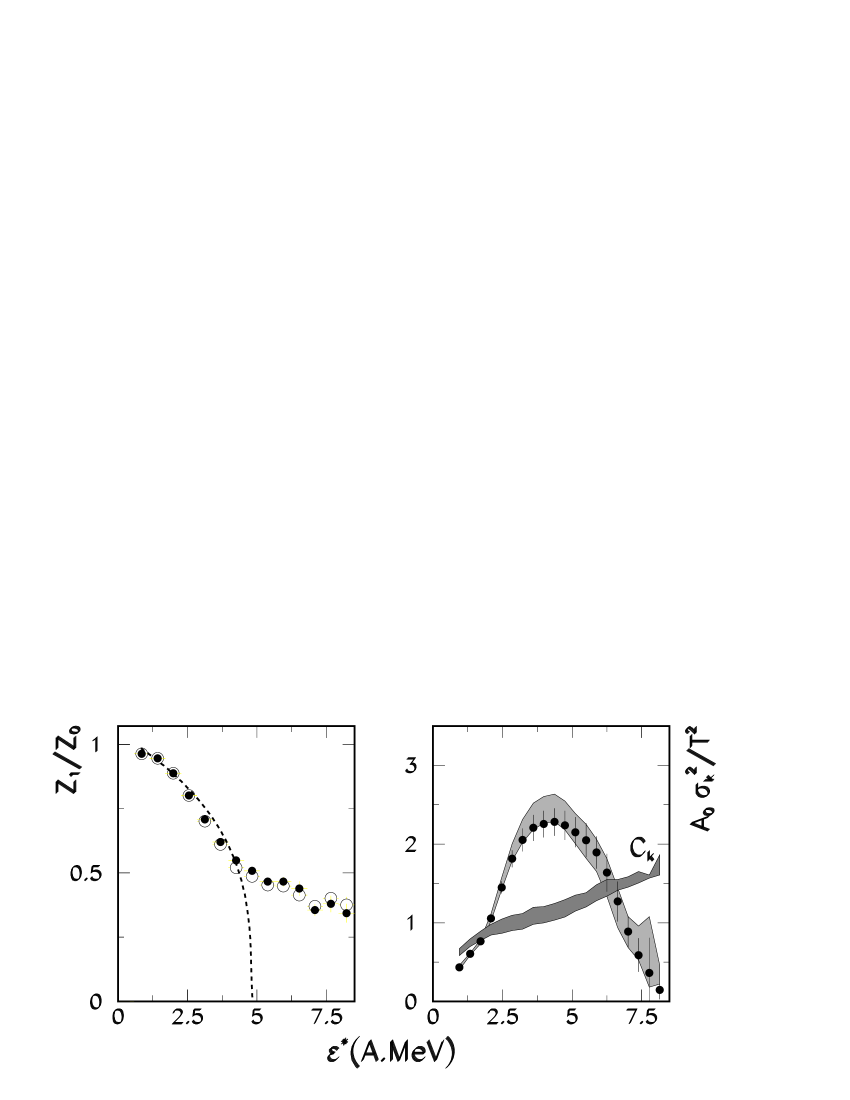
In Refs. dag ; reliability a further condition to characterize the QP was added, i.e. that the velocity of the heaviest fragment is larger than 75% of the projectile velocity. This condition indeed has been replaced with the ”completeness” of the event WCI ; indra which reflects on the limitations on the parallel momentum, since it results less correlated to the variables we want to study. This does not affect the distribution shown in Fig. 1, and all the signals of phase transition do not change significantly. To quantify this statement, we present in Fig. 2 the power-law behavior of the average charge of the largest fragment, normalized to the charge of the source, as a function of the excitation energy, and the normalized partial-energy fluctuations, leading to the estimate of a negative branch for the microcanonical heat capacity negative . The power law in the Z1 distribution and the partial energy fluctuations are very scarcely affected by the condition on the velocity of largest fragment, apart from some very small variations at the higher energies reliability ; negative .
These observations mean that the detection apparatus appears especially effective in the complete detection of purely binary collisions. The same is not true for all reaction mechanisms, which may need different detection systems to be addressed. Only a fraction of well detected peripheral collisions can be interpreted as the independent statistical decay of two isotropic sources colin . For instance within the INDRA apparatus it has been pointed out that for 80 A.MeV Au+Au collisions, these events represent about the 20% of the total number of complete events leneindre2 , and depend on the selection criteria adopted bonnet . In our case the statistical events represent about the 30% of the measured events as reported in Ref. bo2000 , and as can be inferred from Fig. 2b) of Ref. dag . The different in the percentage of statistical events could also be due to the different trigger conditions of two and four modules fired, used in our and Indra measurements, respectively.
3 Signals of bimodality
In the liquid-gas phase transition, the largest fragment detected in each event is a natural order parameter, because of its correlation with the particle density in the grancanonical ensemble PRE ; big . The variable proposed in Ref. indra ; rivet in turn is trivially correlated to the largest cluster size, and in addition brings further information on the global fragmentation pattern. This means that it should be possible to observe a bimodal distribution for the charge of the largest fragment or the asymmetry, if one considers a system close to the transition temperature.
The global distributions of Z1 and Zsym are shown in Fig. 3, for all QP events selected as explained in section 2. Because of the impact parameter geometry, this distribution is clearly dominated by peripheral collisions at low deposited energy, leading to a heavy Z residue with a large asymmetry Z.

We can however also notice the presence of a large bump, corresponding to much lighter residues and much more symmetric fragmentation patterns. For this bump to be interpreted as an indication of bimodality, we should show that:
-
•
the two different decay patterns can be obtained in the de-excitation of the same source,
-
•
they correspond to the same temperature.
Let us first concentrate on the source definition. As we have already stressed in the last section, we are considering only events with a detected charge in the forward QP hemisphere close to the original charge. This guarantees a good detection, but does not constrain the reaction mechanism or the number of sources, since the system is symmetric. Fig. 1 shows that the selected events are consistent with a purely binary kinematics, meaning that the bump at low charge shown by Fig.3 cannot be ascribed to a reduced size of the excited source. However Fig. 1 is obtained with the whole set of events, which is largely dominated by peripheral collisions. We may then wonder whether a (small) contamination of central collisions, leading to an important stopping in the center of mass, may be responsible of a decrease of the QP source size in the dissipative reactions corresponding to the low Z1 bump.
In Fig. 4 we plot the velocity in the laboratory frame of the QP source as a function of the excitation energy, with cuts of Z 50 (full points) and Z 50 (open points). The source velocity expected for a two body (QP-QT) kinematics, obtained via energy and momentum conservation in the hypothesis of an equal sharing of the excitation energy by the two collision partners, is shown by the dashed line dag . We can see that for all calorimetrically reconstructed excitation energies, and for both Z1 cuts, the observed behavior is compatible with purely binary collisions. This comparison shows that also the lighter Z1’s, corresponding to constant size QP remnants, do not come from central reactions.

This discussion implies that we can safely consider the data as characteristic of the de-excitation of constant size source in a wide range of excitation energies.
Let us now come to the central question of data sorting. The global distributions of Fig. 3 reflect the excitation energy deposit imposed by the dynamics of the entrance channel, and cannot be considered as belonging to a single statistical ensemble. If a sorting cannot be avoided, it is also clear that the shape of the distributions will depend on the sorting choice.
The two de-excitation modes visible in Fig. 3 are associated to very different excitation energies. If they represent two different phases, this means that the associated phase transition should have a non zero latent heat, as it is the case for regular liquid-gas. Therefore, the sorting variable should not impose a too strong constraint on the deposited energy, such that the two phases can be accessed in the same bin. In particular, in the liquid-gas phase transition, Z1 is known to be bimodal in the canonical ensemble which allows huge energy fluctuations, while no bimodality is observed in the microcanonical ensemble with fixed energy PRE .
To search for a possible bimodal behavior, we should then in principle sort the data in temperature bins, i.e. in canonical ensembles. This is not possible experimentally, but we can choose a sorting variable as close as possible to a canonical temperature. Moreover, as suggested by previous papers indra ; rivet , the sorting observable should better not be auto-correlated with fragments and light particles emitted by the QP source. To fulfill these requirements, as in indra , the transverse energy Et12 = of the light particles () emitted by the quasi-target source has been chosen, which is only loosely correlated to the QP observables. The QT had been much larger than the QP, this sorting could be considered as a canonical one. This is not our case, but it has still the advantage to allow for relatively large energy fluctuations, as it is needed to explore two phases that could be separated by a non zero latent heat.

It has to be noted that efficiency limitations for fragments in the backward direction do not allow to have a total reconstruction of the quasi-target source (see Fig. 1). Therefore the selection on QT characteristics can only be performed on light particles; in particular the transverse energy Et12 of these particles is detected with good efficiency. The distribution of Et12 for the selected events is shown in Fig. 5.
This sorting can be assimilated to an impact parameter sorting. The width of the transverse energy bins, equally spaced, was chosen of 40 MeV. Only the first six bins have sufficient statistics to be considered for the subsequent analysis.

The excitation energy constraint implied by this sorting is explored in Fig. 6, which shows the distribution of the calorimetric * in the six transverse energy bins. We can notice from this figure that the variables Et12 and * are loosely correlated, and a relatively wide distribution of * is obtained in most of the bins of transverse energy. It is well known reliability that the calorimetric measurement is not perfect, and the incomplete detection creates a spurious width in the energy distribution. Since this spurious width never exceed 1 MeV per nucleon, it is clear from Fig.6 that the sorting in Et12 bins cannot be considered as a microcanonical selection, where no bimodality would be expected.
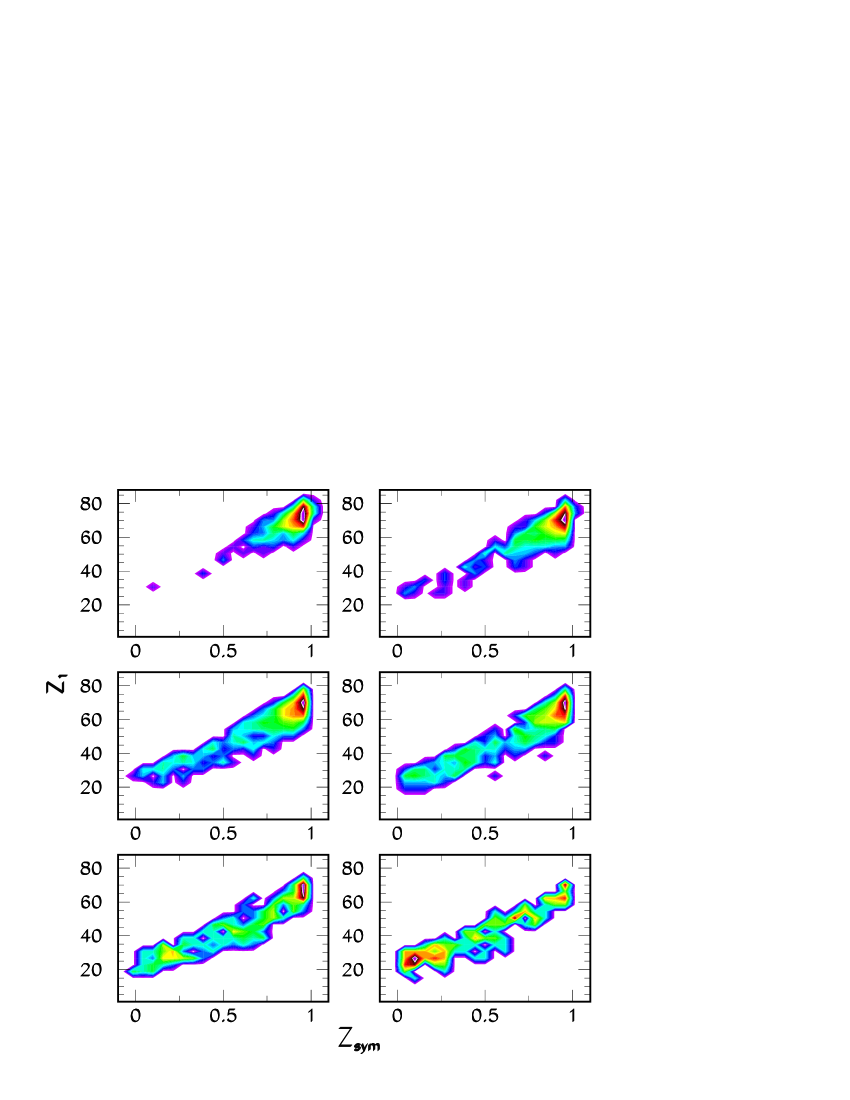
The charge of the heaviest fragment Z1 is represented as a function of the asymmetry Zsym of the two heaviest in Fig. 7. We can see that the maximal probability does not monotonically change with the centrality selection. The most probable fragmentation pattern, characterized by a residue exhausting most of the available charge and an important asymmetry between the two largest fragments, abruptly changes between the fourth and the fifth bin with the apparition of a second peak. This peak represents multifragmentation events, with the largest fragment comparable in size to the other emitted clusters. In the sixth bin this second peak tends to become more prominent, even if the situation would be more clear with higher statistics. Such a discontinuous behavior agrees with the expectations from a phase transition, and with the findings of the INDRA collaboration on peripheral Xe + Sn and Au + Au collisions indra .

Projecting the plots of Fig. 7 onto the two axes, we can note that the best indication of bimodality appears on the Z1 variable (see Fig. 8), whereas the plot of the asymmetry Zsym does not show a clear bimodal behavior (see Fig. 9). The largest fragment size distribution, peaked around 70 up to the fourth bin, shows a maximum around in the sixth bin, passing through a configuration (fifth bin) where a minimum in the probability appears to be associated to the intermediate patterns, even if the statistics should definitely be improved. This strongly suggests a first order phase transition PRE .

The indication of bimodality is less clear in the Zsym variable, which shows a wide distribution in the last bins without any pronounced minimum ( see Fig. 9). However the sudden change in the most probable fragmentation pattern, shown in the bidimensional correlations of Fig. 7, is clearly seen in both variables. The most probable value of Z1 and Zsym is shown in Fig 10 as a function of the transverse energy. Both variables show a sudden decrease from the evaporation dominated pattern, to the multifragmentation dominated one. This behavior is again in agreement with the findings of ref. indra and consistent with the expectation from a phase transition. In principle a first order phase transition should be associated to a discontinuous jump PRE , while a continuous power law behavior would characterize a second order phase transition. This however would be true only if the sorting variable could be assimilated to a thermodynamical temperature. In the microcanonical ensemble, even a first order transition is associated to a continuous behavior of the order parameter. As a consequence, the power law behavior of the average size of the largest cluster as a function of excitation energy (see Fig. 2), can be observed both in the case of a critical behavior and in the coexistence zone of a first order phase transition big ; richert . In the experimental case, the arbitrariness of the sorting and the absence of a physical external bath does not allow to draw definite conclusions.

A better understanding on the nature and order of the observed phase change can be achieved form Fig. 11, which shows the distribution of the largest cluster charge and excitation energy in the Et12 region (fourth + fifth bins) where the sudden change in the fragmentation pattern is observed. As we have already mentioned, a first order phase transition should imply a non zero latent heat, meaning that the two ”phases” observed at the same ”temperature” should be associated to different excitation energies.

We can see in Fig. 11 that indeed the two decay modes observed in the distribution correspond to different values of the calorimetric excitation energy: the cut =50 that roughly identifies the two modes (see Fig. 3) succeeds in splitting the energy distributions into two separate components (right part of Fig. 11), even if the distance of the centroids is too small to produce a clear bimodality in the excitation energy distribution. The lower (higher) component roughly corresponds to a deposited energy higher (lower) than A.MeV (left part of Fig. 11). This behavior is consistent with the expectations from a first order phase transition smoothed by finite size effects.
If we interpret the two distributions as two coexisting phases, it would be tempting to estimate the latent heat of the transition from the energy distance between the two peaks. The ”liquid” peak points to an excitation energy A.MeV which nicely agrees with the global - correlation shown in the left part of Fig. 2, and with the indication of the fluctuation measurement shown in the right part of the same figure. The ”vapor” contribution peaks at A.MeV, a lower value respect to the location of the second divergence in the fluctuation analysis. This discrepancy may be due to the intrinsic limitations of the transverse energy sorting, that does not allow sufficient energy fluctuations respect to a physical heat bath; it may also point to an incomplete exploration of the high energy phase space in our data sample, that cuts the distributions on the high energy side.
To summarize, the results of Fig.11 tend to suggest that the observed sudden change from evaporation to multifragmentation can be associated to first order phase transition. Higher statistics samples obtained with collisions at higher beam energy could allow to be conclusive about the compatibility between fluctuations and bimodality bonnet . In addition a detailed study of the convexity properties of the distributions is needed gul ; bonnet2 .
4 Conclusions
In this paper we have presented a new analysis of the 35 A.MeV quasi-projectile Au+Au data collected with the Multics-Miniball apparatus. The distributions of the largest cluster charge and of the charge asymmetry between the two largest clusters detected in each event have been studied. These data allow to analyze, with a limited statistics, the de-excitation of a constant size quasi-projectile source within a large range of dissipated energy. A clear transition from an evaporative to a multifragmentation pattern has been observed. The shape of the distributions have been studied to search for a possible bimodal behavior, which would allow to interpret this transition in the de-excitation mode as the finite system counterpart of a first order phase transition. The asymmetry distribution does not present a clear structure, while the largest fragment charge appears bimodal.
The same data have shown several different signals that coherently point to a first order liquid-gas-like phase transition. We recall here the determination of thermodynamically consistent critical exponents, both in a moment analysis dag and in an analysis ”à la Fisher” critical , and the fluctuation peak in the partial energy distribution, with an absolute value of fluctuations consistent with the existence of a negative branch for the microcanonical heat capacity reliability ; negative .
Concerning bimodality, the search of a convexity in the distribution of the largest fragment emitted in each collisional event appears a very direct, and therefore interesting signature of a first order phase transition. The intrinsic weakness associated to this signal, namely the arbitrariness in the choice of the sorting variable and of the sorting bin width, will be the object of future investigations gul . To confirm the significance of these findings, it will be important to verify that the dynamics of the entrance channel and the different bias associated to different detectors do not influence the final results. To this aim, the bimodality distributions for systems produced with different entrance channels and detected with different apparatuses should be compared in details. Moreover, the stability of the signals as a function of the different ways of sorting the events should be checked.
In particular, the qualitative trend of the data appears consistent with the recent findings of the INDRA collaboration indra at higher incident energies, but the behavior of the asymmetry variable Zsym is not equivalent in the two data sets and deserves a further analysis.
References
- (1) G.F. Bertsch and P.J. Siemens, Phys. Rev. Lett 126 (1983) 9.
- (2) Ph. Chomaz, The Nuclear Liquid Gas Phase transition and Phase Coexistence, Int. Nucl. Phys. Conference INPC 2001, AIP Proceedings Vol. No. 610, 2002.
- (3) N. Marie et al., Phys. Rev. C 58 (2003) 256; S. Hudan et al., Phys. Rev. C 67 (2003) 064613.
- (4) M. D’Agostino et al., Nucl. Phys. A749 (2005) 55.
- (5) I. Iori et al., Nucl. Instr. and Meth A325 (1993) 458.
- (6) R. T. DeSouza et al., Nucl. Instr. and Meth A295 (1990) 109.
- (7) M. D’Agostino et al., Nucl. Phys. A650, 329 (1999).
- (8) P. Milazzo et al., Phys. Rev. C 58, 953 (1998).
- (9) M. D’Agostino et al., Nucl. Phys. A699 (2002)795.
- (10) J. Pochodzalla et al., Phys. Rev. Lett. 75, 1040 (1995).
- (11) M. D’Agostino et al., Nucl. Phys. A724 (2003) 455.
- (12) M. D’Agostino et al., Phys. Lett. B473, 219(2000).
- (13) Y. G. Ma et al., Phys. Rev. C71 (2005) 054606
- (14) J. B. Natowitz et al., Phys. Rev. C 65, 034618 (2002).
- (15) J. B. Elliott et al., Phys. Rev. Lett. 85, 1194 (2000).
- (16) J. B. Elliott et al., Phys. Rev. C 67 (2003) 024609.
- (17) M. D’Agostino et al., Nucl. Phys. A734 (2004) 512
- (18) M. Bruno et al. Proc. Fifth Italy-Japan Symposium, Naples, November 2004 in G. La Rana, C. Signorini, S. Shimura (Eds.), Recent Achievements and Perspectives in Nuclear Physics, W. Sci. (2005) 209.
- (19) N. Le Neindre et al. Proc. of XL Int. Winter Meeting on Nuclear Physics, Bormio 2002, eds. I. Iori and A. Moroni; B. Guiot, thesis, University of Caen (2002), http://tel.archives-ouvertes.fr/tel-00003753
- (20) M. Schmidt et al. Phys. Rev. Lett. 79, 99 (1997).
- (21) M. Eryürek and M.H. Güven, Physica A (in press)
- (22) F. Gobet et al. Phys. Rev. Lett. 89, 183403 (2002).
- (23) Ph. Chomaz, F. Gulminelli, V. Duflot, Phys. Rev. E 64 (2001) 046114; F. Gulminelli, Ann. de Phys. 29 (2004) 1;
- (24) K. Binder and D. P. Landau, Phys. Rev. B 30, 1477 (1984).
- (25) G. Chaudhuri, S. Das Gupta, nucl-th/0612037
- (26) S. Grossmann and W. Rosenhauer, Z. Phys. 207 (1967) 138; P. Borrmann et al., Phys. Rev. Lett. 84 (2000) 3511; K. C. Lee, Phys. Rev. E 53 (1996) 6558.
- (27) M.S. Challa and J. H. Hetherington, Phys. Rev. Lett. 60 (1988) 77; Phys. Rev. A 38 (1988) 6324; D.H.E. Gross, Microcanonical Thermodynamics: Phase Transitions in Small Systems, Lecture Notes in Physics 66, World Scientific, Singapore (2001).
- (28) O. Lopez and M.F. Rivet, in Dynamics and Thermodynamics with Nuclear Degrees of Freedom, Eur. Phys. J. A 30 (2006) 263.
- (29) M. Pichon et al., Nucl. Phys. A 779 (2006) 267.
- (30) N. Bellaize et al., Nucl. Phys. A 709 (2002) 367.
- (31) X. Campi, J. Phys A 19 (1986) 917; R. Botet, M. Ploszajczak, Phys. Rev. E 62 (2000) 1825.
- (32) J. F. Lecolley et al., Nucl. Instr. and Meth. A 441 (2000) 517.
- (33) J. Colin et al., Phys. Rev. C 67 (2003) 064603.
- (34) N. Leneindre et al., (to be published).
- (35) E.Bonnet, PhD thesis, Universite’ Paris VI, 2006, http://tel.archives-ouvertes.fr/tel-00121736.
- (36) M. D’Agostino et al., Proc. of XXXVIII Int. Winter Meeting on Nuclear Physics, Bormio 2002, Ric. Sci. Univ. Perm. 116 (2000) 386 ; Proc. of Bologna 2000: Structure of the Nucleus at the Dawn of the Century, G.C. Bonsignori, M. Bruno, A. Ventura, D. Vretenar (eds.), World Sci. 2001, 215.
- (37) F. Gulminelli and Ph. Chomaz, Phys. Rev. C 71 (2005) 054607.
- (38) J. P. Bondorf, A. S. Botvina, A. S. Iljinov, I. N. Mishustin, K. Sneppen, Phys. Rep. 257 (1995) 133.
- (39) M. F. Rivet et al., nucl-ex/0205010 - IWM2001 Int. Work. on Multifragmentation and related topics, Catania, nov. 2001; B. Borderie, J. Phys. G : Nucl. Part. Phys. 28 (2002) R217.
- (40) J.Carmona et al, Nuclear Physics A 643 (1998) 115.
- (41) F. Gulminelli, in preparation.
- (42) E.Bonnet, B.Borderie et al., in preparation.