Polarization and relaxation of radon
Abstract
Investigations of the polarization and relaxation of 209Rn by spin exchange with laser optically pumped rubidium are reported. On the order of one million atoms per shot were collected in coated and uncoated glass cells. Gamma-ray anisotropies were measured as a signal of the alignment (second order moment of the polarization) resulting from the combination of polarization and quadrupole relaxation at the cell walls. The temperature dependence over the range 130∘C to 220∘C shows the anisotropies increasing with increasing temperature as the ratio of the spin exchange polarization rate to the wall relaxation rate increases faster than the rubidium polarization decreases. Polarization relaxation rates for coated and uncoated cells are presented. In addition, improved limits on the multipole mixing ratios of some of the main gamma-ray transitions have been extracted. These results are promising for electric dipole moment measurements of octupole-deformed 223Rn and other isotopes, provided sufficient quantities of the rare isotopes can be produced.
pacs:
32.10.Dk, 11.30.-j, 23.20.En, 23.20.GqAn electric dipole moment (EDM) is a T-violating separation of charge along the spin of a system such as the neutron, an atom, or a molecule. Assuming CPT symmetry, EDM measurements probe CP violation in the Standard Model and beyond. An atomic EDM would arise as a result of the presence of CP-odd fundamental interactions that affect physics at the atomic scale. Possible examples include the vacuum expectation value of the gluon field (), fundamental quark and electron EDMs, CP-odd four-quark interactions Barr93 , and the Weinberg 3-gluon interaction Barr93 ; Wein89 . The search for permanent EDMs has implications for many areas of beyond-the-Standard-Model physics. The expanded particle spectrum introduced by supersymmetric theories increases the number of diagrams contributing CP-violating phases Abel01 . The baryon asymmetry in the universe could be generated by a mechanism that requires CP violation beyond that contained within the Standard Model SMCPNN that could be revealed by EDM measurements.
Isotopes featuring octupole deformation or vibrational strength, such as 223Rn and 225Ra, are expected to exhibit a large enhancement to their sensitivity to a CP-violating EDM Spev97 ; Enge00 . Calculations estimate that the octupole deformation of 223Rn makes it approximately 400 times more sensitive to CP violation than 199Hg Spev97 , which currently sets the best limits on several mechanisms of CP violation. With a limit on the 199Hg EDM of Roma01 , a measurement of the 223Rn EDM with a sensitivity of 10 would significantly improve sensitivity to CP violation. NMR techniques have proven effective in making sensitive EDM measurements of some of the lighter noble gases Rose01 , but they have never been applied to EDM measurements of small amounts of short-lived radon isotopes. In anticipation of high production rates at TRIUMF’s ISAC ISAC04 and future facilities, a 209Rn source was developed at the Stony Brook Francium Lab Sims96 . Although the polarization of 209Rn and 223Rn has been demonstrated Kita88 , measurements had been made at only one cell temperature. Both 209Rn (I=5/2, T1/2=28.5 min) and 223Rn (I=7/2, T1/2=23.2 min), when polarized in a glass optical pumping cell, are expected to have similar quadrupole interactions with the cell walls. Thus 209Rn provides an appropriate system for the study of polarization and relaxation processes.
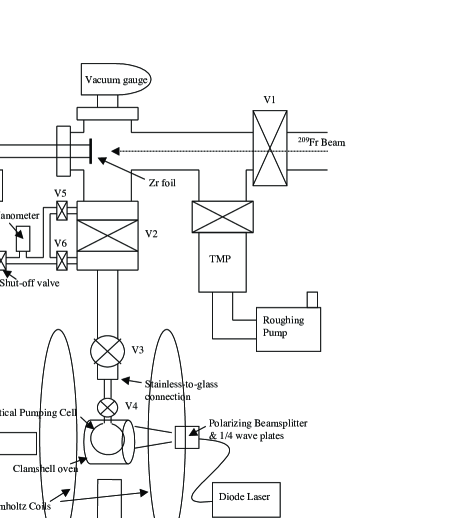
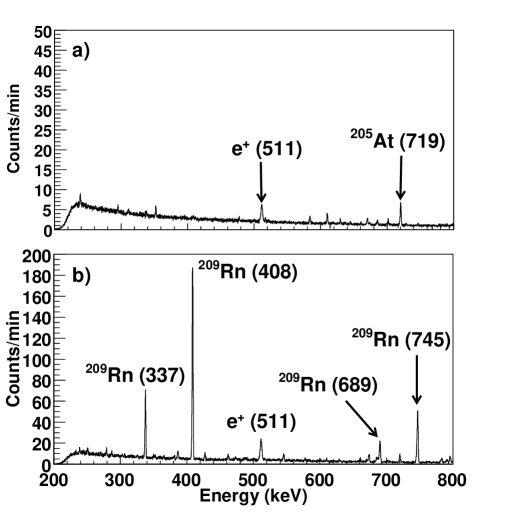
A beam of 16O incident on a gold target generated francium isotopes that were accelerated to 5 keV, electrostatically focussed, and implanted in a zirconium foil (see Fig. 1). Accelerating the 16O beam to around 91 MeV optimized the production, through the reaction 197Au(16O,4n), of 209Fr (T s), which has an 11% branching ratio for electron capture decay to 209Rn. The francium was implanted for about two half-lives of 209Rn. While there was some shielding between the foil and the detectors, the activity at the foil could still be monitored during implantation. For example, the 719 keV line in the upper panel of Fig. 2 indicates 205At in the foil, the product of 209Fr -decay (89% b.r.). After implantation, the radon was transferred to the optical pumping cell, which had been preloaded with rubidium, by simultaneously immersing the cell in liquid nitrogen and heating the foil to about 1000∘C with the chamber isolated from the beamline and pumps. At this temperature, radon rapidly diffused out of the foil Warn05 . Valve V2 was then closed and about one atmosphere of nitrogen was added to the cell to act as a buffer gas, preventing radiation trapping. The cell was then isolated from the rest of the vacuum system by shutting valve V4, and a two-piece glass oven was placed around it, allowing it to be heated to a desired temperature. Up to about one million 209Rn atoms were transferred to the cell in each cycle. In the first of two runs, discussed in Ref. Tard07 and designated Run 1 in this letter, data were taken for an uncoated cell at temperatures ranging from 150 to 200∘C. In Run 2, data were obtained for an uncoated cell from 150 to 220∘C and for a cell coated with octadecyltrichlorosilane (OTS) Otei90 from 130 to 180∘C.
The decay of polarized 209Rn results in the emission of 209At gamma rays with an angular distribution dependent on the alignment, i.e. the second moment of the nuclear sublevel population distribution resulting from temperature-dependent polarization and relaxation processes. The cell was placed in a uniform magnetic field of about 10.5 gauss and illuminated by circularly polarized laser light from a Coherent diode laser system tuned to the Rb-D1 line. This polarized the rubidium, and spin-exchange collisions Walk97 transferred the valence electron polarization to the 209Rn nuclei. The resulting angular distribution of gamma rays was monitored by HPGe detectors: a Eurisys Clover at 0∘ (4 crystals, each with 25% internal efficiency relative to NaI) and a 100% Ortec detector at 90∘ in Run 1, and two 100% Ortec detectors at both 0∘ and 90∘ (placed about two inches from the cell) in Run 2. The data from the individual crystals in the Clover detector were summed in a way that allowed it to be viewed as one large crystal. Data were also taken with the laser off in order to determine the unpolarized baseline rates at each detector and temperature. Earlier studies of the wall interactions of the spin-3/2 isotope 131Xe Wu90 indicated reduced quadrupole relaxation in uncoated cells, which motivated the study of both coated and uncoated cells in these runs.
In order to extract information on polarization and relaxation, an optical pumping/spin-exchange model was developed to find the radon steady-state nuclear sublevel populations Tard07b . The rubidium polarization is calculated by numerical integration of laser-light absorption in the cell with the Rb-Rb spin destruction rate from Ref. Bara98 and the rubidium number density given by Alco84
| (1) |
following the method detailed in Ref. Wags89 . At low temperatures, the rubidium is almost completely polarized as optical pumping overcomes all spin destruction processes. At higher temperatures, increased spin destruction with increased [Rb] leads to a decrease in the polarization due to limited laser power. The resulting radon polarization results from the interplay of processes whose effects can be parameterized by three main rates: the rubidium-radon spin-exchange rate , the radon dipole relaxation rate , and the radon quadrupole relaxation rate . The spin-exchange rate is dependent on the spin-exchange cross section and the cell temperature through the equation
| (2) |
in which the temperature dependence enters through [Rb] and the velocity-averaged rate constant . Quadrupole relaxation () has been shown to be much stronger than dipole relaxation () in 131Xe and 21Ne Wu90 ; Chup90 . Thus, is set to zero in the model. Wall relaxation is modeled by an Arrhenius-type temperature dependence Happ72 , i.e.
| (3) |
where is the binding energy of the radon to the cell wall. The set of rate equations for the populations of the six nuclear sublevels of 209Rn are written in terms of the rubidium polarization, , and , and an analytic equation for the steady-state sublevel populations is obtained. Selection rules are used to calculate the sublevel populations of the 209At populated by electron capture. The angular distribution of the 209At gamma rays depends on the moments of the populations, the spins of the states, and the multipolarity of the transitions Tolh53 . Table 1 includes the multipole mixing ratios () of the four prominent lines and the spin transitions involved. Following the convention of Ref. Hart54 , =aa, where a in a pure dipole transition, a in a pure quadrupole transition, and aa. The angular distributions are expressed as a function of , , , and for each cell temperature under consideration.
The 337, 408, and 745 keV lines were studied in detail. The 689 keV line could not be reliably extracted from the spectra due to the proximity of a gamma-ray line resulting from 209At decay. The anisotropy for each gamma ray is given by the ratio
| (4) |
where is the background-corrected ratio of counts in the photopeak at the 0∘ detector to counts in the 90∘ detector calculated for data with the laser on (LON) and with the laser off (LOFF). The 337 and 745 keV lines show anisotropies that are consistent with those measured in Ref. Kita88 . The uncoated-cell 408 keV line (not shown here) shows no statistically significant anisotropy, also consistent with Ref. Kita88 .
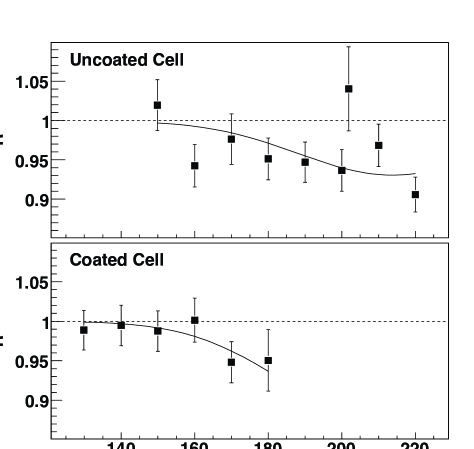
The solid lines in the figures were generated using the optical pumping/spin-exchange model. In Fig. 3, data for the 337 keV line are shown. Since is known for this transition, the data can be used to extract the relaxation rate , assuming values for and . For , the estimate calculated by Walker Walk89 () was used. An estimate for (400) was made based on the 131Xe measurements reported in Ref. Wu90 . For the 337 keV data, best-fit values for of Hz for the uncoated cell and Hz for the coated cell were found. These fits are displayed as the solid lines in Fig. 3. There are multiple ways to generate temperature-dependent angular distributions that agree with the data using different values of , , and , so the current data do not allow best fit values for all three parameters simultaneously.
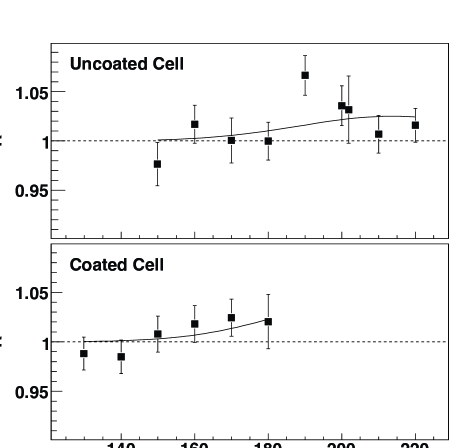
With the polarization and relaxation parameters fixed by the 337 keV data, the 745 keV and 408 keV data can be fit for . The uncoated-cell 745 keV data allow (95% C.L.) values of in the ranges and . Previous measurements ToI8 exclude the range , and this work significantly improves that constraint. A similar analysis for the uncoated-cell 408 keV data allows the range (95% C.L.). This establishes an upper limit of . The coated-cell data provide much weaker constraints. These results are not very sensitive to the values of , , or to knowledge of the cell temperature and laser power. For example, if the temperature were ten degrees lower than indicated, the limit for the 745 keV transition would become . With a change of temperature in the model, the best-fit value of changes significantly to offset changes in the temperature-dependent values of the rubidium polarization and the spin-exchange rate. The best fit () is plotted for the 745 keV line in Fig. 4.
| Eγ | Iγ | Spin | ||
|---|---|---|---|---|
| (keV) | (%) | Transition | (Ref. ToI8 ) | (this work) |
| 337.45 | 14.5 | 7/27/2 | - | |
| 408.32 | 50.3 | 7/29/2 | 0 | 0.68 |
| 689.26 | 9.7 | 7/27/2 | 3.57 | - |
| 745.78 | 22.8 | 7/29/2 | 2.86 | 10.9 |
In summary, radon has been collected and polarized in a glass cell, the temperature dependence of anisotropies has been measured, and new constraints have been set on the multipole mixing ratios for 209At transitions. These results are significant for an EDM measurement being planned at TRIUMF. The ISAC facility is expected to produce 223Rn at a rate of , more than 1000 times the rates for this work. At this rate, after two half-lives of implantation in a zirconium foil, approximately 500 million radon atoms will have been collected. The precession frequency of polarized radon in an electric field is proportional to the EDM, . The expected uncertainty in , when measured using the anisotropy signal, is
| (5) |
where E is the magnitude of the electric field, is the coherence time of the polarization, is the analyzing power of the measurement (i.e., the change in the signal due to a change in polarization), is the total number of photons detected, and is the fraction of those photons due to background. Using 30 s, based on the uncoated-cell relaxation time, and , which are consistent with this work, and 5 kV/cm Rose01 , a sensitivity of better than is possible with gammas. Assuming a factor of 400 greater sensitivity for 223Rn, this would improve sensitivity to sources of CP violation by an order of magnitude or more compared to the limits set by the 199Hg measurements.
Acknowledgements.
This work was supported by the U. S. National Science Foundation, the Department of Energy, and the Natural Sciences and Engineering Research Council of Canada.References
- (1) S. M. Barr, Int. J. Mod. Phys. A 8, 209 (1993).
- (2) S. Weinberg, Phys. Rev. Lett. 63, 2333 (1989).
- (3) S. Abel, S. Khalil, and O. Lebedev, Nucl. Phys. B 606, 151 (2001).
- (4) A. G. Cohen, D. B. Kaplan, and A. E. Nelson, Ann. Rev. Nucl. Part. Sci. 43, 27 (1993).
- (5) V. Spevak, N. Auerbach, and V. V. Flambaum, Phys. Rev. C 56, 1357 (1997).
- (6) J. Engel, J. L. Friar, and A. C. Hayes, Phys. Rev. C 61, 035502 (2000).
- (7) M. V. Romalis, W. C. Griffith, J. P. Jacobs, and E. N. Fortson, Phys. Rev. Lett. 86, 2505 (2001).
- (8) M. A. Rosenberry and T. E. Chupp, Phys. Rev. Lett. 86, 22 (2001).
- (9) M. Dombsky, P. Bricault, and V. Hanemaayer, Nucl. Phys. A 746, 32c (2004).
- (10) J. E. Simsarian et al., Phys. Rev. Lett. 76, 3522 (1996).
- (11) M. Kitano et al., Phys. Rev. Lett. 60, 2133 (1988).
- (12) T. Warner et al., NIM A 538, 135 (2005).
- (13) E. R. Tardiff et al., NIM A (to be published).
- (14) E. R. Oteiza, Ph.D. Thesis, Harvard University (unpublished).
- (15) T. G. Walker and W. Happer, Rev. Mod. Phys. 69, 629 (1997).
- (16) Z. Wu, W. Happer, M. Kitano, and J. Daniels, Phys. Rev. A 42, 2774 (1990).
- (17) E. R. Tardiff (in preparation).
- (18) A. B. Baranga et al., Phys. Rev. Lett. 80, 2801 (1998).
- (19) C. B. Alcock, V. P. Itkin, and M. K. Horrigan, Can. Metal. Quart. 23, 309 (1984).
- (20) M. E. Wagshul and T. E. Chupp, Phys. Rev. A 40, 4447 (1989).
- (21) T. E. Chupp and R. J. Hoare, Phys. Rev. Lett. 64, 2261 (1990).
- (22) W. Happer, Rev. Mod. Phys. 44, 169 (1972).
- (23) H. A. Tolhoek and J. A. M. Cox, Physica 19, 101 (1953).
- (24) C. D. Hartogh, H. A. Tolhoek, and S. R. de Groot, Physica 20, 1310 (1954).
- (25) T. G. Walker, Phys. Rev. A 40, 4959 (1989).
- (26) Table of Isotopes, 8th edition, edited by V. S. Shirley, (John Wiley & Sons, Inc., New York, 1996), Vol. II, pp. 2598-2600.