Vertex Reconstruction
Using a Single Layer Silicon Detector
Abstract
Typical vertex finding algorithms use reconstructed tracks, registered in a multi-layer detector, which directly point to the common point of origin. A detector with a single layer of silicon sensors registers the passage of primary particles only in one place. Nevertheless, the information available from these hits can also be used to estimate the vertex position, when the geometrical properties of silicon sensors and the measured ionization energy losses of the particles are fully exploited. In this paper the algorithm used for this purpose in the PHOBOS experiment is described. The vertex reconstruction performance is studied using simulations and compared with results obtained from real data. The very large acceptance of a single-layered multiplicity detector permits vertex reconstruction for low multiplicity events where other methods, using small acceptance subdetectors, fail because of insufficient number of registered primary tracks.
keywords:
vertex reconstructionPACS:
07.05.Kf , 25.75.-q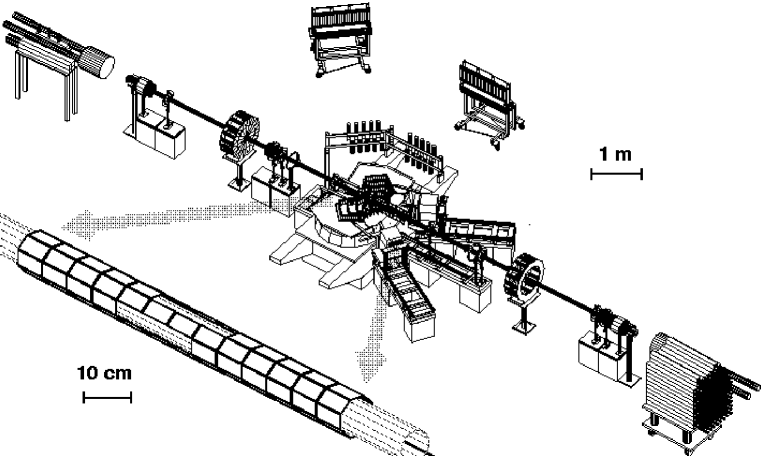
1 Introduction
An aspect of the events recorded at the Relativistic Heavy Ion Collider (RHIC) critical for all subsequent data analyzes is the position of the collision vertex of high energy protons or nuclei. In RHIC experiments, the vertex positions are distributed along the beam axis in a range as large as 2 m about the nominal center of the apparatus, with a transverse spread smaller than 1 mm. The PHOBOS detector [1] includes several subsystems which are used also for determinations of the vertex position: the trigger system, the two arm multi-layer spectrometer for measuring charged particles trajectories, the vertex detector consisting of two layers of silicon sensors and the multiplicity detector measuring charged particles. Most of the active elements of the PHOBOS detector employ silicon sensors described in detail in [2].
The standard vertex reconstruction algorithms in PHOBOS enable either a full 3-dimensional reconstruction of the vertex using the information from the spectrometer, or a more precise determination of two coordinates (along the beam and in the vertical direction) with the help of the vertex detector [3]. However, the range of reconstructed vertex positions along the beam axis, , for which these detectors are effective, corresponding to 50 cm to +10 cm for the spectrometer, and 15 cm to +15 cm for the vertex detector, does not always include all collision points. These two subdetectors have very limited geometrical acceptances (1% and 5% for spectrometer and vertex detector, respectively) and they register very few primary particles in the events with low multiplicities. The efficiency of vertex reconstruction in d+Au and especially in p+p collisions is thus insufficient [3]. The octagonal multiplicity detector, (), that surrounds the beam pipe and extends 55 cm from the nominal interaction point, covers a much larger geometrical acceptance of 50% (see Fig. 1). This detector consists of a single layer of silicon sensors arranged parallel to the beam, which record the energy loss of charged particles. As we show in this paper a single hit from a primary particle provides enough information for a crude estimation of the vertex position along the beam line. With a larger number of such hits the vertex position can be calculated with an uncertainty of the order of 1 cm. The very large acceptance of the detector makes this method very efficient even for events with small multiplicities.
2 Estimation of the vertex position from a single hit
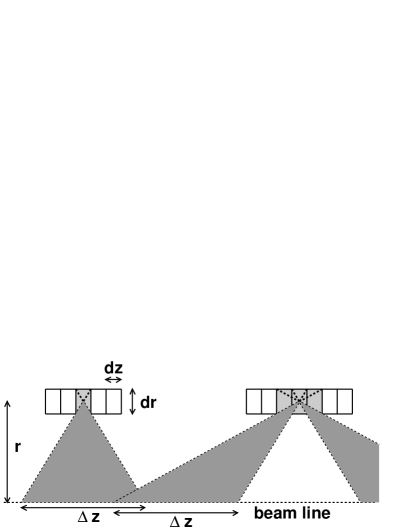
Silicon sensors of the , placed along the beam line, register primary particles emitted and thus entering the silicon at many different angles. The properties of the hits depend on emission angle and thus on the distance of the hit from the primary vertex, as shown in Fig. 2. A signal in an isolated pad can be left only by a particle emerging from a collision that occurred within a range of given by = 2 / , where is the transverse distance from the beam axis to the pad, is the length of the pad in , and is the pad thickness. For the multiple-pad hits, left by particles emitted at smaller angles, there exist two ranges of possible vertex positions. A signal in a single pad gives an unambiguous vertex position estimate with an error of approximately = . For multiple-pad hits a similar estimate is possible only if we can select the correct vertex range. The sensors of the are placed close to beam, at =4.5 cm, but the pad dimensions, =0.27 cm and =0.033 cm, are such that the geometrical approach is not precise enough (=15 cm).
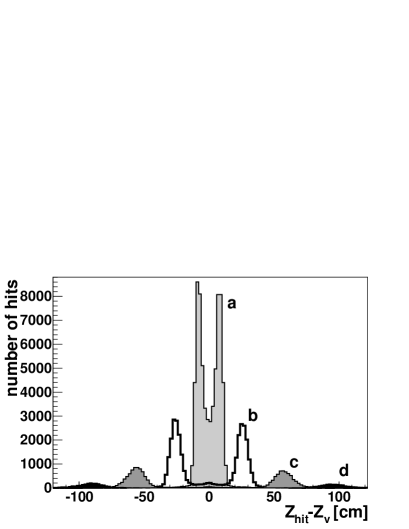
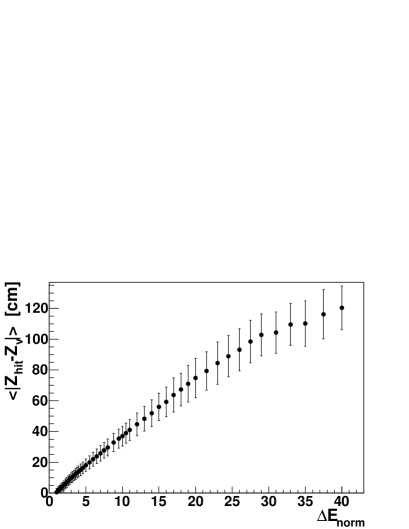
The silicon sensors used in the PHOBOS detector register not only the passage of the charged particles but also the deposited energy, which is proportional to the length of the trajectory in the silicon. This track length in the silicon sensors depends on the particle emission angle, and thus the distance of the hit from the collision vertex is correlated with the deposited energy. In Fig. 3 we present several histograms of for hits left by primary particles, obtained for several fixed values of the deposited energy loss. They were obtained using GEANT [4] simulations of the real detector, with accurate calculations of ionization energy losses, but in which effects of electronics noise, energy sharing between pads, digitization and merging of signals from different particles were not included. In order to correct for varying thickness of the silicon sensors we are using the normalized energy loss =/, where is the actual deposited energy and is the energy loss for a minimum ionizing particle at normal incidence. The hit position distributions are double-peaked, and these two peaks are separating when the energy of the hit increases. Such histograms were used to determine the dependence of the distance on the energy loss shown in Fig. 4. The hits from particles registered even at 100 cm from the vertex can be used to estimate the vertex position. The uncertainty of this energy loss based extrapolation from a single hit is always smaller than the one obtained from the simple geometrical arguments described at the beginning of this section, and for large fraction of hits it is less than 3 cm. The main contribution to this error is the effect of Landau fluctuations on the energy loss measurements.
In the analysis of the real data we first reconstruct the hits and their energy loss from measured signals. For rejection of noise we apply a threshold of 0.4 , i.e. up to about three times the typical noise level. A signal in a single, isolated pad is then accepted as a hit when it exceeds 0.6 , while neighboring pads with signals are merged along the beam direction into a multi-pads hit. Each multi-pad hit has an energy larger than 0.6 , but hits with three or more pads are tested more precisely. A primary particle producing such a hit traverses the whole width of the middle pads (0.27 cm) and leaves there a signal much larger than . It is thus required that at least 40% of the expected mean energy loss is registered in each of the middle pads of the hit.
3 Calculation of the vertex position
In the first step of the vertex reconstruction procedure we find the hits and calculate their energy loss signals. Due to the presence of background hits, a simple weighted mean of vertex position estimates will not be accurate, even if the sign of the distance to the vertex is correctly guessed for each hit. More appropriate is a maximum likelihood method using a probability function of one variable, . We have implemented two methods using different functions. The values of these functions are calculated for many points along the beam line to find the most likely vertex position.
In the first method, at each tested vertex position the energy loss registered in the silicon is for all hits rescaled to the energy loss expected for a particle traversing the thickness of the sensor. The hit is accepted when this energy is between 0.8 and 1.25 and the number of accepted hits is counted. Neglecting background hits, this function at the vertex should be equal to the number of primary particles with hits.
In the second method, histograms of , obtained for fixed values of energy loss (like these shown in Fig. 3), define appropriately normalized and parameterized probability density functions . We are using 40 functions of , obtained for 40 different values. In order to speed up calculations, they are approximated piecewize by linear segments. Parameters of these approximations are interpolated for intermediate values. Then, at each tested hypothetical vertex position, a product, , of the values of this probability density function for all hits is calculated. The hits with very small probabilities (or with =0) are usually due to background particles. While factors of zero should be avoided in the product of probabilities, it is important not to neglect the background in the calculation of . In order to treat all background hits in a consistent way, all small values are rounded up to (about 5% of the maximal probability). In tests with smaller values, vertex reconstruction results were very similar. The product contains factors for all hits: values for background hits and larger (but not identical) values for hits regarded to be from primaries. Usually values appear many times at all considered positions, thus in our calculations we neglect the same, largest common number of them. In this way we reduce the time consuming operations and avoid numerical problems with multiplication of a large number of very small values (underflow).
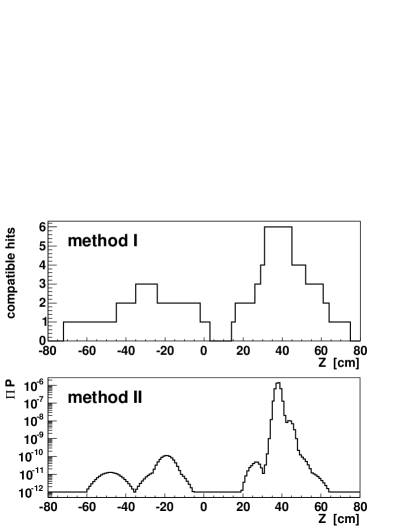
In both methods, the calculated values of probability function for each hypothetical vertex position are collected in histograms similar to those shown in Fig. 5. The maximum of each histogram is close to the actual position of the vertex. When the true vertex is far from =0, there is usually a second, wider maximum at the opposite side, such as those in Fig. 5 at =30 cm (top histogram) or =20 cm (bottom histogram), due to grouping of the estimates of the vertex position at the wrong side of the hit. Finding the vertex position is more difficult for events from either real data, or from simulations that include secondary particle generation. The hits from background can enhance the second maximum or produce another one while the main maximum becomes wider and lower because of the noise. Therefore we must not accept the position of the maximum as a reliable vertex, when it comes from very few hits or when there is a second maximum of similar height. The selection of the cuts is a compromise between efficiency and purity of the accepted vertices. The second method described above was found to be more efficient and accurate, and only the performance of this method is presented in the next sections.
4 Efficiency and accuracy of the vertex reconstruction algorithm
The properties of the vertex finding algorithm were studied using Monte Carlo simulations, based on the GEANT [4] package, with production of secondary particles and including all detector effects (geometrical acceptance, electronics noise, digitization and calibration). The collisions of Au+Au, Cu+Cu, d+Au and p+p at energies measured with the PHOBOS detector were simulated with the vertex positions over a range of 120 cm, which substantially exceeds the span of the (55 cm).
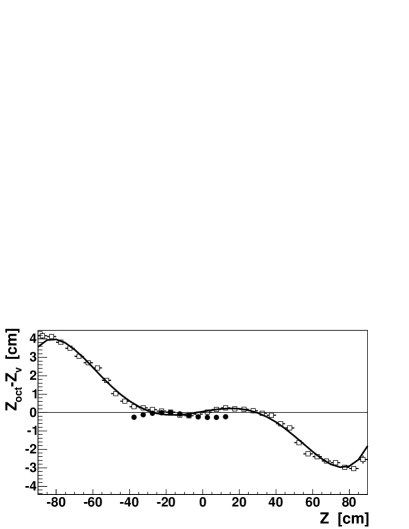
The vertex reconstruction algorithm relies on the parameterized probability function extracted from simulations of the response from primary particles. These are derived from energy loss values not affected by secondary processes or detector noise, thus a bias in the estimate of the vertex position, , is very probable. Fig. 6 shows that is systematically shifted towards the center of the detector, in the direction where more hits are registered. Hits from secondary particles, which usually traverse silicon sensors at angles larger than the primaries (in the same part of the detector), tend to attract the reconstructed vertex. Also for the hits from these primary particles, which traverse 2 pads, the signal in one pad may be lost when the pad is defective or may be rejected as noise if it is smaller than 0.4 . These effects result in an underestimate of the distance of the hit from the vertex. It is also possible, that the parameterization is responsible for part of the bias. The observed bias is relatively small in the most useful range <40 cm and is very similar for events with different multiplicities. Rather than trying to remove it by modifications of the algorithm, we apply a universal correction using the curve from Fig. 6. This bias correction is tested in Fig. 6 for real events by comparing the vertex, , with the vertex precisely determined using tracks found in the spectrometer, . We observe a small systematic difference between the true and reconstructed vertex position which will be discussed later.
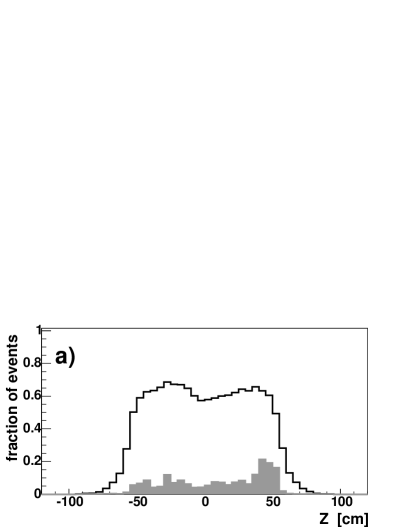
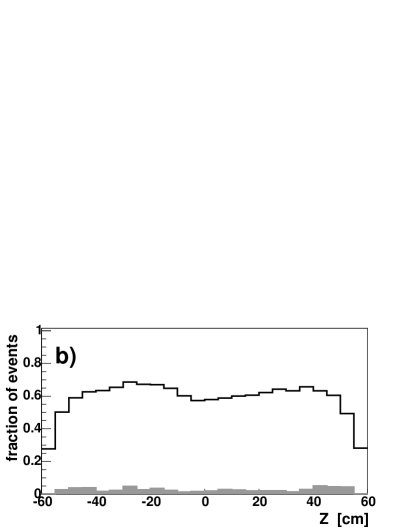
In the analysis of the vertex reconstruction efficiency we start with the most difficult case - the sample of p+p collisions which has the smallest mean multiplicity of produced particles. The vertex reconstruction algorithm finds the vertices in about 60% of events in the range 60 cm (Fig. 7). For some of the events with the real vertex outside this acceptance range a false vertex is found, especially at positive . There are more background hits registered, mostly from secondary particles produced in the coils and the yoke of the PHOBOS magnet [1]. Such events can be rejected by restricting the vertex range using information from the trigger counters. If the true vertex range is limited to 60 cm the fraction of additional events with wrong vertex drops below 3% (Fig. 7b).
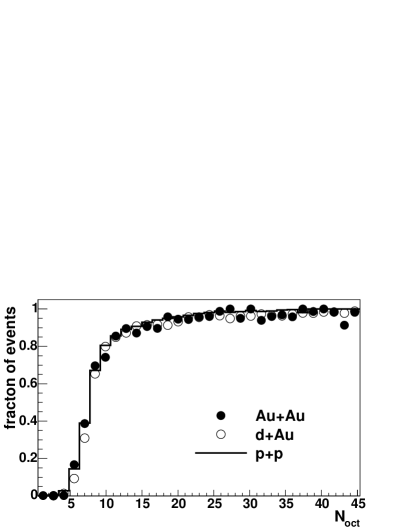
The vertex reconstruction performance depends on the event multiplicity and a pertinent parameter is the number of charged primary particles leaving hits in the , . It is equal to about 50% of the total number of charged primaries. In Fig. 8 we can see that the algorithm is over 95% efficient if is greater than 15 and the efficiency drops with decreasing multiplicity down to zero for < 4. This dependence is very similar for all types of collisions. A slight difference can be noticed only for d+Au collisions, which have non-symmetric rapidity distribution.
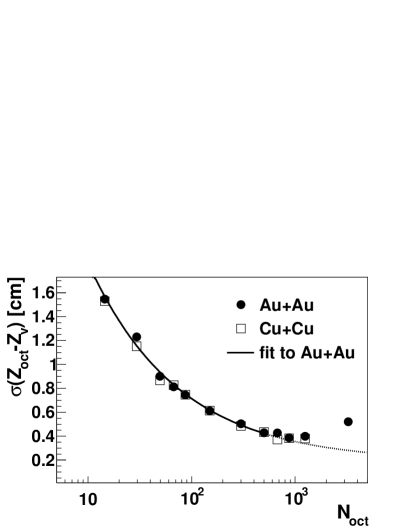
The error of the reconstructed vertex position, presented for two types of collisions in Fig. 9, also depends on event multiplicity. It is fitted for <500 and then extrapolated as = 0.19 + 5.26 / . The value of the second parameter of the fit, 5.26, is consistent with obtained for single hits at fixed energy loss (Fig. 4). For the highest multiplicities, >1000, the vertex position error deviates from the extrapolation of the fit and even increases. This effect is due to high detector occupancy, as at large multiplicities the chance that two particles hit the same or neighbor pads increases. In such cases, a common hit with twice the energy loss is formed and the algorithm incorrectly estimates the distance of this hit from the vertex. Fortunately, for events with such large multiplicities we are able to reconstruct the vertex using more precise, track based methods [3].
| Colliding | Correct | Wrong | Error | ||
|---|---|---|---|---|---|
| System | [GeV] | vertex | vertex | ||
| Au+Au | 200 | 619 | 94.5% | 0.4% | 0.58 cm |
| Au+Au | 19 | 252 | 91.8% | 0.4% | 0.69 cm |
| Cu+Cu | 200 | 198 | 90.5% | 0.5% | 0.64 cm |
| d+Au | 200 | 39 | 87.6% | 0.7% | 1.03 cm |
| p+p | 200 | 9 | 58.6% | 2.6% | 1.63 cm |
The performance of the vertex reconstruction algorithm for several types of collisions measured by the PHOBOS experiment is summarized in Table 1. For nucleus-nucleus collisions, the vertex finding efficiency is close to 90% and a small (<1%) admixture of events with wrongly reconstructed vertex is accepted. For p+p collisions this admixture grows to 2.6% while the efficiency drops below 60%. The efficiency of precise methods using tracks found in the spectrometer or the vertex detector, is always smaller, especially for the p+p collisions (1.4% and 6.4% respectively), even with the evaluation restricted to narrower vertex range <10 cm, in which these methods should perform best [3]. The average vertex position errors listed in Table I were obtained for full samples of events with reconstructed vertex. They reflect a convolution of the multiplicity distribution in the collisions and the dependence of the error on multiplicity. Interestingly, in the analysis of special simulations without production of secondary particles we find very similar efficiency and accuracy when the same reconstruction procedure is applied. The efficiency for the events without background is even smaller, probably because quite often secondaries following the direction of their parents help to increase the main maximum, which otherwise would not be accepted by the quality cuts. The similarity of results for simulations with and without secondary particle production proves that with the present cuts the reconstruction is not very sensitive to the background.
5 Vertex reconstruction for real data
The accuracy of the reconstructed vertex can be studied not only using Monte Carlo simulations, but also with the real data. In this case we use events in which the vertex was also reconstructed by other methods, for example based on information from the spectrometer, . The vertex position is then determined with much better accuracy, however only for events with large multiplicities (about 50% of Au+Au collisions at =200 GeV). For these events the value of , in a wide range of vertex positions is shown in Fig. 6. There is a systematic difference (about 0.2 cm), which is not removed by the bias correction. It may be due to a weak multiplicity dependence that is neglected in the bias correction, misalignments of the sensors or a difference between the energy loss distributions in the simulations and in the data. The last possibility is most probable, as also the width, , of the distribution is smaller for the real data than for the simulations (about 0.36 cm and 0.45 cm, respectively). A longer tail of the energy loss distribution in the simulations can lead to these differences.
The residual bias observed in the data may be additionally corrected for in the analysis. However, in the low multiplicity events for which the vertex is most useful, such a small correction is hardly relevant, as in this case the vertex reconstruction error is larger than 1 cm.
6 Summary
In this paper we present a novel method of vertex reconstruction using a large acceptance detector with a single layer of silicon sensors. From all algorithms developed for the PHOBOS experiment the method allows to reconstruct vertices in the widest -range and with by far the largest efficiency, however with a significant error of 0.5-2 cm, depending on event’s multiplicity. The more precise algorithms using the information from the spectrometer or the vertex detector are less efficient and in the events with low multiplicity may find a false vertex position. The vertex enables verification of vertices given by other methods or substitutes them when other methods fail. It is extensively used in studies of d+Au [5, 6, 7, 8, 9] and p+p [10] collisions.
Acknowledgments We thank our colleagues, Birger Back and Constantin Loizides, for their help during preparation of the manuscript. This work was partially supported by U.S. DOE grants DE-AC02-98CH10886, DE-FG02-93ER40802, DE-FC02-94ER40818, DE-FG02-94ER40865, DE-FG02-99ER41099, and W-31-109-ENG-38, by U.S. NSF grants 9603486, 0072204, and 0245011, by Polish KBN grant 1-P03B-062-27(2004-2007), by NSC of Taiwan Contract NSC 89-2112-M-008-024, and by Hungarian OTKA grant (F 049823).
References
- [1] B.B.Back et al., Nucl. Instr. Meth. A499 (2003) 603.
- [2] R.Nouicer et al., Nucl. Instr. Meth. A461 (2001) 143.
- [3] K.Wozniak et al., Nucl. Instr. Meth. A566 (2006) 185.
- [4] R. Brun et al., GEANT 3.21, Detector Description and Simulation Tool, CERN Program Library Long Write-up W5013, 1994.
- [5] B.B.Back et al., Phys. Rev. Lett. 91 (2003) 072302.
- [6] B.B.Back et al., Phys. Rev. C 70 (2004) 011901(R).
- [7] B.B.Back et al., Phys. Rev. Lett. 93 (2004) 082301.
- [8] B.B.Back et al., Phys. Rev. C 70 (2004) 061901(R).
- [9] B.B.Back et al., Phys. Rev. C 72 (2005) 031901(R).
- [10] B.B.Back et al., Phys. Rev. C 71 (2005) 021901(R).