PHENIX Collaboration
A Detailed Study of High- Neutral Pion Suppression and
Azimuthal Anisotropy in Collisions at = 200 GeV
Abstract
Measurements of neutral pion () production at mid-rapidity in GeV collisions as a function of transverse momentum, , collision centrality, and angle with respect to reaction plane are presented. The data represent the final results from the PHENIX experiment for the first RHIC run at design center-of-mass-energy. They include additional data obtained using the PHENIX Level-2 trigger with more than a factor of three increase in statistics over previously published results for GeV/. We evaluate the suppression in the yield of high- ’s relative to point-like scaling expectations using the nuclear modification factor . We present the dependence of for nine bins in collision centrality. We separately integrate over larger bins to show more precisely the centrality dependence of the high- suppression. We then evaluate the dependence of the high- suppression on the emission angle of the pions with respect to event reaction plane for 7 bins in collision centrality. We show that the yields of high- ’s vary strongly with , consistent with prior measurements Adcox et al. (2002a); Ackermann et al. (2001). We show that this variation persists in the most peripheral bin accessible in this analysis. For the peripheral bins we observe no suppression for neutral pions produced aligned with the reaction plane while the yield of ’s produced perpendicular to the reaction plane is suppressed by a factor of . We analyze the combined centrality and dependence of the suppression in different bins using different possible descriptions of parton energy loss dependence on jet path-length averages to determine whether a single geometric picture can explain the observed suppression pattern.
pacs:
25.75.DwI Introduction
High transverse momentum particles resulting from hard scatterings between incident partons have become one of the most effective tools for probing the properties of the medium created in ultra-relativistic heavy ion collisions at RHIC. Data from the four RHIC experiments have unequivocally established the phenomenon of high transverse momentum hadron suppression in compared to (appropriately scaled) collisions Adcox et al. (2002b, 2003a); Adams et al. (2003a); Adler et al. (2003a, 2004a); Arsene et al. (2003); Back et al. (2004), while the lack of similar suppression in collisions Adler et al. (2003b); Adams et al. (2003b); Back et al. (2003); Arsene et al. (2003) provides strong evidence that the suppression is not due to modification of parton distributions in the incident nuclei. This suppression has been observed for a large variety of hadron species, at highest for and most recently Adler et al. (2006a) supporting further the notion that energy loss occurs at the parton level. Conversely, direct photon measurements by the PHENIX collaboration show that the yield of hard photons in collisions is consistent with expectations scaled by the number of incoherent nucleon-nucleon collisions Adler et al. (2005a) and, thus, provide final confirmation that hard scattering processes occur at rates expected from point-like processes. This observation makes definitive the conclusion that the suppression of high- hadron production in collisions is a final-state effect. Measurements of azimuthal angle correlations between hadron pairs resulting from fragmentation of hard-scattered partons into jets have provided additional confirmation of final-state medium effects on these partons Adler et al. (2003c).
Predictions of high- suppression were made before the start of RHIC operation Bass et al. (1999) and confirmation of these predictions may be considered one of the key successes of the RHIC program so far. The suppression of high- single hadrons was predicted to result from the energy loss of hard-scattered quarks and gluons in the hot and dense QCD medium created in ultra-relativistic heavy ion collisions (see Gyulassy et al. (2003); Kovner and Wiedemann (2003) and references therein). In the canonical models, medium-induced gluon bremsstrahlung is expected to dominate the energy loss process Wang and Gyulassy (1992), and calculations of the high- suppression factor incorporating this effect have been able to successfully describe the experimental measurements Vitev and Gyulassy (2002); Wang and Wang (2002); Eskola et al. (2005); however, recent measurements of heavy quark suppression pose some questions to this canonical view. Nonetheless, from comparisons of the energy loss calculations with the experimental data, estimates of the initial net color charge density which is usually expressed in terms of a gluon rapidity density, , have been obtained yielding and, assuming thermalization, estimates of the initial energy density have produced values in excess of Gyulassy and McLerran (2005); Wang (2005).
However, in spite of this success, there are still a number of outstanding issues with the interpretation of the high- single-hadron suppression. Since the properties of the medium created in heavy ion collisions are not a priori known, the energy-loss calculations necessarily use the observed suppression to infer initial parton densities, usually through an intermediate parameter that appears in the energy loss calculations. Although the initial parton density obtained by such “tomographic” studies has to be consistent with the final (measured) total particle multiplicity, it is fair to acknowledge that the dependence of the suppression (rather than its absolute magnitude) is a more discriminating observable to test the various energy loss models. For spectra, the suppression in central collisions at GeV is found to be approximately constant with over the range, GeV/. While the different energy loss calculations can reproduce this -independent suppression, the detailed explanation of the constancy is different in each model. The effects invoked to explain the dependence of the observed high- suppression include: finite-energy effects, absorption of energy from the medium, evolution from incoherent (Bethe-Heitler) to coherent (Landau-Pomeranchuk-Migdal or LPM) radiation with increasing parton energy Aurenche et al. (2000), the -dependent mixture of quark and gluon contributions to the hard-scattered parton spectrum, the increasingly larger exponent of the underlying (power-law) parton spectra Eskola et al. (2005), and shadowing/EMC effect Arneodo (1994). While most calculations of the high- suppression in collisions account for shadowing/EMC modifications of the nuclear parton distributions and for the relative mixture of quarks and gluons in the hard-scattered parton spectra, finite-energy corrections, absorption of energy from the medium, and the description of the energy loss process itself differs from calculation to calculation. Clearly the central single-particle spectra are not sufficient, by themselves, to validate or exclude any of the different energy loss models; we must use more “differential” probes of medium-induced energy loss to better understand the phenomenon.
A robust prediction of non-Abelian parton energy loss calculations is that the average energy loss as a function of the in-medium path length shows a quadratic dependence Baier et al. (2000). Such a behavior predicted for a static QCD medium, turns into an effective -dependence in an expanding QGP Gyulassy et al. (2002a). In principle, the centrality dependence of the high- suppression Adler et al. (2003a); Back et al. (2004); Adams et al. (2003a) provides an effective test of energy-loss calculations because the length of the path of the partons in the medium will change between peripheral and central collisions. However, the energy loss calculations also have to account for changes in the initial properties of the medium with centrality and the extra flexibility in the description of the initial conditions means that the measured centrality dependence of the high- suppression also does not stringently constrain energy loss models Drees et al. (2005). However, the path length of the parton in the medium can also be controlled by selecting high- hadrons in different bins of azimuthal angle difference from the event-by-event determined reaction plane. Indeed, shortly after experimental observations of azimuthal anisotropy were reported Adler et al. (2003c); Adcox et al. (2002a), arguments were made that the high- anisotropy in non-central collisions was due to the spatial asymmetry of the medium and the resulting dependence of parton path lengths Gyulassy et al. (2001); Gyulassy et al. (2002b). However, recent analyses have argued that the large azimuthal anisotropies at high cannot be accounted for by energy loss alone – at least when realistic nuclear geometry is used to describe the spatial asymmetry of the initial state Drees et al. (2005); Shuryak (2002); Muller (2003). Some of these analyses were based on a picture of the energy loss process in which quarks or gluons that have emitted radiation effectively disappear from the steeply falling high- spectrum because they are overwhelmed by partons of lower energy that escape from the medium losing little or no energy. In this picture, the medium effectively attenuates the high- quarks and gluons and the high- spectrum is dominated by partons originating near the surface – i.e. partons originating in the “corona” Drees et al. (2005); Shuryak (2002); Muller (2003). Then, the azimuthal anisotropy could be largely determined by the shape of the surface Shuryak (2002). However, it has been separately argued that fluctuations in the number of emitted gluons may be large and such fluctuations may weaken the corona effect Gyulassy et al. (2002a).
In this paper we present measurements of production in GeV collisions from the PHENIX experiment at RHIC. These data, obtained during Run-2 operation of RHIC in 2002, include additional data obtained with the PHENIX Level-2 trigger which improved the total statistics by a factor of 3 compared to the prior analysis in Adler et al. (2003a). The analyses presented here have also benefitted from advanced electromagnetic calorimeter calibrations and from improved understanding of the systematic errors in the measurement in course of the direct photon analysis presented in Adler et al. (2005a), where the decay photons provide the main source of background. With the improved statistics, the reach of the data is extended to higher , allowing us to test whether the suppression starts to diminish above 10 GeV/ in . In addition, we extend the measurement of the centrality dependence of the suppression up to 8 GeV/.
We present measurements of the dependence of the yield as a function of the angle of the with respect to the event reaction plane. By measuring the high- hadron suppression as a function of , for a given centrality bin, we can keep the properties of the medium fixed and vary only the average geometry of the jet propagation in the medium. By comparing different centrality bins we can, in principle, test how the initial properties of the medium affect the induced energy loss. Traditionally, measurements of the dependence of hadron yields have been analyzed in terms of the elliptic flow parameter, , and we note that the data presented here were used to obtain measurements of for comparison to inclusive photon Adler et al. (2006b). However, in this publication we focus not on , but explicitly on the suppression as a function of , expressed in terms of the -dependent nuclear modification factor . While the data presented this way contain, in principle, the same information as the combination of -averaged and , provides a useful alternative way to evaluate the dependence of high- suppression on geometry because it effectively combines and into a single set of data. We analyze the combined and centrality dependence of the high- suppression in the context of different path-length and density dependencies of the parton energy loss process to evaluate whether any geometric picture can simultaneously describe the centrality and dependence of the observed high deficit.
II Experimental Details
The data presented in this paper were obtained during Run-2 operation of the PHENIX experiment Adcox et al. (2003b) at the Relativistic Heavy Ion Collider facility at Brookhaven National Laboratory Hahn et al. (2003). The primary detectors used to obtain the presented results were the PHENIX central arm spectrometers, particularly the electromagnetic calorimeters Aphecetche et al. (2003), and the two beam-beam counters (BBC’s) Allen et al. (2003). In addition, the PHENIX zero-degree calorimeters Adler et al. (2001) were used for triggering and centrality determination.
Two-photon decays of neutral pions were measured in the PHENIX electromagnetic calorimeter, located at a radial distance of 5.1 m from the beam-line, which has a pseudo-rapidity acceptance of and covers radians in azimuth. The electromagnetic calorimeter is divided into eight sectors, with each sector covering the full pseudo-rapidity range and in azimuth. The calorimeter consists of two distinct parts using different technologies. A lead-scintillator sandwich calorimeter (PbSc) with towers covers 3/4 (6 sectors) of the central arm acceptance. A lead-glass Čerenkov calorimeter (PbGl) with towers covers the remaining 1/4 (2 sectors) of the central arm acceptance. The corresponding acceptance of a single tower at is and for the PbSc and PbGl calorimeters, respectively.
The event reaction plane in collisions was measured in the two BBC’s. Each BBC consists of 64 hexagonal, quartz Čerenkov radiators closely packed around the beam pipe, in an approximately azimuthally symmetric configuration. The beam-beam counters, located 144 cm in each direction from the nominal center of the interaction diamond, are used to count charged particles produced in the pseudo-rapidity range . The distribution of particles over the individual channels of the BBC’s allows measurement of the azimuthal distribution, , of charged particles within this pseudo-rapidity acceptance. The BBC’s also provide measurement of the collision vertex position along the interaction diamond with a resolution of 0.6 cm Allen et al. (2003).
The data presented here were obtained using the PHENIX minimum-bias Level-1 trigger, based on the BBC’s and the PHENIX zero-degree calorimeters, that selects of the total hadronic interaction cross-section of 6.9 b Adler et al. (2003a). For a subset of the data, events selected by the Level-1 trigger were subjected to software Level-2 trigger filtering after full assembly of events in the PHENIX event builder Adler et al. (2003d). A software algorithm performed a crude reconstruction of electromagnetic clusters by summing the pedestal-subtracted and gain-calibrated energies of “tiles” made of adjacent calorimeter towers groups. The tiles are allowed to overlap such that every possible such tile that can be constructed in each calorimeter is tested. One of the Level-2 triggers (”LVL2A”) selected events in which at least one cluster (tile) had energy GeV. Another Level-2 trigger (”LVL2B”) selected events in the 50-92% centrality range (50% most peripheral events) with at least one cluster having energy GeV.
The measurements presented in this paper were obtained from 31.4 M minimum bias triggers and approximately 1.7 M Level-2 trigger selected events. Of the Level-2 triggered events, 743 K events were selected by the higher energy LVL2A trigger and the remainder were selected by the peripheral, lower-energy LVL2B trigger. Taking into account their rejection factors, the two triggers sampled the equivalent of 44.4 M (LVL2A) and 28.7 M (LVL2B) minimum-bias triggers, respectively. The difference is due to different online trigger pre-scale factors. Thus, the combined event sample contains approximately a factor of 2.5-3 (considering both triggers over all centralities) more ’s above 6 GeV/ than previously published Run-2 measurements Adler et al. (2003a).
III Data Analysis
III.1 Event Selection and Centrality
In the offline analysis, the timing difference measured between the two PHENIX BBC’s is used to determine the position of the collision vertex along the beam axis and to select events with vertex position within 30 cm of the nominal center of the detector for subsequent analysis. The energies measured in the zero-degree calorimeters and the charged particle multiplicity measured in the BBC’s are used to determine the collision centrality Adcox et al. (2001). For the spectrum measurements presented here the total measured centrality range (0-92.2%) is subdivided into 9 bins: 0-10, 10-20, 20-30, 30-40, 40-50, 60-70, 70-80, 80-92.2%. For the reaction plane dependent analysis, the most central and two most peripheral bins are excluded, the peripheral due to their large uncertainty in the reaction plane resolution, and the 0-10% bin simply because of its smaller intrinsic eccentricity. Additionally, we present also combined 0-20%, 20-60% and 60-92% data sets for comparison with other PHENIX analyses of high hadron production that use such centralities.
III.2 Reaction Plane Measurement

| Centrality | Syst. error | ||
|---|---|---|---|
| 0-10% | 20.3% | ||
| 10-20% | 5.1% | ||
| 20-30% | 3.9% | ||
| 30-40% | 3.8% | ||
| 40-50% | 4.1% | ||
| 50-60% | 4.6% | ||
| 60-70% | 22.5% |
PHENIX has previously published measurements of elliptic flow using an event-by-event measured reaction plane Adler et al. (2006b, 2003e, 2005b), and the same technique is used for the analysis presented here. Each BBC detector consists of 128 quartz radiators placed in hexagonal, roughly concentric rings whose light is individually collected by Photomultiplier tubes (PMT’s). The calibrated charge from each radiator is converted into an estimate for the number of charged particles within the acceptance of each detector, , using the measured single particle peak centroid.
For the reaction plane measurement the measured values are corrected such that the weight of the inner rings which have the fewest radiators covering the full azimuthal angle range is reduced. Then, in terms of the corrected values, , the angle of the reaction plane is obtained from the formula
| (1) |
where represents the azimuthal angle of the center of a given radiator . The subtraction of the average centroid position in Eq. (1) removes the bias in the reaction plane measurement resulting from non-zero angle of the colliding beams, non-uniformities in detector acceptance, and other similar effects. The average is taken over many events localized in time with the event in question. A final correction is applied to remove non-uniformities at the 20% level in the distribution.
Because the above-described procedure can also be applied individually to each BBC, we have a redundant measurement of the reaction plane in the north and in the south, and we exploit this to determine the resolution of the full reaction plane measurement using standard procedures Poskanzer and Voloshin (1998). The resolution of the reaction plane is directly reflected in the quantity where and are the reaction plane angles measured in each of the two beam-beam counters individually and the average is taken over events. Figure 1 and Table. 1 show the variation of this quantity. The needed correction factors can be derived from this using Eq. (11) in Sec. III.6, Measurement, where the reaction plane corrections are described in more detail.
The systematic errors associated with the measurement of the reaction plane come dominantly from how well the resolution is known. The uncertainty on this quantity is also shown with Figure 1 for all but the most peripheral centralities. This error is determined by observing comparison of the similarly calculated quantity which should by definition be equal to zero. The value of is found to be consistent with 0 for all centralities. The mean size of its fluctuations around 0 are compared to the size of the to derive the systematic errors in the table. Since the value of decreases dramatically in the lower multiplicity peripheral events, the relative size of the error increases. The size of this relative error is also cross checked by comparing it to the relative error on elliptic flow () measurements which is directly comparable since, as discussed in Sec. III.6, Measurement, the resolution correction for is a plain multiplicative factor. For the cross check, the error is derived by taking the difference of made with reaction planes from the BBC North and BBC South separately.
Because of the large rapidity gap between the PHENIX BBC’s and the PHENIX Central Arm (), the measurements made in the BBC’s are assumed to have no correlations (except collision geometry) with processes detected in the central arm that would affect the results presented in Sec. III.6, Measurement. Specifically, PYTHIA studies Jia (2006) indicate that any large rapidity-gap production correlated with jets (and thus the hard ś we study) detected in the central arm have a negligible effect on reaction plane determination even for the most peripheral events considered in this paper. Further, we average both the North and South BBC, which are separated by , making potential effects of this nature especially unlikely.
III.3 Neutral Pion Detection
The detection of neutral pions is one of the major sources of information on identified particle production at high at RHIC, and PHENIX has already published the results of a number of measurements in different colliding systems Adcox et al. (2002b); Adler et al. (2003a, f, b, 2004b). Here we will describe the technique for obtaining yields as a function of and centrality, which is now well established within PHENIX.
Neutral pions are detected via their decay channel. Due to the relatively short mean lifetime of neutral pions of about s, typical of electromagnetic decays, the pions decay close to the interaction point ( nm). This makes the decay vertex well known and the pions can be reconstructed via an invariant mass analysis of photon pairs measured by the EMCal.
In the EMCal, hits or clusters are reconstructed by finding contiguous calorimeter towers with pulse heights above the ADC pedestal value. In order to obtain a cleaner sample of electromagnetic hits shower shape cuts are applied to select candidate photons and time-of-flight cuts are applied to reject slow hadrons. For the PbSc we require measured cluster times to be ns where is the straight-line path from the collision vertex to the reconstructed cluster centroid. For the PbGl we require reconstructed clusters to have times, ns; the difference is due to the intrinsic timing resolutions of the two calorimeter technologies.
The energy of each EMCal cluster is corrected for angular dependence and non-linearity based on test beam results and simulation. The linearity corrections for both detector types are different with the PbGl showing a stronger dependence on the energy. The correction factors for a photon with a detected energy of 1 GeV (10 GeV) are 1 (0.95) for the PbSc and 1.05 (0.975) for the PbGl, respectively. The PbGl calorimeter also shows a stronger variation of the measured photon energy with the angle of incidence on the detector surface, at the measured energy is reduced by 5% compared to perpendicular incidence (), while in the PbSc the effect is only of the order of 2%.
In a typical central event the EMCal detects nearly 300 clusters corresponding to an occupancy of 10% and therefore a non-negligible probability of cluster overlaps. To minimize the effects of cluster overlaps in high multiplicity events, the energy of each cluster in the PbSc calorimeter is determined not only from the sum of all contiguous towers with deposited energy above a given threshold (15 MeV was our default value) but also, alternatively, “extrapolating” the measured “core energy” of the 4–5 central towers assuming a standard electromagnetic shower profile in an event with zero background. For this latter case, the ecore energy was computed from the experimentally measured center of gravity, central shower energy, and impact angle in the calorimeter using a parameterized shower profile function obtained from electromagnetic showers measured in the beam tests. Such an ecore energy represented an estimate of the true energy of a photon impinging on the PbSc unbiased by background contributions from other particles produced in the same event and depositing energy in the neighborhood of a given cluster. The use of ecore instead of the total cluster energy for photon reconstruction, helped to reduce considerably the effects of cluster overlaps in central collisions.
For a photon pair originating from a decay the invariant mass
| (2) |
is identical to the rest mass. However, due to the finite energy and position resolution in the detection of the photon pair, the actual reconstructed value is smeared around a mean value, which can deviate from the nominal value. The reconstructed peak position is also influenced by the high multiplicity in a heavy ion collision, where overlapping clusters can shift the measured energy of each photon.
With the invariant mass analysis, ’s cannot be identified uniquely since all possible photon-photon combinations have to be considered. This leads to a large combinatorial background, which increases quadratically with the multiplicity. The yield is instead determined on a statistical basis, with the background contribution established via a mixed event technique as described below.
One possibility to reduce the combinatorial background is to make use of the phase-space distribution of the photons in a decay. For the decay, the two photons have minimum opening angle
| (3) |
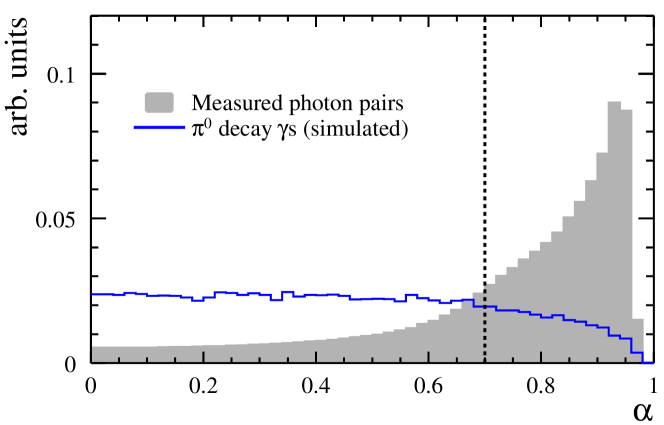
where is the mass and its momentum, with in the PHENIX central spectrometer. The angular distribution of the pair in the rest frame, , is constant, which leads to a flat distribution in the measured energy asymmetry of the two photons from decay:
| (4) |
where is the velocity of the . On the other hand, high combinatorial pairs are strongly peaked near because of the steeply falling spectrum of single photon candidates. This is illustrated in Fig. 2, where the asymmetry distribution for photons from s in a simulation is compared to the measured asymmetry for photon candidate pairs in real collisions. In two independent analyses, asymmetry cuts of and were employed, other values were used as a cross-check and to verify the energy scale (see below).
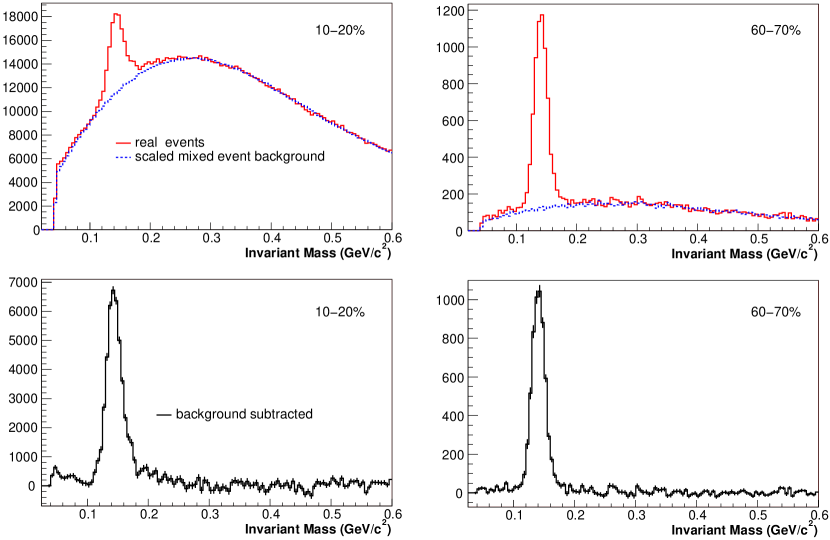
Pairs of candidate photon clusters within the PbGl and the PbSc calorimeter which satisfy the asymmetry cut are considered candidate ’s. Fig. 3 shows example invariant mass distributions for candidates with GeV/ in collisions for two different bins of collision centrality. The background under the clear mass peak in these figures is due to combinatorial mixing of photons from two different decaying ’s or from pairs containing one or two non-photon clusters that nonetheless pass the above-described cuts.
Such a combinatorial background can be determined by a so called mixed event technique. It is a widely used method to determine the combinatorial background of combined particle properties, e.g. the invariant mass of a photon pair. The basic idea is to compare the result obtained by combining particles within one event to the result for particle combinations from different events, which are a priori not correlated.
In the case of the invariant mass, the mixed event distribution is determined by combining one photon candidate from the current event with all photon candidates from previous events. The number of previous events used for the pair combinations determines the statistical error of the background and is limited basically by computing resources. In this analysis a buffer of events is varied from 3-10 previous events is used for the event mixing with the current event.
In order to describe the combinatorial background correctly it is essential that the events used for mixing have similar properties as the real event and that they are not biased toward a certain reaction, as e.g. events that are chosen because of a high- photon trigger. For this reason only minimum bias events are considered for the determination of the background in both data sets and different event classes for collision vertex, centrality and reaction plane are employed.
It is self-evident that for the photons used in the event mixing the same criteria are applied as for the pair combinations from one event, such as PID cuts, cuts on bad modules, and the asymmetry cut. Other properties valid a priori for the real photon pairs, e.g. a minimum distance that allows to distinguish them, have to be considered in addition. In the analysis a minimum distance cut of a least 8 cm is required for each photon pair combination, within one event and for mixed events, respectively.
For a given bin the mixed-event background is normalized to the same-event invariant mass distribution outside the range of the peak by scaling the mixed-event background with a function . This scaling function is determined by fitting the ratio of the same-event and mixed-event invariant mass distribution for bins up to with a linear function. This is needed because at low correlations in the real-event background due to overlapping clusters cannot be reproduced by the mixed-event technique. For the bins above , a constant is used. To cross-check the result, the linear and the constant scaling function are also determined over the complete invariant mass region, including the peak, which is taken into account by an additional Gaussian in the fit function (e.g. a linear plus a Gaussian function).
The determination of the scaling function for large pair- is limited by statistics in the real event sample and does not lead to stable results. Instead a constant scaling factor is used if the ratio of the invariant mass distribution shows bins with zero entries in the fit region. The scaling factor is determined by integrating the real and the mixed invariant mass distributions in the range with the peak region excluded.
The scaled mixed-event background is subtracted from the same-event distribution to produce a statistical measure of the true yield. The result of such a subtraction procedure is shown in the bottom plots of Fig. 3. The raw yield is obtained in each bin by integrating the subtracted invariant mass distribution in a range around the peak mean () of 3 times the Gaussian width () of the peak. Values of the mean and , can be seen in Figure 4. Varying the size of the integration window results in slightly different results, which contributes to the overall systematic uncertainty of the measurement, discussed in the Systematic Errors section III.4.4 of the next chapter.
Residual differences between the mixed background and the foreground are still apparent in some bins especially below 2 GeV/c. Cluster merging, cluster splitting (fluctuations in the 2-D energy profile cause multiple local maxima which are incorrectly separated into distinct clusters), anti-neutron annihilation and even second order residual physics correlations such as 3 and multi-body decays, flow, HBT, etc., can all cause such differences. These remaining differences are compensated by the shape of the scaling function. In addition, as a systematic check, the shape of the remaining background after subtraction is also fit with various low order polynomial functions and potential contributions to the peak yield are considered in the determination of the total systematic error from the peak extraction procedure.
The values of the peak width and mean are extracted in one initial analysis of the invariant mass distribution in which a -dependent parametrization is determined for different centralities. The use of predefined values for the position and spread of the peak has the advantage that even in regions where no fit to the subtracted invariant mass distribution is possible, the integration region is well defined just by extrapolation from low .
III.4 Spectrum Measurement
For the reaction-plane independent spectrum measurement in a given centrality class , the aforementioned analysis is applied in GeV/ bins for GeV/. We cease attempting to extract yields at high when the number of pairs within the selected (background-subtracted) mass window falls below 4 counts. We then correct the resulting raw spectrum for the geometric acceptance , the overall detection efficiency , which accounts for the cluster cut efficiency, the mass cut efficiency, for losses due to cluster overlaps in high multiplicity events, for cuts on bad modules and for the calorimeter energy and position resolution. In addition a correction for conversion losses () in the material of the PHENIX central arms and for the branching ratio of the two photon decay () is applied:
| (5) |
III.4.1 Acceptance and Detector Efficiency
The geometric acceptance of the EMCal for the decay is evaluated using a Monte-Carlo program that generates s in a rapidity interval with the same vertex distribution and rapidity distribution as observed in real events and contains the complete geometry information of the EMCal. The decay is calculated via JETSET routines that are part of the PYTHIA event generator Sjostrand et al. (2001). For each it is verified that both decay photons hit the detector. The resulting distribution of accepted s is divided by the transverse momentum distribution of the generated s and provides the geometrical acceptance of the PbSc and PbGl, respectively.
The detection efficiency is determined using GEANT to simulate the complete response of the calorimeter to single decays. The data from each simulated is, then, embedded into real events by adding the EMCal tower information of the simulated to the tower information of the real event and recalculating the EMCal clusters. The efficiency for detecting the embedded is then again determined by comparing the input spectrum to the reconstructed spectrum of the embedded ’s. Using this technique we determine “efficiency” corrections that account for the energy resolution and position resolution of the calorimeter, as well as for the losses due to overlapping clusters in a real event environment. In addition, the embedding allows for a precise determination of the effect of edge cuts and bad modules. Though these effects can be in principle considered as acceptance corrections, they depend not only on the geometry but also on the energy deposition of an electromagnetic shower in the different calorimeter towers.
In the embedding procedure the effects of photon conversions are also included, as the GEANT simulation considers the material budget in front of the EMCal and the information for decay-photon conversions is retained. The final conversion correction, which is factorized from the rest of the efficiency for book-keeping purposes, is evaluated by comparing the yield with and without including conversions in the simulation. The final conversion correction, constant with depends on the photon PID cuts and material in front of each individual sector and ranges from 6-8% in PbGl and 9-10% in PbSc. Comparing this to the sheer probability of a having at least one photon which converts, 21% PbGl and 14% PbSc, we see that a large portion of these are still reconstructable.
For the embedding, the input spectrum is weighted to match a functional form fit to the measured spectrum so that the correct folding of the spectrum with the resolution is obtained. This procedure is iterated, with the fit of the dependence of the input weights adjusted as the estimate of the efficiency correction improves, until the procedure converges within the nearly -independent statistical error of the embedded sample, approximately 3%.
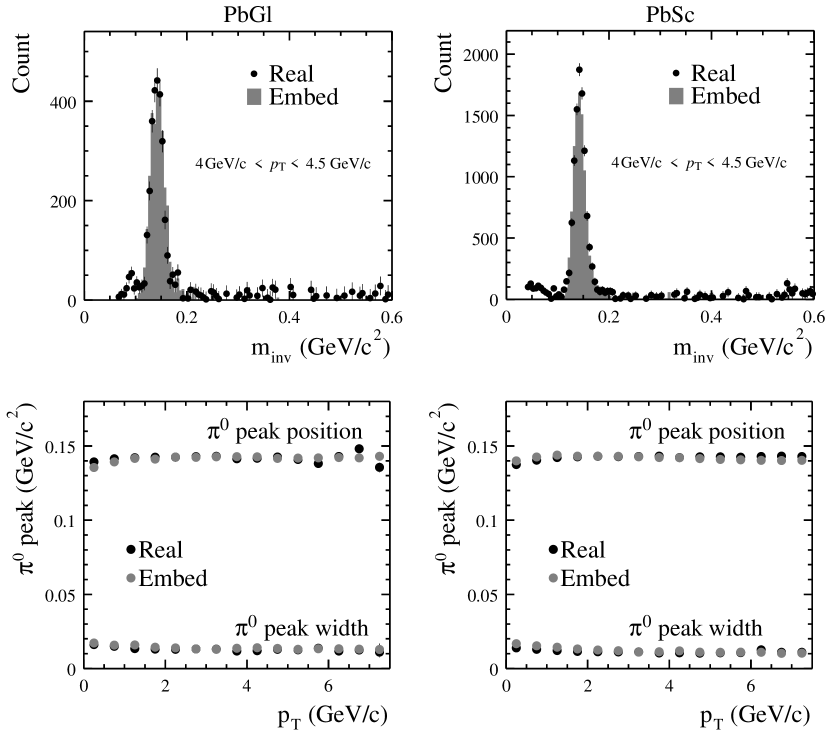
Fig. 4 compares the invariant-mass peak after background subtraction in the real data and the invariant mass peak of the embedded for the two different detector types. The measured peak position is shifted from the nominal value of approximately 134.98 MeV due to the finite energy resolution of the detector in combination with the steeply falling spectrum and due to the additional effect of overlapping clusters. As illustrated the effects are well reproduced by the embedded ’s.
III.4.2 Trigger Efficiency
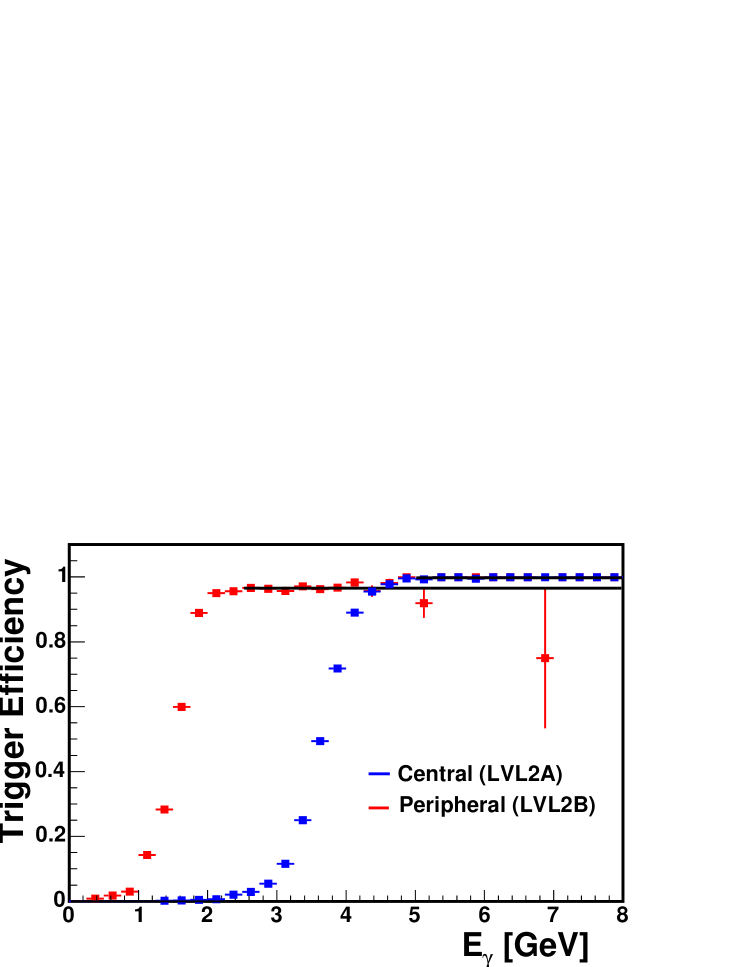
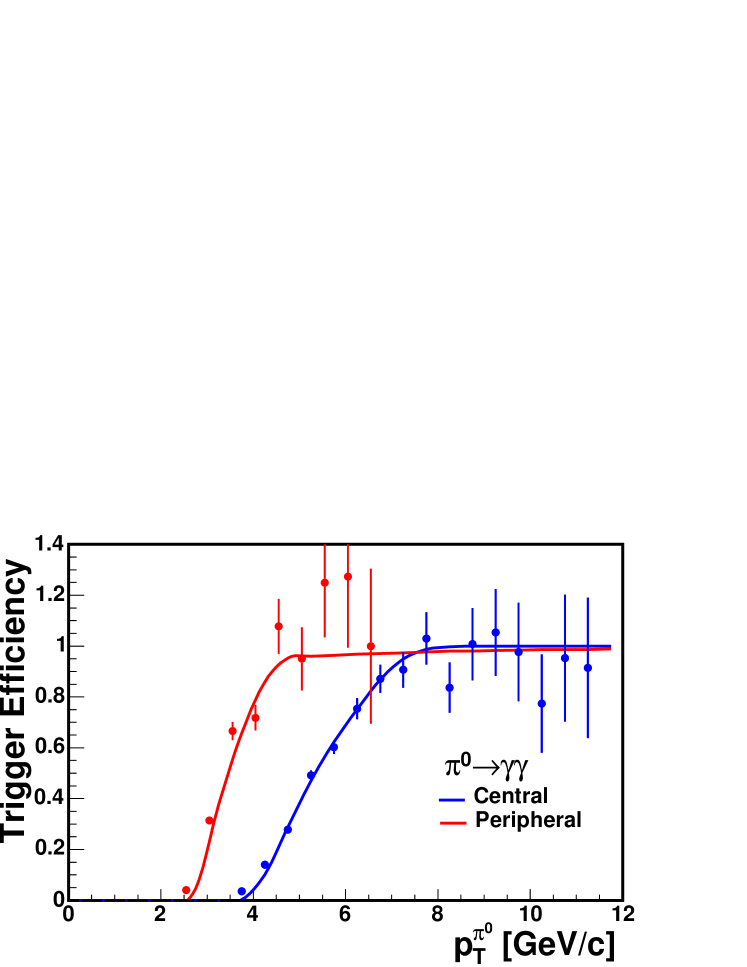
The efficiency of the Level-2 trigger is separately evaluated by processing recorded minimum-bias events with the Level-2 trigger and evaluating the efficiency for the trigger to select events containing a high cluster. This analysis shows complete (100%) efficiency for the LVL2A trigger at momenta well-above the trigger threshold of 3.5 GeV/ (95% above 1.5 GeV/ for LVL2B) for obtaining clusters that also pass all offline cluster cuts. This is demonstrated in Figure 5 (a). The “plateau” values are determined from fitting the region above the turn-on also shown.
The related trigger efficiency of reconstructed ’s is calculated from fast MC based on these measured single cluster efficiencies. The calculation is performed both by using a integrated Gaussian fit to the single cluster efficiency and by directly using the finely binned histogram and constant plateau fit. Both methods give consistent results. The result for the latter method is shown in Figure 5 (b), solid curves. The calculation is cross-checked, as demonstrated by the data points in Figure 5 (b) which show the ratio of the yield from the two Level-2 trigger samples per equivalent number of minimum bias events to the same from the true minimum bias sample itself. We combine the yields obtained in the minimum bias event sample and the LVL2A (LVL2B) trigger sample above a cut-off of 6.5 GeV/ (3.5 GeV/c) where the trigger reaches efficiencies greater than 0.4 such that the correction factor is not allowed to be large. A conservative error of 3% is assigned to the efficiency calculations, resulting in a total error of 3-5%, based on the three studies: comparisons of the data shown in Figure 5, comparisons of the two calculational methods, and a study of the yields in the subsample of minimum bias events which also fired the triggers, similar to 1).
III.4.3 Other Corrections
The calculated corrections are applied to the raw yield as given by Eq. (5). Table 2 shows the correction in central collisions for two different bins in transverse momentum and for the PbGl and PbSc, respectively. As discussed above the effect of the cut on bad modules is included in the efficiency correction, due to its dependence on the depth of the electromagnetic shower.
| PbGl | PbSc | |||
|---|---|---|---|---|
| 3.25 GeV/ | 8.5 GeV/ | 3.25 GeV/ | 8.5 GeV/ | |
| 0.068 | 0.080 | 0.216 | 0.246 | |
| 0.351 | 0.358 | 0.455 | 0.515 | |
| 0.93 | 0.93 | 0.90 | 0.90 | |
| 0.98798 | ||||
Following the usual PHENIX procedure of modifying the quoted yield values for each finite sized bin such that the measurement corresponds to value at the bin center instead of the average of the bin Lafferty and Wyatt (1995) (thereby facilitating taking ratios of spectra from different collision systems), a final correction is applied to the yield of each data point. Using a continuous function which is fit to the data points, values for the invariant yields at the centers of the chosen bins are scaled by the ratio of the fit value at the fit’s average to the fit value at the bin center. This is an iterative procedure similar to the final efficiency correction described above, with a smaller convergence criteria of 0.1% of the previous correction.
III.4.4 Systematic Errors
Each correction of the raw yield following Eq. (5) is afflicted with its own uncertainty, but already the determination of the raw yield itself is sensitive to the method of extraction. In particular it is sensitive to the choice of the fit function for the background scaling and the extraction window. In principle, both should be taken into account by the detector efficiency, but in the efficiency calculation no background subtraction is necessary. For this reason the systematic error of the peak extraction method is determined in two steps: first via the comparison of the raw yield obtained with two different fits for the background scaling, and second through the comparison of the fully corrected spectra for different sizes of the extraction window, for the real data as well as for the efficiency calculation.
The systematic error introduced by the efficiency calculation is estimated by comparing the fully corrected spectra for different PID criteria as well as for different additional smearing. The smearing (or energy resolution in the simulation) is changed in a way that a clear disagreement between the measured peak width and the peak width from the embedding is observed.
Apart from the uncertainty of the efficiency, the main contribution to the systematic error is the determination of the absolute energy scale. Based on the comparison of the peak positions in the data to the expectation from simulation the energy scale can only be determined or confirmed with limited accuracy, in the PbSc and, because of the smaller acceptance, in the PbGl.
The additional contributions to the systematic error that have not been discussed in detail involve the uncertainty of the conversion correction (2.9%) and of the acceptance calculation (2.5%) both due to small uncertainties in detector material and alignment. Table 3 provides a final overview of the various contributions to the total error of the measurement in the PbSc and the PbGl, respectively.
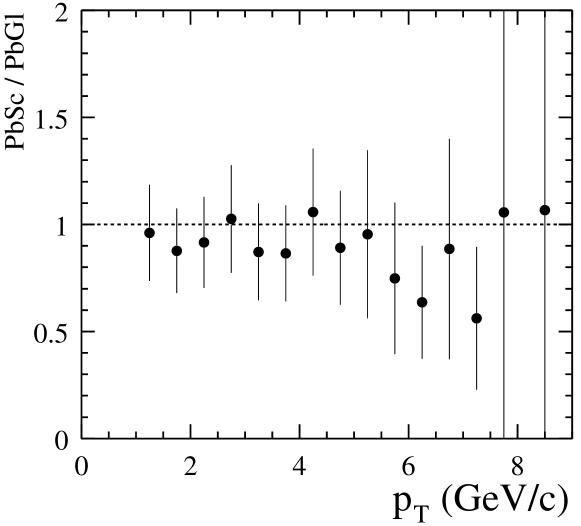
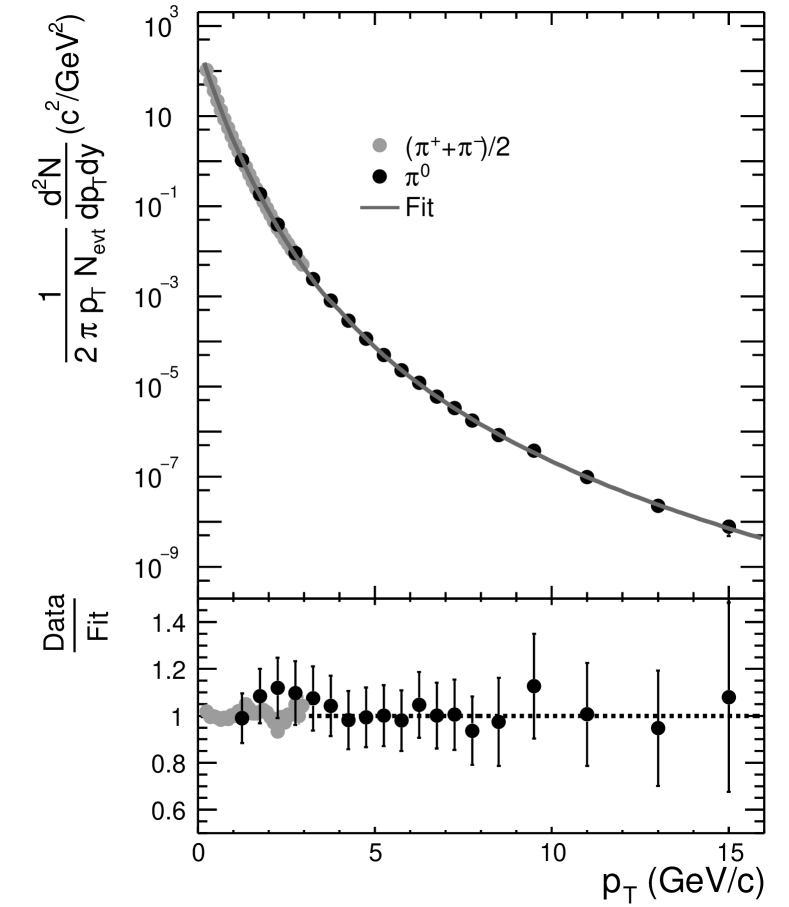
The most important cross check of the final result is the comparison of the result for the two different detector types PbGl and PbSc, which is shown for peripheral events in Fig. 6. A good agreement within the errors is seen and similar consistency is found in all centralities. Since they represent essentially independent measurements, the two results are averaged and the total error of the combined result is reduced using a standard weighted least-squares method also described in Eidelman et al. (2004). An additional cross check of the final result based on iso-spin symmetry is provided by the measurement of charged pions in the central arm Adler et al. (2004a), this is shown for minimum-bias collisions in Fig. 7. The neutral pion measurement smoothly extends the result for charged pions to larger transverse momenta.
| PbGl | PbSc | |||
|---|---|---|---|---|
| (GeV/) | 3.25 | 8.5 | 3.25 | 8.5 |
| Yield extraction | 8.7% | 6.% | 9.8% | 7.3% |
| Efficiency | 11.4% | 11.4% | 11.4% | 11.4% |
| Acceptance | 2.5% | 2.5% | 2.5% | 2.5% |
| Conversions | 2.9% | 2.9% | 2.9% | 2.9% |
| Level-2 data | – | – | – | 3% |
| Energy scale | 13.8% | 14.1% | 10.5% | 11.2% |
| Total syst. | 20.5% | 19.3% | 18.8% | 18.7% |
| Statistical | 10.6% | 50% | 8.1% | 26.6% |
III.5 Measurement
Using the invariant yields obtained from the above-described analysis and the separately measured invariant cross-section for production in collisions Adler et al. (2003f), we calculate the nuclear modification factor, , according to
| (6) |
where is the average Glauber nuclear overlap function for the centrality bin under consideration
| (7) |
from which the corresponding average number of nucleon-nucleon collisions, , can be easily obtained.
III.6 Measurement
The measurement of the raw yield with respect to the event reaction plane, , proceeds as described in Sec. III.4 for the spectrum except that we measure the yields as a simultaneous function of both and . Because the beam-beam counters have acceptance, PHENIX can measure the yields with uniform acceptance over even though the electromagnetic calorimeters have only nominal azimuthal acceptance. Since the measurement of is ambiguous wrt a rotation of the reaction plane, and since we expect the yields to be symmetric wrt reflection around , we measure the yields in 6 bins of over the range . For each bin we evaluate the ratio,
| (8) |
where is the measured number of ’s in a given bin, representing one orientation of . Because the PHENIX central arm acceptance is effectively constant as a function of and we do not expect any azimuthal-dependence of our efficiency corrections, can be written as:
| (9) |
Using the measured values we can directly convert the to without having to apply acceptance and efficiency corrections to the reaction-plane dependent yields. These corrections are already included in the values as described above.
However, before applying this procedure we must first correct the values for the finite resolution of the reaction plane measurement. One goal of our measurement is to determine without assuming any particular functional dependence on . However, for purposes of correcting for reaction plane resolution, we take advantage of the fact that the observed yields and hence the nuclear modification vary with to first order as
| (10) |
Where the superscript denotes the values not corrected for the reaction plane resolution. This resolution reduces by the factor Poskanzer and Voloshin (1998), which is given by the independent measurement of in the two BBC’s shown previously in Fig 1a). For each bin in a given centrality class we fit the values to the functional form in Eq. (10) and then correct each measured value according to
| (11) |
with . We estimate the systematic error in the reaction plane resolution correction by propagating the centrality dependent uncertainties in from Fig 1b). Of course, the above-described correction only strictly applies if is well-described by the functional form in Eq. (10). While we do observe some departure from this harmonic form in the data, the differences are typically below 5% so our correction will not introduce a large error.
IV Results
IV.1 Transverse Momentum Spectra and Nuclear Modification Factors
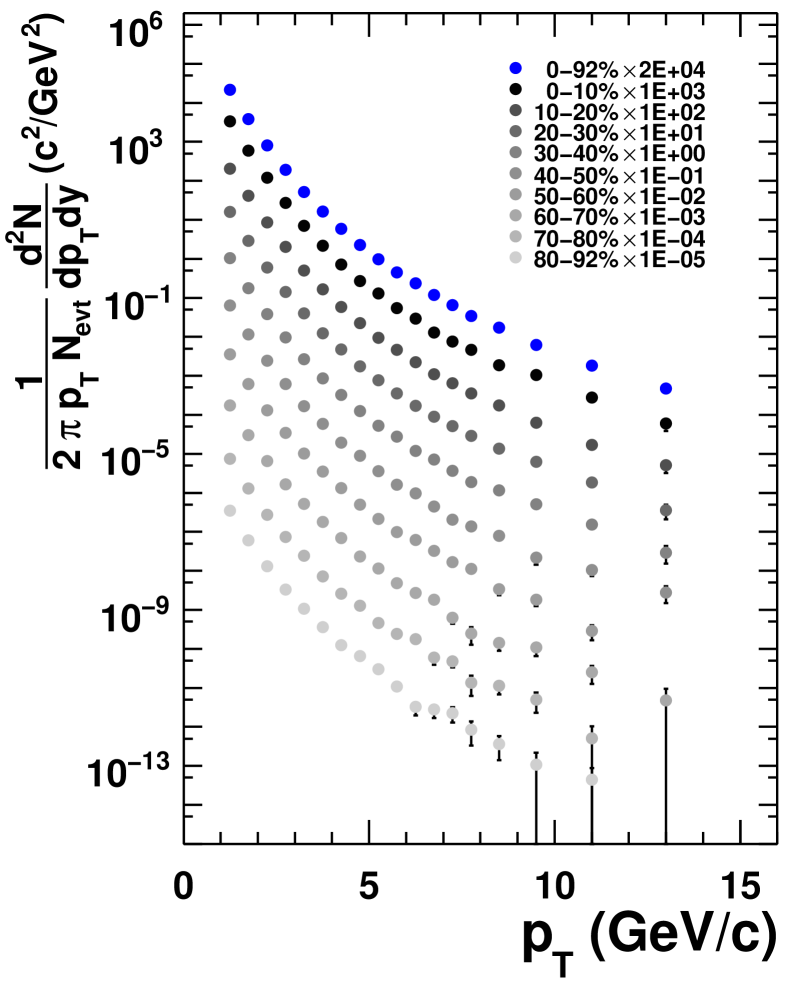
The invariant yields obtained using the procedure described in Sec. III.4 are presented in Fig. 8 as a function of for the nine chosen centrality bins. With the increased statistics included in this analysis, we have extended the range of the previous PHENIX measurement by at least 2 GeV/ for all centrality bins. The range of the central bin has been extended from 10 GeV/ to 14 GeV/. Where the spectra overlap, the results shown here are consistent with the previously published results within systematic errors. The errors shown on the points in Fig. 8 include statistical errors and point-to-point varying systematic errors. The appendix tabulates the spectra plotted in Fig. 8 (centralities: 0–10%, 10–20%, …, 70–80%, 80-92% ) plus the combined spectra for centralities 0–20%, 20–60% and 60–92%, which are used for comparison to other neutral meson measurements Adler et al. (2006a). The spectra in Fig. 8 depart from the exponential-like shape above 3 GeV/ which is consistent with the expectation that high- hadron production is dominated by hard-scattering processes which produce a
power-law spectrum for hadrons resulting from quark and gluon fragmentation.
In previous publications, we have established the suppression of high- production in collisions Adcox et al. (2002b); Adler et al. (2003a). This suppression cannot be easily seen given the large range of invariant yield covered by Fig. 8.
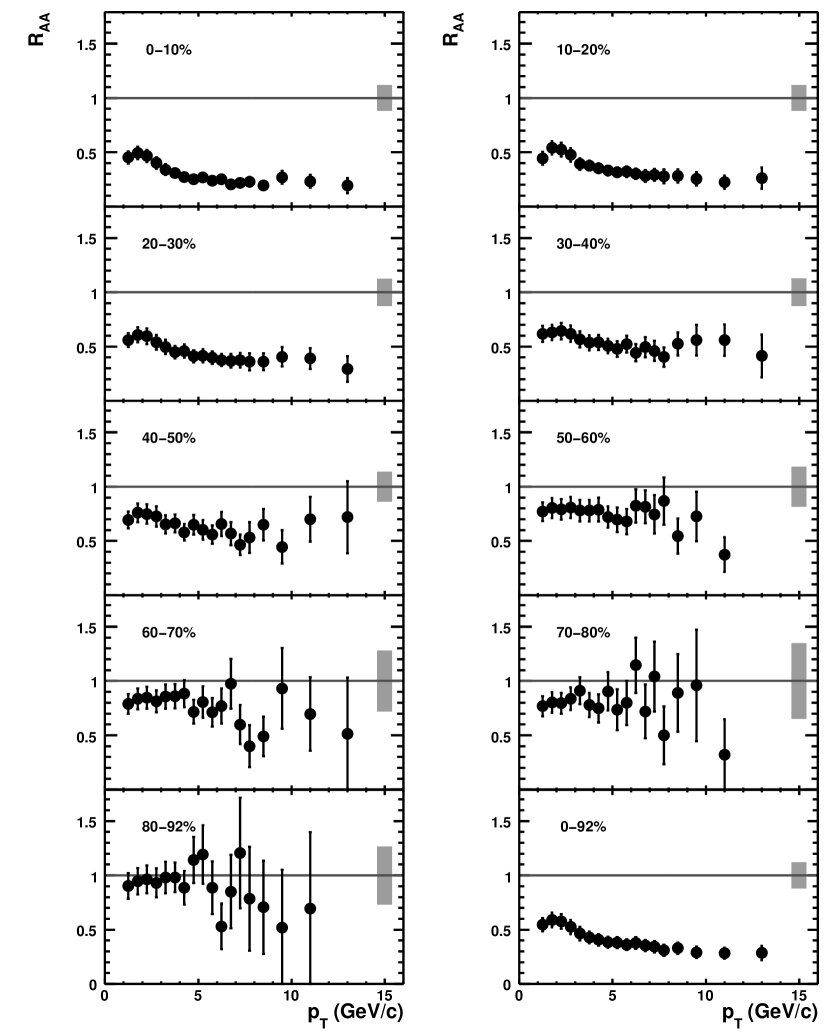
To evaluate the suppression of high- ’s, we show in Fig. 9 the dependence of the nuclear modification factor, , for the nine individual bins of collision centrality and for the full minimum-bias centrality range 0-92.2%. We make use of the PHENIX Run3 baseline data. Adler et al. (2004b). The error bars on the data in Fig. 9 include contributions from statistical errors in the and measurements and from the systematic errors that do not cancel between the measurements. The separate band shown in each panel indicates -independent errors on the measurement resulting from uncertainties in estimating and systematic errors on the normalization of the and measurements that do not cancel. As in previously published papers, (e.g. Adcox et al. (2003a); Adler et al. (2004a); Adams et al. (2003a)) a factor of high suppression in the most central collisions, 0.2, is observed, with the suppression approximately independent for GeV/. The suppression at high decreases in more peripheral collisions such that the two most peripheral bins have values consistent with unity for GeV/.
IV.2 Suppression via Spectrum Shift
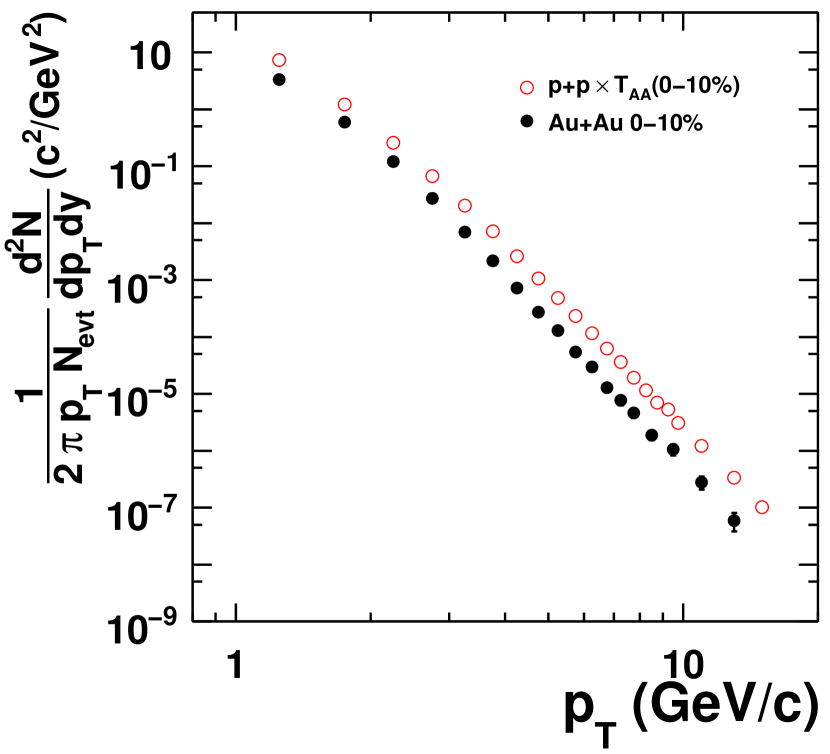
The suppression of high particles as shown above was determined by comparison of the semi-inclusive measured yields as a function of centrality in collisions at GeV to the scaled spectrum from collisions Adler (2006). A direct comparison of the 0–10% centrality spectrum to the scaled spectrum is shown in Fig. 10 as a log-log plot to emphasize the pure power law dependence of the data for GeV/. The suppression is commonly expressed by taking the ratio of the point-like scaled semi-inclusive yield to the reference distribution (Eq. 6).
As illustrated in Fig. 10, instead of viewing the suppression in the nuclear modification factor as “vertical” reduction of the Au+Au yields, it can equally well be taken as a “horizontal” shift in the scaled spectrum, such that
| (12) |
where the last term in parenthesis is the Jacobian, .
Furthermore, owing to the pure power law of the reference spectrum, with above 4 GeV/, the relative shift of the spectra—assumed to be the result of energy loss for the spectrum—is easily related to the equivalent ratio, :
where the exponent is because the relevant shift is in the spectrum rather than in . The fact that the and reference spectra are parallel in Fig. 10 provides a graphical illustration that the fractional shift in the spectrum, , is a constant for all GeV/, which also results in a constant ratio of the spectra, . For the constant fractional shift, the Jacobean is simply and Eq. (IV.2) becomes:
| (14) |
| (15) |
The effective fractional energy loss, , is related to the fractional shift in the measured spectrum, . The hadrons that would have been produced in the reference spectrum at transverse momentum , were detected with transverse momentum, , implying a fractional energy loss:
| (16) |
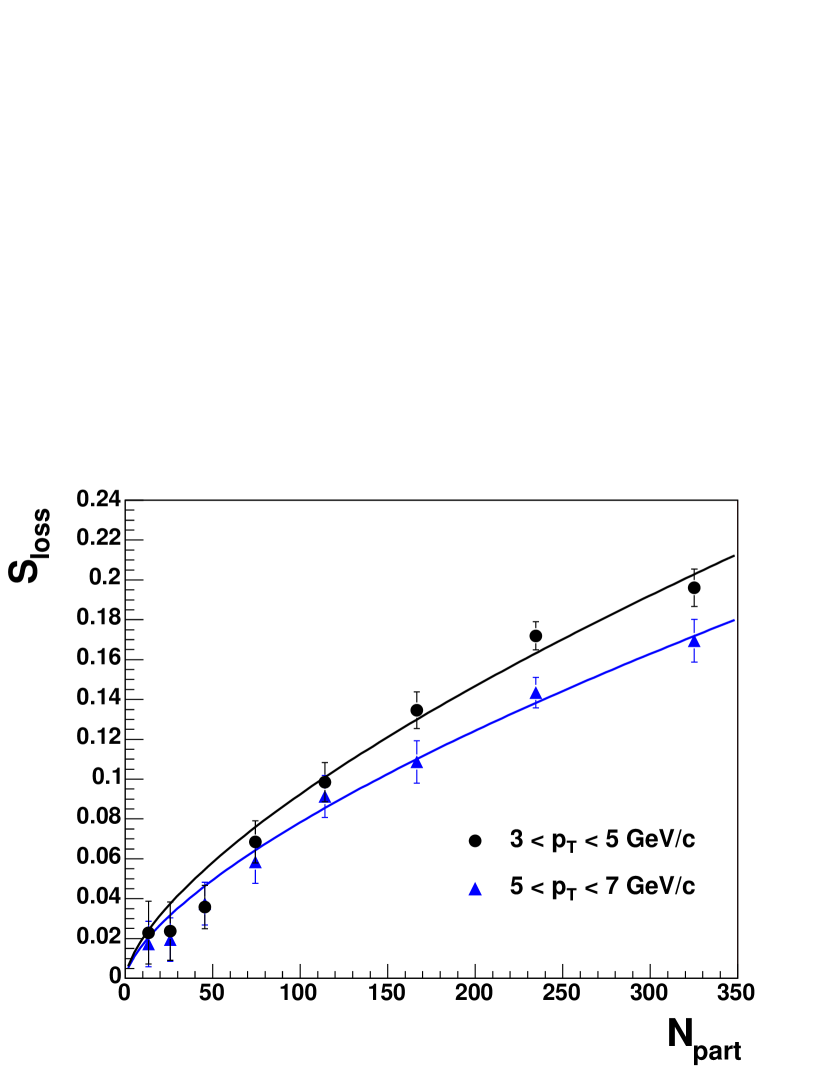
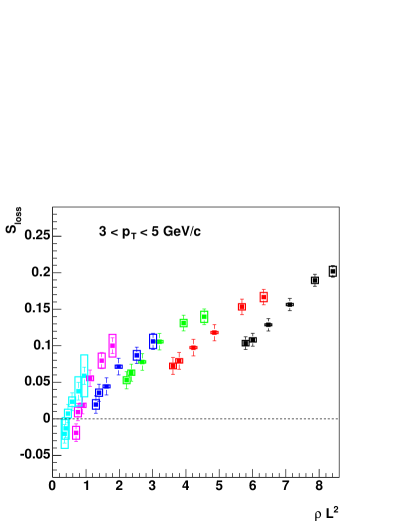
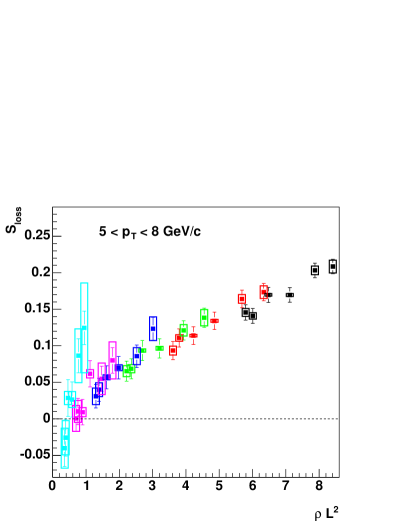
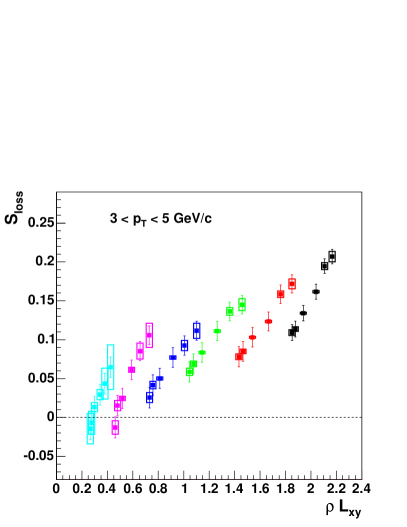
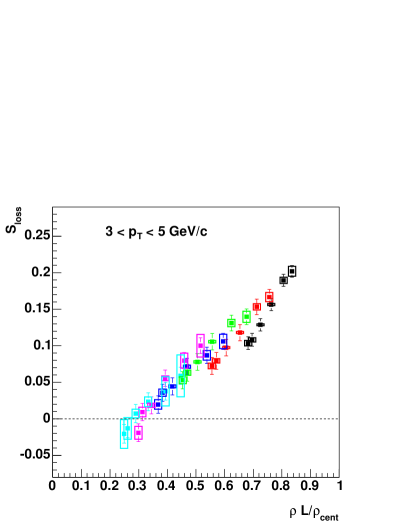
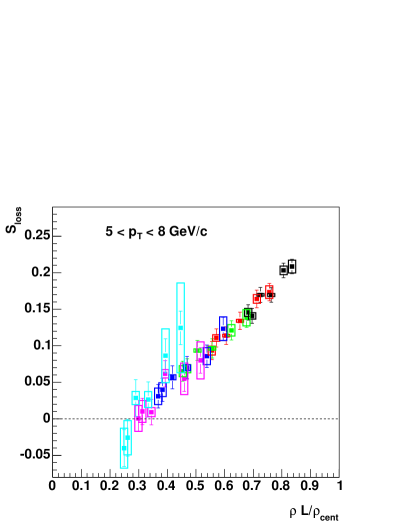
The fractional energy loss as a function of centrality expressed as is shown in Fig. 11 for two different ranges, GeV/ and GeV/. There appears to be a small decrease of with increasing , but the main observation from Fig. 11 is that increases approximately like , as suggested by GLV Vitev (2006) and PQM Dainese et al. (2005a).
It is important to realize that the effective fractional energy loss, estimated from the shift in the spectrum is actually less than the real average energy loss at a given , i.e. the observed particles have closer to the original value, than to the average. The effect is similar to that of “trigger bias” Jacob and Landshoff (1978) where, due to the steeply falling spectrum, the of detected single inclusive particles is much larger than the of jet fragmentation, where . Similarly for a given observed , the events at larger with larger energy loss are lost under the events with smaller with smaller energy loss.
It should be noted that fluctuations due to the variation of the path length and densities traversed by different partons also contribute to the difference between and . However, as long as the dependences of the induced energy loss on path length and parton energy approximately factorize, these fluctuations will also produce a -independent reduction in compared to .
IV.3 Angle Dependence of High Suppression
In order to try to separate the effects of the density of the medium and path length traversed, we study the dependence of the yield with respect to the reaction plane. For a given centrality, variation of gives a variation of the path-length traversed for fixed initial conditions, while varying the centrality allows to determine the effect of varying the initial conditions.
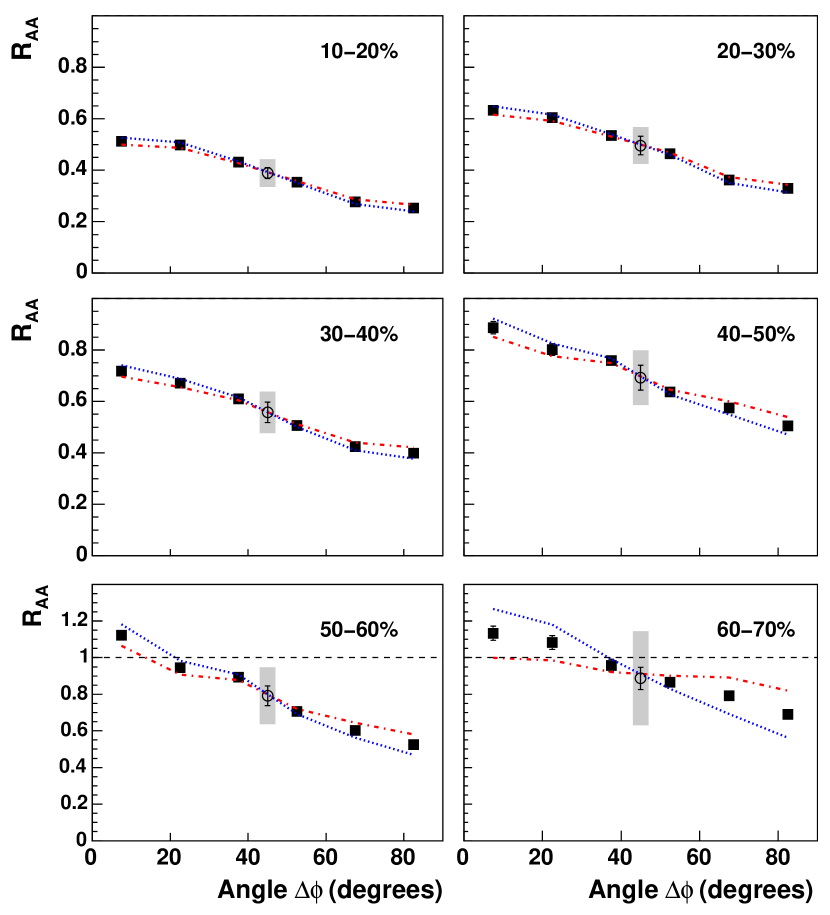
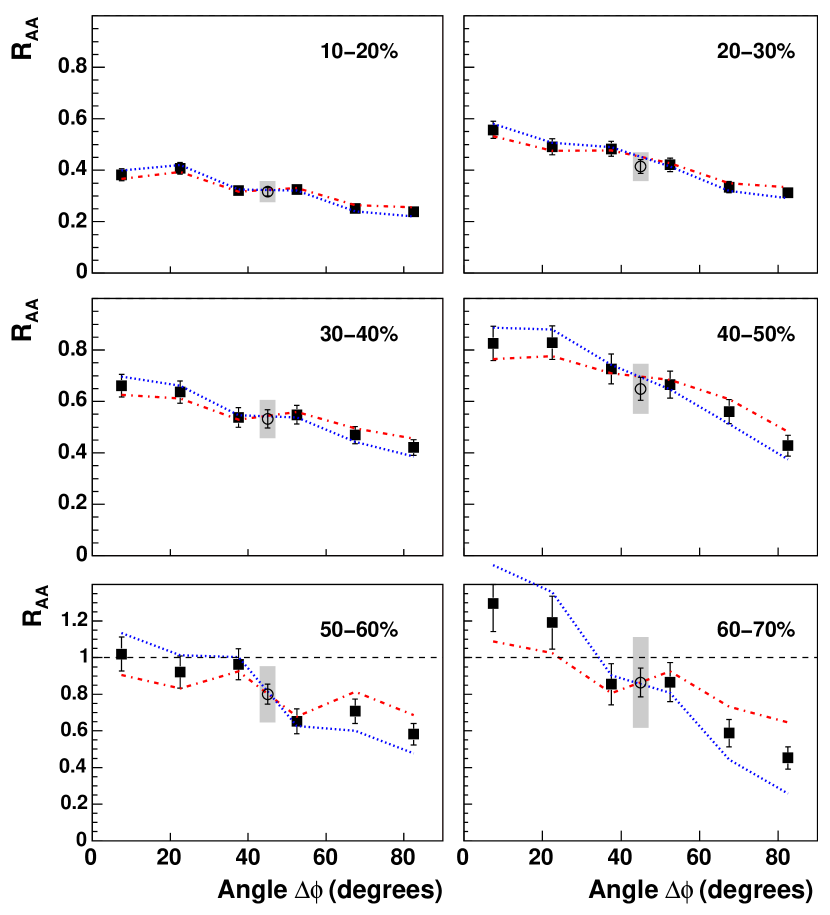
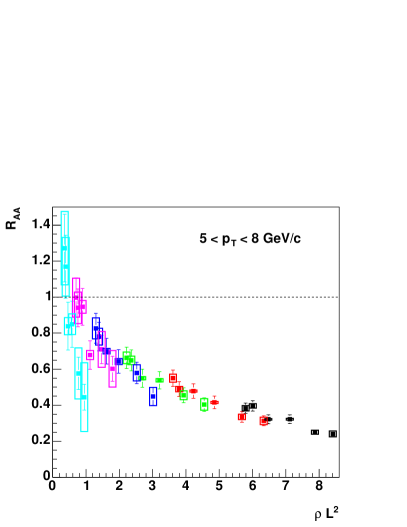
Figs. 12 and 13 show the nuclear modification factor as a function of integrated over and , respectively. For all centralities (eccentricities) considered, there is almost a factor of two more suppression out-of-plane ( = /2) than in-plane ( = 0), something that is immediately apparent in viewing the data in this fashion, explicitly displaying information only implicit in , or the combination thereof. Strikingly, in contradiction to the data the variation in with respect to the reaction plane expected by parton energy loss models Drees et al. (2005); Dainese et al. (2005b) should be much smaller for the more peripheral bins than for the central bins. As a result, the suppression vanishes (and perhaps an enhancement is observed) for smaller in the peripheral bins, corresponding to small path-length traversed in the medium. Although collective elliptic flow effects, usually not included in those models, are known to boost in-plane (compared to out-of-plane) particle production Ackermann et al. (2001); Adler et al. (2003e), it is unclear how such collective effects can still play such an important role at the high bins considered. This may point to the possible need for a formation time before suppression can occur Pantuev (2005) and which could also explain why attempts to describe the azimuthal asymmetry solely in terms of purely geometrical energy loss have failed.
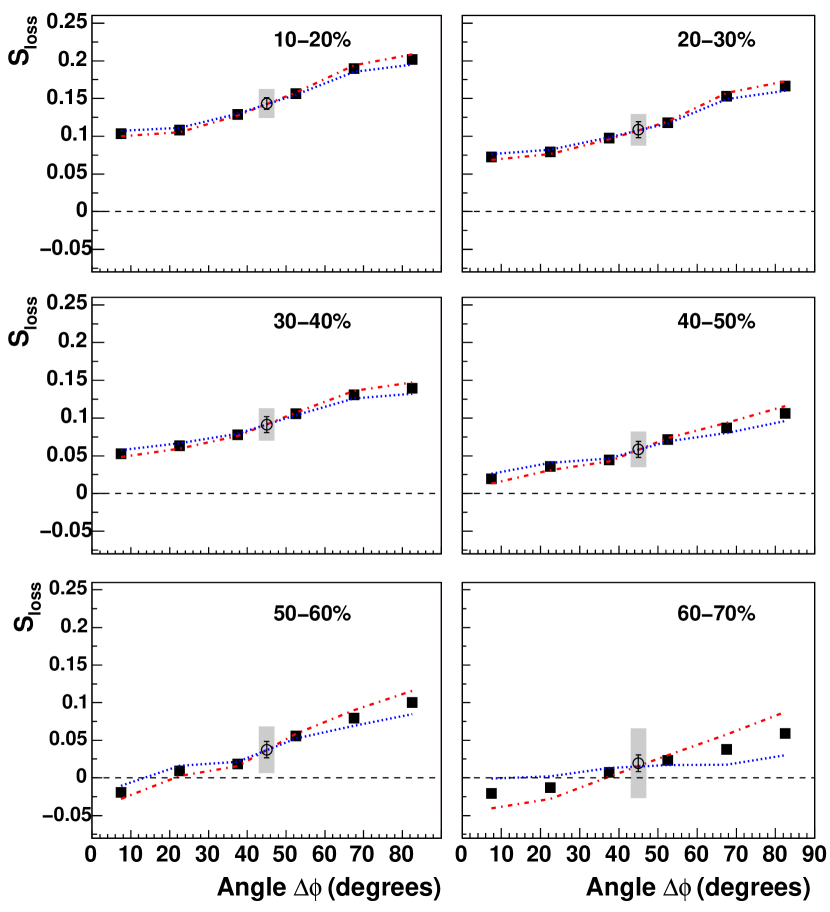
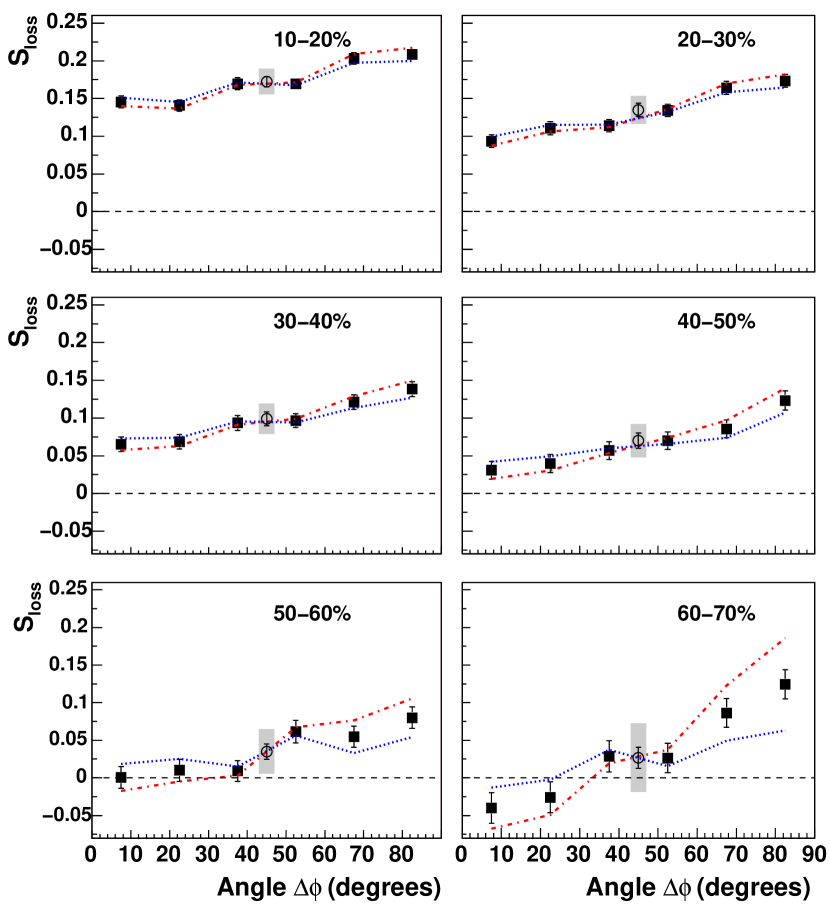
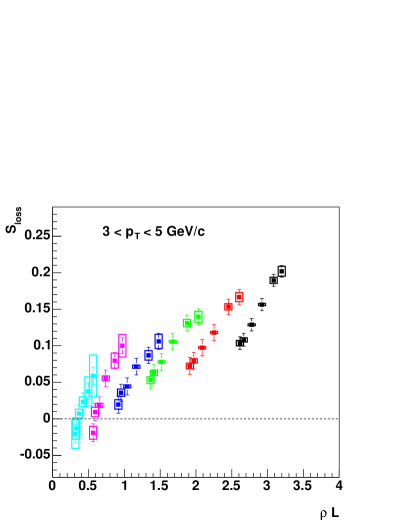
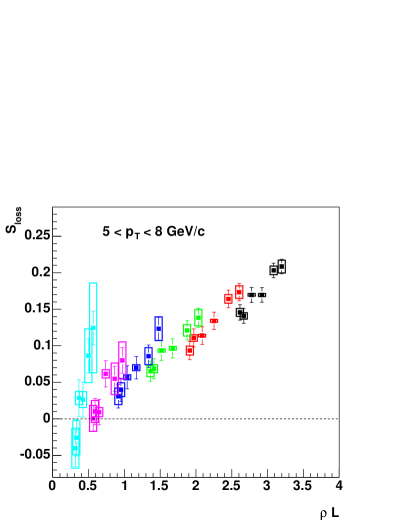
Figs. 14 and 15 give the angular dependence in terms of the fractional energy loss , and provide essentially the same information as shown in the plots of in Figs. 12 and 13. Once again we see a large variation in energy loss as a function of angle. All the measurements of or equivalently vs. reaction plane and centrality, provide new constraints to models of jet quenching. To better understand the implications of the results shown in these figures, we will attempt in the next Section to find a common geometric description of the angle and centrality dependences in terms of an estimated path length of the parton in the medium.
IV.4 Path-length Dependence of Energy Loss
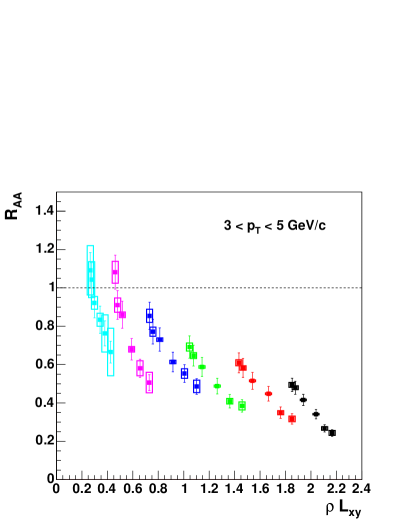
To analyze the path length dependence of parton energy loss using the data presented here we will use different methods for estimating the path lengths of partons in the medium as a function of centrality and . The “standard” approach would be to evaluate a length-weighted integral of the color-charge density in the medium along the parton path. We will adopt such an approach, described by the parameter defined below, but we will also consider two other simplified approaches that may help indicate which physics is most relevant in determining the observed suppression. We first consider, simply, , the distance from the edge to the center of the elliptical overlap zone of the collision to represent the average path length of a parton in the medium. Then we try to weight the path length (or length-squared) traversed by a parton from the center of the ellipse by the participant density in the transverse plane: (). Finally, we do the same path length weighting for partons produced across the overlap ellipse, with hard-scattering production points weighted by : (). It is obvious that such a dependent analysis is not possible from just a simple combination of and .
In detail, the three approaches considered here are as follows:
-
(1) The simplest picture for the angular dependence of the energy loss in non-central collisions is that it is due to the asymmetric shape of the overlap region of the colliding nuclei. Taking this idea to its extreme, only the simplest length scale, the length of the overlap region in a particular direction, matters. To evaluate this length, we first estimated the RMS radius and eccentricity of an ellipse approximating the shape of the overlap region from the transverse distribution of the participant density calculated using standard Glauber techniques. We then estimated the path length, , of partons emitted at a given angle by evaluating the distance from the center of the ellipse to the edge. We thus ignore such considerations as event by event eccentricity fluctuations and only consider the average.
-
(2) Although the participant density is used to evaluate the dimensions of the ellipse, the above analysis ignores the dependence of participant density on position in the transverse plane. Thus as a natural extension of the simple length scale in 1), for another analysis of the dependence of energy loss on , we assume that the color-charge density in the medium is proportional to participant density and evaluate , the integral of this density along the path length of the particle. This quantity is proportional to the opacity of the medium () divided by some undetermined cross-section. While the integral in principle extends to infinity the participant density naturally cuts off the integral outside the collision zone.
(17) To account for the possible role of LPM coherence in the energy loss process, we evaluate a similar quantity including an extra factor of in the integrand.
(18) We note that a Bjorken expansion of the medium would approximately cancel one power of in the above expressions. Then, , might represent LPM energy loss in the presence of 1-D expansion. In the above integrals we assume all jets originate at the center of the collision region similar to our assumption for .
-
(3) A final refinement on our geometrical calculation evaluates integrals like those in Eq. (17),(18) for jet production points distributed over the collision region to better account for geometric fluctuations. We are using a Monte-Carlo algorithm to sample jet production points according to weighting and angles from a uniform distribution. For each jet, we evaluate the integral of the color-charge density ( participant density) along the path of the parton out of the medium,
(19) or
(20) The above Monte-Carlo sampling yields a distribution of () values for each centrality. The larger values of () correspond to larger energy loss which means these jets will have smaller contribution to the observed yield. To take this into account, a weighting factor is applied when evaluating . We assume that the energy loss can be represented by our empirical energy loss, which we take to be proportional to () but with an undetermined multiplicative constant, . We determine this constant in each centrality bin by relating to using Eq. (16) and then evaluating the survival probability of each jet through
(21) and requiring that the resulting suppression summed over all sampled jets agrees with the measured -integrated for that centrality bin. This determines the constant and allows us to evaluate a survival probability weighted average for .
We now evaluate how well the three above-described treatments of the geometry of the parton propagation in the medium perform in providing a consistent description of the and centrality dependence of suppression.
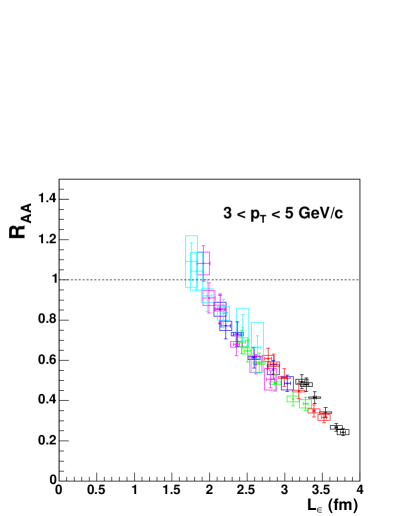
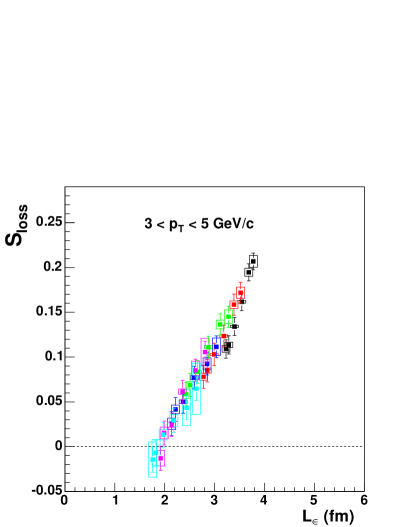
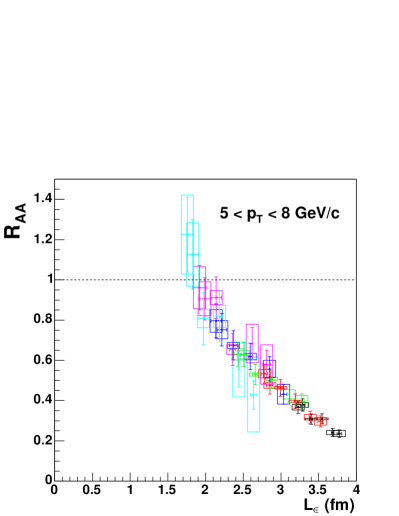
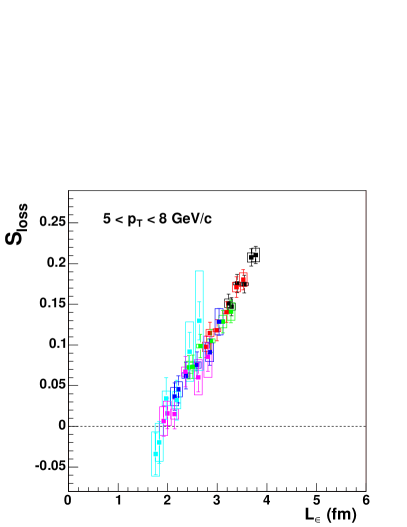
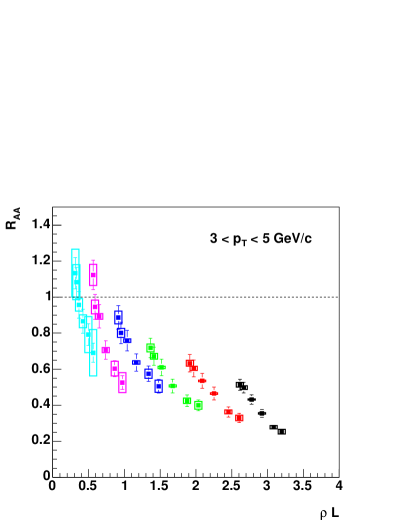
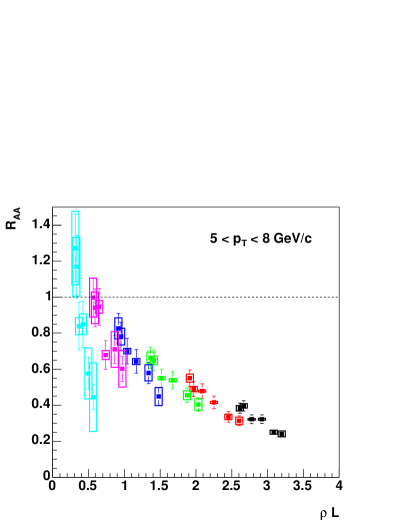
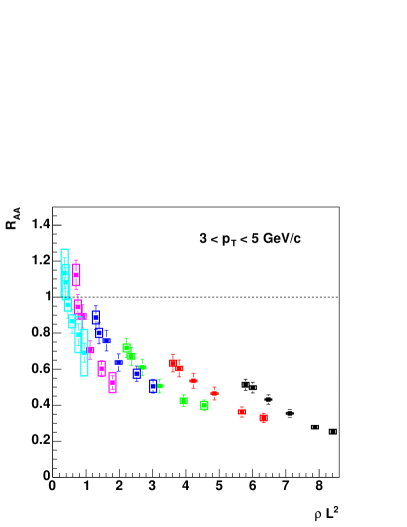
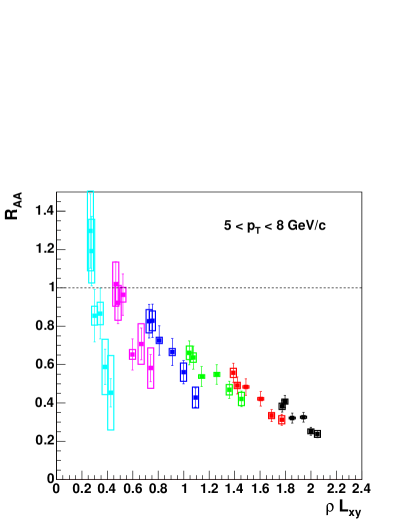
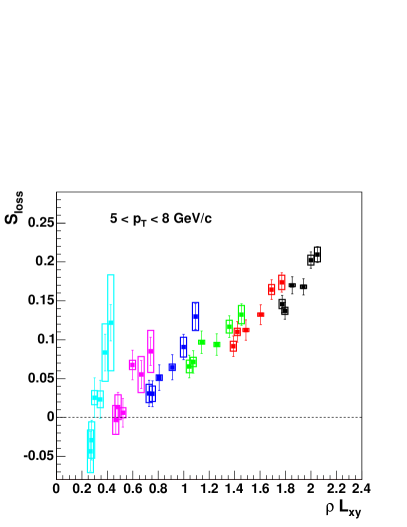
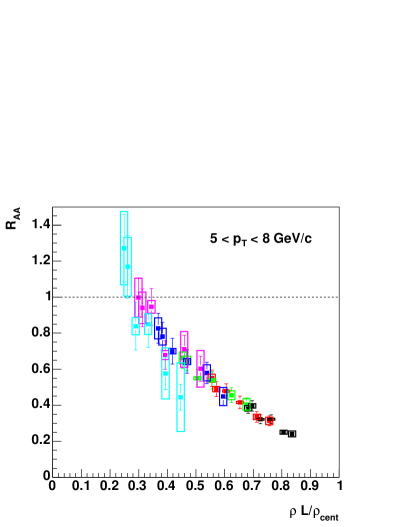
The plots shown in Figs. 15-20 illustrate the path length and color-charge dependence of suppression using our empirical estimators. The systematic error in the estimators due to the uncertainty of the overlap geometry parameter in a centrality class are approximately 10-20% and is not shown in the figures. This uncertainty is derived by propagating the impact parameter and eccentricity uncertainties from the PHENIX Glauber MC itself Adcox et al. (2001, 2002a).
From Figs. 15-20 it is evident that the individual centrality bins exhibit roughly parallel linear dependencies of the variables vs etc. For the GeV/c bin these slopes are such that the curves are disjoint due to the steeper value of the slopes in each centrality group (each color in the plots) compared to the bin-to-bin trend. For the higher GeV/c bin, the slopes in the individual centralities flatten such that they follow the bin-to-bin trend much better. These are meant to be qualitative statements. We defer anymore quantitative tests, e.g. statistical tests, to subsequent datasets (e.g. the larger PHENIX 2004-2005 Run4 dataset) with which we can improve statistical precision.
In this spirit, we note several other interesting qualitative dependencies:
-
•
is universal as a function of for all centrality classes and both ranges.
-
•
is universal and is a linear function of for all centrality classes and both ranges.
-
•
Within our errors, we see no suppression , hence no apparent fractional energy loss for fm.
-
•
Neither nor is universal as a function of , or for GeV/.
-
•
For the higher GeV/ bin, () approaches universality as a function of , , and (possibly to a lesser extent for the latter two) but does not achieve the level of universality found for . The largest deviations from universality in these quantities are towards the longer axis (perpendicular to the event plane) in the more peripheral events. The dependence of is reasonably linear as a function of but tends to level off at larger values of .
-
•
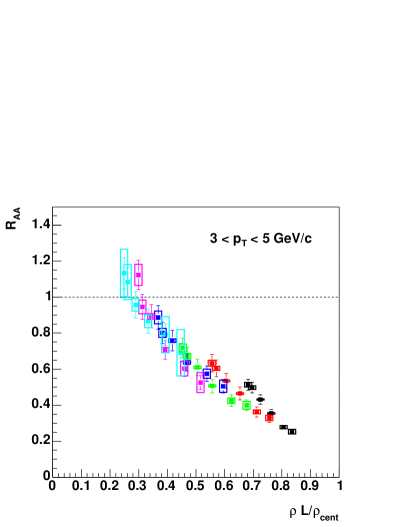
When is normalized by the central density , then () become universal in the quantities for both ranges with a linear dependence. The universality appears to become more exact in the higher range. A similar improvement (not shown) of the qualitative universality for and is also observed when these quantities are scaled in the same way by .
The most important of these observations is the absence of suppression for the same value of fm for both ranges, GeV/ and GeV/. This may suggest a “formation time effect” (see Pantuev (2005), Shuryak and Zahed (2004)) or some other type of emission zone which has generally not been taken into account in parton energy-loss models. The level of universal scaling with this simple geometric quantity is surprising.
V Summary and Conclusions
We have presented a detailed analysis of high- neutral pion suppression as a function of transverse momentum, centrality and angle with respect to reaction plane in collisions at = 200 GeV. The yields have been measured in the range 1 – 14 GeV/ in nine centrality bins and compared to the differential cross-sections measured in . The ratio of over spectra (scaled by the number of equivalent nucleon-nucleon scatterings) is reduced more and more for larger centralities. The resulting suppression factor is, however, independent of above 4 GeV/ for all centralities. This observation can be interpreted as an indication of a constant effective fractional energy loss, fixed “ shift”, in the compared to the yields. The dependence of in the centrality as given by the number of participating nucleons follows an approximately law as predicted by parton energy loss models.
In order to constrain the “jet quenching” models with more differential observables, we have experimentally tested the path-length () dependence of the energy loss by exploiting the spatial azimuthal asymmetry of the system produced in non-central nuclear collisions. Due to the characteristic almond-like shape of the overlapping matter produced in A+A reactions with finite impact parameter, partons traversing the produced medium along the direction perpendicular to the reaction plane (“out-of-plane”) will comparatively go through more matter than those going parallel to it (“in-plane”), and therefore are expected to lose more energy.
We have studied the suppression pattern along different trajectories with respect to the reaction plane determined with the Beam-Beam-Counters at high rapidities. The measured curves show clearly a factor of 2 more suppression out-of-plane ( = /2) than in-plane ( = 0) for all the centralities (eccentricities) considered. Theoretical calculations of parton energy loss in an azimuthally asymmetric medium predict a significantly smaller difference between the suppression patterns for partons emitted at = 0 and = /2 Shuryak (2002); Drees et al. (2005); Muller (2003). The discrepancy is stronger for more peripheral centralities (with correspondingly larger eccentricities) and challenges the underlying in-medium path-length dependence of non-Abelian parton energy loss. Although elliptic flow effects are responsible for extra boost of in-plane (compared to out-of-plane) pions, it is unclear how such collective effects persist up to values as high as GeV/. We have analyzed the observed reaction-plane and centrality dependence of the nuclear modification factor with three different versions of a Monte Carlo model with an increasing level of refinement in the description of the azimuthal propagation of the parton in the medium. For all three approaches we observe that the suppression tends to vanish for values of the path-length fm in the two ranges considered, GeV/ and GeV/. Such a result suggests either a formation time effect or a surface emission zone that results in a -independent suppression and puts additional constraints to parton energy-loss models.
We thank the staff of the Collider-Accelerator and Physics Departments at Brookhaven National Laboratory and the staff of the other PHENIX participating institutions for their vital contributions. We acknowledge support from the Department of Energy, Office of Science, Nuclear Physics Division, the National Science Foundation, Abilene Christian University Research Council, Research Foundation of SUNY, and Dean of the College of Arts and Sciences, Vanderbilt University (U.S.A), Ministry of Education, Culture, Sports, Science, and Technology and the Japan Society for the Promotion of Science (Japan), Conselho Nacional de Desenvolvimento Científico e Tecnológico and Fundação de Amparo à Pesquisa do Estado de São Paulo (Brazil), Natural Science Foundation of China (People’s Republic of China), Centre National de la Recherche Scientifique, Commissariat à l’Énergie Atomique, Institut National de Physique Nucléaire et de Physique des Particules, and Institut National de Physique Nucléaire et de Physique des Particules, (France), Bundesministerium für Bildung und Forschung, Deutscher Akademischer Austausch Dienst, and Alexander von Humboldt Stiftung (Germany), Hungarian National Science Fund, OTKA (Hungary), Department of Atomic Energy and Department of Science and Technology (India), Israel Science Foundation (Israel), Korea Research Foundation and Korea Science and Engineering Foundation (Korea), Russian Ministry of Industry, Science and Tekhnologies, Russian Academy of Science, Russian Ministry of Atomic Energy (Russia), VR and the Wallenberg Foundation (Sweden), the U.S. Civilian Research and Development Foundation for the Independent States of the Former Soviet Union, the US-Hungarian NSF-OTKA-MTA, the US-Israel Binational Science Foundation, and the 5th European Union TMR Marie-Curie Programme.
Appendix: Data tables of Au+Au spectra
| Yield | Stat. Error | % | Sys. Error | % | |
|---|---|---|---|---|---|
| 1.25 | 3.314E+00 | 2.518E-02 | 0.76 | 4.026E-01 | 12.15 |
| 1.75 | 5.981E-01 | 4.946E-03 | 0.83 | 6.784E-02 | 11.34 |
| 2.25 | 1.208E-01 | 1.253E-03 | 1.04 | 1.447E-02 | 11.98 |
| 2.75 | 2.718E-02 | 3.744E-04 | 1.38 | 3.521E-03 | 12.96 |
| 3.25 | 6.970E-03 | 1.270E-04 | 1.82 | 9.751E-04 | 13.99 |
| 3.75 | 2.158E-03 | 4.713E-05 | 2.18 | 2.686E-04 | 12.44 |
| 4.25 | 7.185E-04 | 2.133E-05 | 2.97 | 9.349E-05 | 13.01 |
| 4.75 | 2.715E-04 | 1.063E-05 | 3.92 | 3.575E-05 | 13.17 |
| 5.25 | 1.288E-04 | 5.931E-06 | 4.61 | 1.702E-05 | 13.21 |
| 5.75 | 5.417E-05 | 2.606E-06 | 4.81 | 7.731E-06 | 14.27 |
| 6.25 | 2.940E-05 | 1.560E-06 | 5.31 | 4.106E-06 | 13.97 |
| 6.75 | 1.280E-05 | 9.501E-07 | 7.43 | 1.922E-06 | 15.02 |
| 7.25 | 7.641E-06 | 6.459E-07 | 8.45 | 1.241E-06 | 16.24 |
| 7.75 | 4.630E-06 | 4.668E-07 | 10.08 | 7.508E-07 | 16.22 |
| 8.50 | 1.883E-06 | 1.809E-07 | 9.61 | 3.033E-07 | 16.11 |
| 9.50 | 1.057E-06 | 1.276E-07 | 12.07 | 1.952E-07 | 18.47 |
| 11.00 | 2.777E-07 | 4.274E-08 | 15.39 | 5.664E-08 | 20.39 |
| 13.00 | 5.941E-08 | 1.704E-08 | 28.87 | 1.222E-08 | 20.57 |
| Yield | Stat. Error | % | Sys. Error | % | |
|---|---|---|---|---|---|
| 1.25 | 2.054E+00 | 1.461E-02 | 0.71 | 2.655E-01 | 12.93 |
| 1.75 | 4.137E-01 | 2.933E-03 | 0.71 | 4.616E-02 | 11.16 |
| 2.25 | 8.576E-02 | 7.654E-04 | 0.89 | 1.039E-02 | 12.11 |
| 2.75 | 2.028E-02 | 2.305E-04 | 1.14 | 2.612E-03 | 12.88 |
| 3.25 | 5.057E-03 | 7.980E-05 | 1.58 | 6.778E-04 | 13.40 |
| 3.75 | 1.665E-03 | 3.170E-05 | 1.90 | 1.995E-04 | 11.98 |
| 4.25 | 5.859E-04 | 1.511E-05 | 2.58 | 7.301E-05 | 12.46 |
| 4.75 | 2.253E-04 | 7.948E-06 | 3.53 | 3.003E-05 | 13.33 |
| 5.25 | 9.486E-05 | 4.369E-06 | 4.61 | 1.246E-05 | 13.14 |
| 5.75 | 4.651E-05 | 2.087E-06 | 4.49 | 6.696E-06 | 14.40 |
| 6.25 | 2.224E-05 | 1.249E-06 | 5.62 | 3.252E-06 | 14.62 |
| 6.75 | 1.109E-05 | 8.621E-07 | 7.78 | 1.899E-06 | 17.13 |
| 7.25 | 6.455E-06 | 5.485E-07 | 8.50 | 1.091E-06 | 16.90 |
| 7.75 | 3.568E-06 | 3.999E-07 | 11.21 | 7.173E-07 | 20.10 |
| 8.50 | 1.724E-06 | 1.718E-07 | 9.96 | 3.279E-07 | 19.01 |
| 9.50 | 6.318E-07 | 9.789E-08 | 15.49 | 1.144E-07 | 18.11 |
| 11.00 | 1.701E-07 | 3.347E-08 | 19.68 | 3.147E-08 | 18.51 |
| 13.00 | 5.093E-08 | 1.610E-08 | 31.62 | 9.747E-09 | 19.14 |
| Yield | Stat. Error | % | Sys. Error | % | |
|---|---|---|---|---|---|
| 1.25 | 1.601E+00 | 9.668E-03 | 0.60 | 1.852E-01 | 11.57 |
| 1.75 | 2.879E-01 | 1.911E-03 | 0.66 | 3.260E-02 | 11.32 |
| 2.25 | 6.045E-02 | 5.117E-04 | 0.85 | 7.416E-03 | 12.27 |
| 2.75 | 1.429E-02 | 1.537E-04 | 1.08 | 1.761E-03 | 12.32 |
| 3.25 | 3.983E-03 | 5.534E-05 | 1.39 | 5.192E-04 | 13.04 |
| 3.75 | 1.233E-03 | 2.340E-05 | 1.90 | 1.546E-04 | 12.53 |
| 4.25 | 4.749E-04 | 1.158E-05 | 2.44 | 6.115E-05 | 12.88 |
| 4.75 | 1.732E-04 | 5.898E-06 | 3.41 | 2.258E-05 | 13.04 |
| 5.25 | 7.761E-05 | 3.503E-06 | 4.51 | 1.074E-05 | 13.84 |
| 5.75 | 3.573E-05 | 1.627E-06 | 4.55 | 4.870E-06 | 13.63 |
| 6.25 | 1.714E-05 | 9.568E-07 | 5.58 | 2.389E-06 | 13.94 |
| 6.75 | 9.015E-06 | 6.625E-07 | 7.35 | 1.384E-06 | 15.36 |
| 7.25 | 5.146E-06 | 4.423E-07 | 8.59 | 8.214E-07 | 15.96 |
| 7.75 | 2.878E-06 | 3.267E-07 | 11.35 | 5.465E-07 | 18.99 |
| 8.50 | 1.363E-06 | 1.452E-07 | 10.65 | 2.517E-07 | 18.46 |
| 9.50 | 6.216E-07 | 8.347E-08 | 13.43 | 1.088E-07 | 17.50 |
| 11.00 | 1.825E-07 | 2.972E-08 | 16.28 | 3.299E-08 | 18.08 |
| 13.00 | 3.552E-08 | 1.267E-08 | 35.68 | 6.852E-09 | 19.29 |
| Yield | Stat. Error | % | Sys. Error | % | |
|---|---|---|---|---|---|
| 1.25 | 1.040E+00 | 5.648E-03 | 0.54 | 1.244E-01 | 11.96 |
| 1.75 | 1.754E-01 | 1.100E-03 | 0.63 | 2.001E-02 | 11.41 |
| 2.25 | 3.833E-02 | 3.102E-04 | 0.81 | 4.567E-03 | 11.91 |
| 2.75 | 9.610E-03 | 9.930E-05 | 1.03 | 1.175E-03 | 12.23 |
| 3.25 | 2.670E-03 | 3.764E-05 | 1.41 | 3.512E-04 | 13.15 |
| 3.75 | 8.612E-04 | 1.667E-05 | 1.94 | 1.097E-04 | 12.74 |
| 4.25 | 3.270E-04 | 8.158E-06 | 2.49 | 4.185E-05 | 12.80 |
| 4.75 | 1.252E-04 | 4.421E-06 | 3.53 | 1.619E-05 | 12.94 |
| 5.25 | 5.266E-05 | 2.822E-06 | 5.36 | 7.394E-06 | 14.04 |
| 5.75 | 2.761E-05 | 1.348E-06 | 4.88 | 3.839E-06 | 13.90 |
| 6.25 | 1.189E-05 | 8.138E-07 | 6.85 | 1.949E-06 | 16.39 |
| 6.75 | 7.115E-06 | 5.804E-07 | 8.16 | 1.198E-06 | 16.84 |
| 7.25 | 3.705E-06 | 3.972E-07 | 10.72 | 6.264E-07 | 16.91 |
| 7.75 | 1.898E-06 | 2.549E-07 | 13.42 | 3.307E-07 | 17.42 |
| 8.50 | 1.168E-06 | 1.301E-07 | 11.13 | 1.967E-07 | 16.83 |
| 9.50 | 5.043E-07 | 8.312E-08 | 16.48 | 9.634E-08 | 19.10 |
| 11.00 | 1.541E-07 | 2.748E-08 | 17.83 | 2.910E-08 | 18.89 |
| 13.00 | 2.941E-08 | 1.278E-08 | 33.46 | 5.621E-09 | 19.11 |
| Yield | Stat. Error | % | Sys. Error | % | |
|---|---|---|---|---|---|
| 1.25 | 6.389E-01 | 3.367E-03 | 0.53 | 7.216E-02 | 11.29 |
| 1.75 | 1.156E-01 | 6.789E-04 | 0.59 | 1.315E-02 | 11.37 |
| 2.25 | 2.442E-02 | 1.926E-04 | 0.79 | 2.911E-03 | 11.92 |
| 2.75 | 6.172E-03 | 6.521E-05 | 1.06 | 7.890E-04 | 12.78 |
| 3.25 | 1.682E-03 | 2.455E-05 | 1.46 | 2.194E-04 | 13.04 |
| 3.75 | 5.822E-04 | 1.161E-05 | 1.99 | 7.179E-05 | 12.33 |
| 4.25 | 1.927E-04 | 6.113E-06 | 3.17 | 2.480E-05 | 12.87 |
| 4.75 | 8.818E-05 | 3.476E-06 | 3.94 | 1.169E-05 | 13.26 |
| 5.25 | 3.627E-05 | 2.166E-06 | 5.97 | 4.995E-06 | 13.77 |
| 5.75 | 1.611E-05 | 9.656E-07 | 5.99 | 2.261E-06 | 14.04 |
| 6.25 | 9.635E-06 | 6.880E-07 | 7.14 | 1.490E-06 | 15.47 |
| 6.75 | 4.467E-06 | 4.278E-07 | 9.58 | 7.232E-07 | 16.19 |
| 7.25 | 2.044E-06 | 2.585E-07 | 12.65 | 3.197E-07 | 15.64 |
| 7.75 | 1.363E-06 | 2.198E-07 | 16.13 | 2.882E-07 | 21.15 |
| 8.50 | 7.878E-07 | 1.056E-07 | 13.41 | 1.409E-07 | 17.88 |
| 9.50 | 2.197E-07 | 5.630E-08 | 25.62 | 4.969E-08 | 22.61 |
| 11.00 | 1.053E-07 | 2.280E-08 | 21.66 | 2.116E-08 | 20.10 |
| 13.00 | 2.792E-08 | 1.140E-08 | 40.82 | 6.121E-09 | 21.92 |
| Yield | Stat. Error | % | Sys. Error | % | |
|---|---|---|---|---|---|
| 1.25 | 3.593E-01 | 1.941E-03 | 0.54 | 4.022E-02 | 11.19 |
| 1.75 | 6.197E-02 | 4.018E-04 | 0.65 | 7.069E-03 | 11.41 |
| 2.25 | 1.309E-02 | 1.175E-04 | 0.90 | 1.553E-03 | 11.87 |
| 2.75 | 3.479E-03 | 4.211E-05 | 1.21 | 4.205E-04 | 12.09 |
| 3.25 | 1.019E-03 | 1.695E-05 | 1.66 | 1.291E-04 | 12.67 |
| 3.75 | 3.480E-04 | 8.518E-06 | 2.45 | 4.380E-05 | 12.59 |
| 4.25 | 1.329E-04 | 4.558E-06 | 3.43 | 1.763E-05 | 13.26 |
| 4.75 | 4.959E-05 | 2.434E-06 | 4.91 | 6.310E-06 | 12.73 |
| 5.25 | 2.125E-05 | 1.585E-06 | 7.46 | 3.032E-06 | 14.27 |
| 5.75 | 9.917E-06 | 7.569E-07 | 7.63 | 1.540E-06 | 15.52 |
| 6.25 | 6.127E-06 | 5.471E-07 | 8.93 | 9.978E-07 | 16.29 |
| 6.75 | 3.246E-06 | 3.392E-07 | 10.45 | 4.965E-07 | 15.30 |
| 7.25 | 1.664E-06 | 2.449E-07 | 14.72 | 3.102E-07 | 18.65 |
| 7.75 | 1.129E-06 | 1.886E-07 | 16.70 | 2.114E-07 | 18.72 |
| 8.50 | 3.362E-07 | 7.419E-08 | 22.07 | 6.694E-08 | 19.91 |
| 9.50 | 1.817E-07 | 4.619E-08 | 25.42 | 3.329E-08 | 18.32 |
| 11.00 | 2.858E-08 | 1.112E-08 | 38.89 | 4.803E-09 | 16.81 |
| 13.00 | 2.311E-08 | – | – | – | – |
| Yield | Stat. Error | % | Sys. Error | % | |
|---|---|---|---|---|---|
| 1.25 | 1.731E-01 | 1.121E-03 | 0.65 | 1.985E-02 | 11.47 |
| 1.75 | 3.022E-02 | 2.288E-04 | 0.76 | 3.425E-03 | 11.33 |
| 2.25 | 6.567E-03 | 7.011E-05 | 1.07 | 7.773E-04 | 11.84 |
| 2.75 | 1.644E-03 | 2.565E-05 | 1.56 | 2.057E-04 | 12.51 |
| 3.25 | 5.255E-04 | 1.158E-05 | 2.20 | 6.682E-05 | 12.72 |
| 3.75 | 1.801E-04 | 6.044E-06 | 3.36 | 2.259E-05 | 12.54 |
| 4.25 | 6.986E-05 | 3.184E-06 | 4.56 | 9.254E-06 | 13.25 |
| 4.75 | 2.312E-05 | 1.631E-06 | 7.06 | 3.101E-06 | 13.41 |
| 5.25 | 1.156E-05 | 1.145E-06 | 9.90 | 1.720E-06 | 14.87 |
| 5.75 | 4.884E-06 | 5.045E-07 | 10.33 | 7.560E-07 | 15.48 |
| 6.25 | 2.690E-06 | 3.650E-07 | 13.57 | 4.303E-07 | 16.00 |
| 6.75 | 1.822E-06 | 2.658E-07 | 14.58 | 3.369E-07 | 18.48 |
| 7.25 | 6.281E-07 | 1.480E-07 | 23.57 | 1.178E-07 | 18.76 |
| 7.75 | 2.446E-07 | 1.082E-07 | 44.22 | 4.632E-08 | 18.94 |
| 8.50 | 1.417E-07 | 4.482E-08 | 31.62 | 2.707E-08 | 19.10 |
| 9.50 | 1.094E-07 | 3.843E-08 | 35.14 | 2.106E-08 | 19.26 |
| 11.00 | 2.492E-08 | 1.114E-08 | 44.72 | 4.816E-09 | 19.33 |
| 13.00 | 4.728E-09 | 4.728E-09 | 100.00 | 9.226E-10 | 19.51 |
| Yield | Stat. Error | % | Sys. Error | % | |
|---|---|---|---|---|---|
| 1.25 | 7.416E-02 | 5.166E-04 | 0.70 | 8.842E-03 | 11.92 |
| 1.75 | 1.282E-02 | 1.189E-04 | 0.93 | 1.496E-03 | 11.67 |
| 2.25 | 2.721E-03 | 3.774E-05 | 1.39 | 3.245E-04 | 11.92 |
| 2.75 | 7.455E-04 | 1.514E-05 | 2.03 | 9.131E-05 | 12.25 |
| 3.25 | 2.461E-04 | 7.508E-06 | 3.05 | 3.248E-05 | 13.20 |
| 3.75 | 7.200E-05 | 3.689E-06 | 5.12 | 9.687E-06 | 13.46 |
| 4.25 | 2.609E-05 | 2.071E-06 | 7.94 | 4.034E-06 | 15.46 |
| 4.75 | 1.288E-05 | 1.308E-06 | 10.15 | 2.161E-06 | 16.78 |
| 5.25 | 4.650E-06 | 7.727E-07 | 16.62 | 9.050E-07 | 19.46 |
| 5.75 | 2.416E-06 | 3.897E-07 | 16.13 | 4.736E-07 | 19.60 |
| 6.25 | 1.763E-06 | 2.713E-07 | 15.39 | 2.795E-07 | 15.85 |
| 6.75 | 5.945E-07 | 1.651E-07 | 27.77 | 1.221E-07 | 20.53 |
| 7.25 | 4.817E-07 | 1.245E-07 | 25.84 | 8.088E-08 | 16.79 |
| 7.75 | 1.344E-07 | 6.718E-08 | 50.00 | 2.545E-08 | 18.94 |
| 8.50 | 1.135E-07 | 4.012E-08 | 35.36 | 2.167E-08 | 19.10 |
| 9.50 | 4.968E-08 | 2.484E-08 | 50.00 | 9.568E-09 | 19.26 |
| 11.00 | 5.060E-09 | 5.060E-09 | 100.00 | 9.778E-10 | 19.33 |
| Yield | Stat. Error | % | Sys. Error | % | |
|---|---|---|---|---|---|
| 1.25 | 3.494E-02 | 6.093E-04 | 1.74 | 4.504E-03 | 12.89 |
| 1.75 | 6.037E-03 | 1.291E-04 | 2.14 | 7.607E-04 | 12.60 |
| 2.25 | 1.319E-03 | 3.628E-05 | 2.75 | 1.701E-04 | 12.89 |
| 2.75 | 3.321E-04 | 1.243E-05 | 3.74 | 4.570E-05 | 13.76 |
| 3.25 | 1.059E-04 | 5.281E-06 | 4.99 | 1.483E-05 | 14.01 |
| 3.75 | 3.625E-05 | 2.408E-06 | 6.64 | 4.455E-06 | 12.29 |
| 4.25 | 1.233E-05 | 1.293E-06 | 10.48 | 1.730E-06 | 14.03 |
| 4.75 | 6.501E-06 | 7.988E-07 | 12.29 | 9.044E-07 | 13.91 |
| 5.25 | 3.018E-06 | 5.360E-07 | 17.76 | 4.224E-07 | 13.99 |
| 5.75 | 1.072E-06 | 2.315E-07 | 21.60 | 1.815E-07 | 16.94 |
| 6.25 | 3.265E-07 | 1.154E-07 | 35.36 | 5.945E-08 | 18.21 |
| 6.75 | 2.805E-07 | 9.918E-08 | 35.36 | 5.185E-08 | 18.48 |
| 7.25 | 2.231E-07 | 8.434E-08 | 37.80 | 4.187E-08 | 18.76 |
| 7.75 | 8.467E-08 | 4.888E-08 | 57.74 | 1.604E-08 | 18.94 |
| 8.50 | 3.602E-08 | 2.080E-08 | 57.74 | 6.880E-09 | 19.10 |
| 9.50 | 1.077E-08 | 1.077E-08 | 100.00 | 2.074E-09 | 19.26 |
| 11.00 | 4.375E-09 | 4.375E-09 | 100.00 | 8.455E-10 | 19.32 |
| Yield | Stat. Error | % | Sys. Error | % | |
|---|---|---|---|---|---|
| 1.25 | 1.078E+00 | 3.333E-03 | 0.31 | 1.205E-01 | 11.17 |
| 1.75 | 1.928E-01 | 6.847E-04 | 0.36 | 2.171E-02 | 11.26 |
| 2.25 | 4.038E-02 | 1.742E-04 | 0.43 | 4.822E-03 | 11.94 |
| 2.75 | 9.578E-03 | 5.293E-05 | 0.55 | 1.202E-03 | 12.55 |
| 3.25 | 2.564E-03 | 1.858E-05 | 0.72 | 3.375E-04 | 13.17 |
| 3.75 | 8.115E-04 | 7.353E-06 | 0.91 | 1.013E-04 | 12.48 |
| 4.25 | 2.906E-04 | 3.475E-06 | 1.20 | 3.729E-05 | 12.84 |
| 4.75 | 1.121E-04 | 1.806E-06 | 1.61 | 1.466E-05 | 13.08 |
| 5.25 | 4.924E-05 | 1.031E-06 | 2.09 | 6.494E-06 | 13.19 |
| 5.75 | 2.240E-05 | 4.723E-07 | 2.11 | 3.012E-06 | 13.45 |
| 6.25 | 1.190E-05 | 2.909E-07 | 2.44 | 1.647E-06 | 13.83 |
| 6.75 | 5.970E-06 | 1.943E-07 | 3.25 | 8.494E-07 | 14.23 |
| 7.25 | 3.246E-06 | 1.273E-07 | 3.92 | 4.758E-07 | 14.65 |
| 7.75 | 1.715E-06 | 9.049E-08 | 5.28 | 2.658E-07 | 15.49 |
| 8.50 | 8.583E-07 | 3.892E-08 | 4.53 | 1.285E-07 | 14.98 |
| 9.50 | 3.078E-07 | 2.351E-08 | 7.64 | 5.041E-08 | 16.38 |
| 11.00 | 9.178E-08 | 7.770E-09 | 8.47 | 1.417E-08 | 15.44 |
| 13.00 | 2.380E-08 | 3.856E-09 | 16.20 | 3.816E-09 | 16.03 |
| Yield | Stat. Error | % | Sys. Error | % | |
|---|---|---|---|---|---|
| 1.25 | 2.684E+00 | 1.455E-02 | 0.54 | 3.106E-01 | 11.58 |
| 1.75 | 5.059E-01 | 2.875E-03 | 0.57 | 5.131E-02 | 10.14 |
| 2.25 | 1.033E-01 | 7.343E-04 | 0.71 | 1.137E-02 | 11.01 |
| 2.75 | 2.373E-02 | 2.198E-04 | 0.93 | 2.837E-03 | 11.96 |
| 3.25 | 6.014E-03 | 7.501E-05 | 1.25 | 7.693E-04 | 12.79 |
| 3.75 | 1.912E-03 | 2.840E-05 | 1.49 | 2.137E-04 | 11.18 |
| 4.25 | 6.522E-04 | 1.307E-05 | 2.00 | 7.660E-05 | 11.74 |
| 4.75 | 2.484E-04 | 6.637E-06 | 2.67 | 3.055E-05 | 12.30 |
| 5.25 | 1.118E-04 | 3.683E-06 | 3.29 | 1.368E-05 | 12.23 |
| 5.75 | 5.034E-05 | 1.670E-06 | 3.32 | 6.775E-06 | 13.46 |
| 6.25 | 2.582E-05 | 9.994E-07 | 3.87 | 3.466E-06 | 13.43 |
| 6.75 | 1.194E-05 | 6.415E-07 | 5.37 | 1.825E-06 | 15.29 |
| 7.25 | 7.048E-06 | 4.237E-07 | 6.01 | 1.115E-06 | 15.82 |
| 7.75 | 4.099E-06 | 3.073E-07 | 7.50 | 7.159E-07 | 17.46 |
| 8.50 | 1.804E-06 | 1.247E-07 | 6.92 | 3.037E-07 | 16.84 |
| 9.50 | 8.445E-07 | 8.042E-08 | 9.52 | 1.491E-07 | 17.65 |
| 11.00 | 2.239E-07 | 2.714E-08 | 12.12 | 4.219E-08 | 18.84 |
| 13.00 | 5.517E-08 | 1.011E-08 | 18.32 | 1.044E-08 | 18.93 |
| Yield | Stat. Error | % | Sys. Error | % | |
|---|---|---|---|---|---|
| 1.25 | 9.097E-01 | 2.963E-03 | 0.33 | 9.041E-02 | 9.94 |
| 1.75 | 1.602E-01 | 5.854E-04 | 0.37 | 1.570E-02 | 9.80 |
| 2.25 | 3.407E-02 | 1.599E-04 | 0.47 | 3.579E-03 | 10.51 |
| 2.75 | 8.386E-03 | 4.969E-05 | 0.59 | 9.138E-04 | 10.90 |
| 3.25 | 2.339E-03 | 1.832E-05 | 0.78 | 2.711E-04 | 11.59 |
| 3.75 | 7.562E-04 | 8.034E-06 | 1.06 | 8.387E-05 | 11.09 |
| 4.25 | 2.819E-04 | 4.021E-06 | 1.43 | 3.259E-05 | 11.56 |
| 4.75 | 1.090E-04 | 2.126E-06 | 1.95 | 1.263E-05 | 11.58 |
| 5.25 | 4.695E-05 | 1.310E-06 | 2.79 | 5.959E-06 | 12.69 |
| 5.75 | 2.234E-05 | 6.107E-07 | 2.73 | 2.907E-06 | 13.01 |
| 6.25 | 1.120E-05 | 3.833E-07 | 3.42 | 1.605E-06 | 14.33 |
| 6.75 | 5.961E-06 | 2.591E-07 | 4.35 | 8.809E-07 | 14.78 |
| 7.25 | 3.140E-06 | 1.732E-07 | 5.52 | 4.937E-07 | 15.73 |
| 7.75 | 1.817E-06 | 1.264E-07 | 6.96 | 3.292E-07 | 18.12 |
| 8.50 | 9.139E-07 | 5.846E-08 | 6.40 | 1.581E-07 | 17.30 |
| 9.50 | 3.818E-07 | 3.462E-08 | 9.07 | 7.055E-08 | 18.48 |
| 11.00 | 1.176E-07 | 1.194E-08 | 10.15 | 2.061E-08 | 17.52 |
| 13.00 | 2.899E-08 | 6.031E-09 | 20.80 | 4.497E-09 | 15.51 |
| Yield | Stat. Error | % | Sys. Error | % | |
|---|---|---|---|---|---|
| 1.25 | 9.037E-02 | 4.484E-04 | 0.50 | 9.891E-03 | 10.94 |
| 1.75 | 1.571E-02 | 9.400E-05 | 0.60 | 1.680E-03 | 10.69 |
| 2.25 | 3.397E-03 | 2.836E-05 | 0.83 | 3.765E-04 | 11.08 |
| 2.75 | 8.712E-04 | 1.041E-05 | 1.19 | 1.025E-04 | 11.76 |
| 3.25 | 2.808E-04 | 4.746E-06 | 1.69 | 3.442E-05 | 12.26 |
| 3.75 | 9.236E-05 | 2.390E-06 | 2.59 | 1.073E-05 | 11.61 |
| 4.25 | 3.461E-05 | 1.282E-06 | 3.70 | 4.593E-06 | 13.27 |
| 4.75 | 1.369E-05 | 7.188E-07 | 5.25 | 1.857E-06 | 13.57 |
| 5.25 | 6.198E-06 | 4.761E-07 | 7.68 | 9.308E-07 | 15.02 |
| 5.75 | 2.683E-06 | 2.173E-07 | 8.10 | 4.415E-07 | 16.46 |
| 6.25 | 1.514E-06 | 1.486E-07 | 9.81 | 2.414E-07 | 15.94 |
| 6.75 | 8.605E-07 | 1.046E-07 | 12.16 | 1.589E-07 | 18.46 |
| 7.25 | 4.305E-07 | 6.822E-08 | 15.85 | 7.426E-08 | 17.25 |
| 7.75 | 1.502E-07 | 4.381E-08 | 29.17 | 2.719E-08 | 18.10 |
| 8.50 | 9.326E-08 | 2.035E-08 | 21.82 | 1.706E-08 | 18.29 |
| 9.50 | 5.374E-08 | 1.486E-08 | 27.65 | 9.997E-09 | 18.60 |
| 11.00 | 1.101E-08 | 4.162E-09 | 37.80 | 2.062E-09 | 18.73 |
| 13.00 | 1.478E-09 | 1.478E-09 | 100.00 | 2.883E-10 | 19.51 |
References
- Adcox et al. (2002a) K. Adcox et al. (PHENIX), Phys. Rev. Lett. 89, 212301 (2002a), eprint nucl-ex/0204005.
- Ackermann et al. (2001) K. H. Ackermann et al. (STAR), Phys. Rev. Lett. 86, 402 (2001), eprint nucl-ex/0009011.
- Adcox et al. (2002b) K. Adcox et al. (PHENIX), Phys. Rev. Lett. 88, 022301 (2002b), eprint nucl-ex/0109003.
- Adcox et al. (2003a) K. Adcox et al. (PHENIX), Phys. Lett. B561, 82 (2003a), eprint nucl-ex/0207009.
- Adams et al. (2003a) J. Adams et al. (STAR), Phys. Rev. Lett. 91, 172302 (2003a), eprint nucl-ex/0305015.
- Adler et al. (2003a) S. S. Adler et al. (PHENIX), Phys. Rev. Lett. 91, 072301 (2003a), eprint nucl-ex/0304022.
- Adler et al. (2004a) S. S. Adler et al. (PHENIX), Phys. Rev. C69, 034910 (2004a), eprint nucl-ex/0308006.
- Arsene et al. (2003) I. Arsene et al. (BRAHMS), Phys. Rev. Lett. 91, 072305 (2003), eprint nucl-ex/0307003.
- Back et al. (2004) B. B. Back et al. (PHOBOS), Phys. Lett. B578, 297 (2004), eprint nucl-ex/0302015.
- Adler et al. (2003b) S. S. Adler et al. (PHENIX), Phys. Rev. Lett. 91, 072303 (2003b), eprint nucl-ex/0306021.
- Adams et al. (2003b) J. Adams et al. (STAR), Phys. Rev. Lett. 91, 072304 (2003b), eprint nucl-ex/0306024.
- Back et al. (2003) B. B. Back et al. (PHOBOS), Phys. Rev. Lett. 91, 072302 (2003), eprint nucl-ex/0306025.
- Adler et al. (2006a) S. S. Adler et al. (PHENIX), Phys. Rev. Lett. 96, 202301 (2006a), eprint nucl-ex/0601037.
- Adler et al. (2005a) S. S. Adler et al. (PHENIX), Phys. Rev. Lett. 94, 232301 (2005a), eprint nucl-ex/0503003.
- Adler et al. (2003c) C. Adler et al. (STAR), Phys. Rev. Lett. 90, 032301 (2003c), eprint nucl-ex/0206006.
- Bass et al. (1999) S. A. Bass et al., Nucl. Phys. A661, 205 (1999), eprint nucl-th/9907090.
- Gyulassy et al. (2003) M. Gyulassy, I. Vitev, X.-N. Wang, and B.-W. Zhang, Jet quenching and radiative energy loss in dense nuclear matter, vol. 3 of Quark Gluon Plasma (World Scientific, Singapore, 2003), eprint nucl-th/0302077.
- Kovner and Wiedemann (2003) A. Kovner and U. A. Wiedemann, Gluon radiation and parton energy loss, vol. 3 of Quark Gluon Plasma (World Scientific, Singapore, 2003), eprint hep-ph/0304151.
- Wang and Gyulassy (1992) X.-N. Wang and M. Gyulassy, Phys. Rev. Lett. 68, 1480 (1992).
- Vitev and Gyulassy (2002) I. Vitev and M. Gyulassy, Phys. Rev. Lett. 89, 252301 (2002), eprint hep-ph/0209161.
- Wang and Wang (2002) E. Wang and X.-N. Wang, Phys. Rev. Lett. 89, 162301 (2002), eprint hep-ph/0202105.
- Eskola et al. (2005) K. J. Eskola, H. Honkanen, C. A. Salgado, and U. A. Wiedemann, Nucl. Phys. A747, 511 (2005), eprint hep-ph/0406319.
- Gyulassy and McLerran (2005) M. Gyulassy and L. McLerran, Nucl. Phys. A750, 30 (2005), eprint nucl-th/0405013.
- Wang (2005) X.-N. Wang, Nucl. Phys. A750, 98 (2005), eprint nucl-th/0405017.
- Aurenche et al. (2000) P. Aurenche, F. Gelis, and H. Zaraket, Phys. Rev. D62, 096012 (2000), eprint hep-ph/0003326.
- Arneodo (1994) M. Arneodo, Phys. Rept. 240, 301 (1994).
- Baier et al. (2000) R. Baier, D. Schiff, and B. G. Zakharov, Ann. Rev. Nucl. Part. Sci. 50, 37 (2000), eprint hep-ph/0002198.
- Gyulassy et al. (2002a) M. Gyulassy, P. Levai, and I. Vitev, Phys. Lett. B538, 282 (2002a), eprint nucl-th/0112071.
- Drees et al. (2005) A. Drees, H. Feng, and J. Jia, Phys. Rev. C71, 034909 (2005), eprint nucl-th/0310044.
- Gyulassy et al. (2001) M. Gyulassy, I. Vitev, and X. N. Wang, Phys. Rev. Lett. 86, 2537 (2001), eprint nucl-th/0012092.
- Gyulassy et al. (2002b) M. Gyulassy, I. Vitev, X.-N. Wang, and P. Huovinen, Phys. Lett. B526, 301 (2002b), eprint nucl-th/0109063.
- Shuryak (2002) E. V. Shuryak, Phys. Rev. C66, 027902 (2002), eprint nucl-th/0112042.
- Muller (2003) B. Muller, Phys. Rev. C67, 061901 (2003), eprint nucl-th/0208038.
- Adler et al. (2006b) S. S. Adler et al. (PHENIX), Phys. Rev. Lett. 96, 032302 (2006b), eprint nucl-ex/0508019.
- Adcox et al. (2003b) K. Adcox et al. (PHENIX), Nucl. Instrum. Meth. A499, 469 (2003b).
- Hahn et al. (2003) H. Hahn et al., Nucl. Instrum. Meth. A499, 245 (2003).
- Aphecetche et al. (2003) L. Aphecetche et al. (PHENIX), Nucl. Instrum. Meth. A499, 521 (2003).
- Allen et al. (2003) M. Allen et al. (PHENIX), Nucl. Instrum. Meth. A499, 549 (2003).
- Adler et al. (2001) C. Adler et al., Nucl. Instrum. Meth. A470, 488 (2001), eprint nucl-ex/0008005.
- Adler et al. (2003d) S. S. Adler et al. (PHENIX), Nucl. Instrum. Meth. A499, 560 (2003d).
- Adcox et al. (2001) K. Adcox et al. (PHENIX), Phys. Rev. Lett. 86, 3500 (2001), eprint nucl-ex/0012008.
- Adler et al. (2003e) S. S. Adler et al. (PHENIX), Phys. Rev. Lett. 91, 182301 (2003e), eprint nucl-ex/0305013.
- Adler et al. (2005b) S. S. Adler et al. (PHENIX), Phys. Rev. C72, 024901 (2005b), eprint nucl-ex/0502009.
- Poskanzer and Voloshin (1998) A. M. Poskanzer and S. A. Voloshin, Phys. Rev. C58, 1671 (1998), eprint nucl-ex/9805001.
- Jia (2006) J. Jia (PHENIX), nucl-ex/0609009 (2006), eprint nucl-ex/0609009.
- Adler et al. (2003f) S. S. Adler et al. (PHENIX), Phys. Rev. Lett. 91, 241803 (2003f), eprint hep-ex/0304038.
- Adler et al. (2004b) S. S. Adler et al. (PHENIX), Phys. Rev. Lett. 93, 202002 (2004b), eprint hep-ex/0404027.
- Sjostrand et al. (2001) T. Sjostrand et al., Comput. Phys. Commun. 135, 238 (2001), eprint hep-ph/0010017.
- Lafferty and Wyatt (1995) G. D. Lafferty and T. R. Wyatt, Nucl. Instrum. Meth. A355, 541 (1995).
- Eidelman et al. (2004) S. Eidelman et al. (Particle Data Group), Phys. Lett. B592, 1 (2004).
- Adler (2006) S. S. Adler (PHENIX), Phys. Rev. Lett., to be submitted (2006), eprint PPG044.
- Vitev (2006) I. Vitev, hep-ph/0603010 (2006), eprint hep-ph/0603010.
- Dainese et al. (2005a) A. Dainese, C. Loizides, and G. Paic, Proceeds. QM’05 (2005a), eprint hep-ph/0511045.
- Jacob and Landshoff (1978) M. Jacob and P. V. Landshoff, Phys. Rept. 48, 285 (1978).
- Dainese et al. (2005b) A. Dainese, C. Loizides, and G. Paic, Eur. Phys. J. C38, 461 (2005b), eprint hep-ph/0406201.
- Pantuev (2005) V. S. Pantuev, hep-ph/0506095 (2005), eprint hep-ph/0506095.
- Shuryak and Zahed (2004) E. V. Shuryak and I. Zahed, Phys. Rev. C70, 021901 (2004), eprint hep-ph/0307267.