PHENIX Collaboration
High transverse momentum meson production
in p+p, d+Au and Au+Au collisions at = 200 GeV
Abstract
Inclusive transverse momentum spectra of mesons in the range 2 – 12 GeV have been measured at mid-rapidity () by the PHENIX experiment at RHIC in p+p, d+Au and Au+Au collisions at = 200 GeV. The mesons are reconstructed through their channel for the three colliding systems as well as through the decay mode in p+p and d+Au collisions. The nuclear modification factor in d+Au collisions, 1.0 – 1.1, suggests at most only modest broadening (“Cronin enhancement”). In central Au+Au reactions, the yields are significantly suppressed, with 0.2. The ratio of to yields is approximately constant as a function of for the three colliding systems in agreement with the high- world average of 0.5 in hadron-hadron, hadron-nucleus, and nucleus-nucleus collisions for a wide range of center-of-mass energies ( 3 – 1800 GeV) as well as, for high scaled momentum , in annihilations at 91.2 GeV. These results are consistent with a scenario where high- production in nuclear collisions at RHIC is largely unaffected by initial-state effects, but where light-quark mesons () are equally suppressed due to final-state interactions of the parent partons in the dense medium produced in Au+Au reactions.
pacs:
25.75.-q,12.38.Mh,13.85.-t,13.87.FhI INTRODUCTION
Single-hadron production at large transverse momenta
( 2 GeV/) in high-energy hadronic and nuclear
collisions results from the fragmentation of quarks and gluons
issuing from parton-parton scatterings with large momentum transfer .
Since the cross-sections for such hard processes can be calculated
perturbatively within Quantum Chromodynamics (QCD) pQCD , inclusive
high- hadrons (as well as jets, real and virtual direct photons,
and heavy quarks) have long been considered sensitive, well calibrated probes of the
small-distance QCD processes.
The study of inclusive hadron production at large in proton-proton interactions provides valuable information about
perturbative QCD (pQCD), parton distribution functions (PDF) in the
proton, and fragmentation functions (FF) of the partons geist90 .
Furthermore, the use of polarized beams () allows one
to investigate the spin structure of the
proton bunce00 . High-energy collisions of protons or deuterons
on nuclear targets (p,d+A) also provide interesting insights
on initial- and final-state QCD effects such as modifications of the
nuclear PDFs arneodo ; armesto06 and parton rescattering in the cold nuclear
medium cronin . Both effects are sensitive to
physics such as parton structure and evolution at small values
of fractional momentum in the hadronic wave functions iancu03 ,
and the dynamics of hadronization in cold nuclei kopelio03 ; hwa04 .
Lastly, high- hadron production in nucleus-nucleus (A+A) reactions
is a sensitive probe of the properties of the strongly interacting QCD matter
produced in the collision. Indeed, since perturbative processes happen at time scales
0.1 fm/, the hard-scattered partons traverse and are
potentially modified by the bulk matter formed shortly after the collision.
In this context, the suppression of leading hadrons has been
postulated gyulassy90 as a signal of “jet quenching” in a Quark-Gluon-Plasma
(QGP) due to medium-induced energy-loss of the parent parton bdmps ; glv ; wiedemann .
All the aforementioned research topics have been addressed in detail by the rich physics program carried out at the Relativistic Heavy-Ion Collider (RHIC) at Brookhaven National Laboratory (BNL) during its first six years of operation (2000 – 2006). For example, the study of inclusive high- neutral pion production at mid-rapidity in p+p ppg024 , phnx_spin_pi0 , d+Au ppg028 ; ppg044 and Au+Au ppg003 ; ppg014 ; ppg051 ; ppg054 collisions at = 200 GeV, has provided valuable information respectively on:
-
(ii) the gluon contribution to the proton spin vogelsang_spin ; bourrely03 ; anselmino04 ,
-
(iii) initial-state effects in cold nuclear matter such as shadowing of the nuclear PDFs eks98 ; deFlorian03 ; Kopeliovich03 ; vogt04 , Cronin broadening accardi04 ; cattaruzza04 ; barna04 , and gluon saturation albacete03 ; Iancu04 ; jamal05 ,
-
(iv) the thermodynamical and microscopic properties of hot and dense QCD matter dde_qcdatwork , such as the initial gluon rapidity density vitev_gyulassy and the transport coefficient eskola04 ; dainese04 of the produced medium; and the mechanism of hadronization in a dense parton medium recomb .
In this paper, we extend previous PHENIX analyses of high- hadron production in p+p ppg024 ; phnx_spin_pi0 , d+Au ppg028 and Au+Au ppg014 ; ppg023 ; ppg051 ; ppg054 collisions at = 200 GeV, to include an additional identified particle, the meson, measured in the range = 2 – 12 GeV/. The spectra presented here are the hardest (i.e. have the highest ) ever measured for the meson111Before this measurement, only the ISR AFS Collaboration p+p+X measurement for = 3 – 11 GeV/ at = 62.4 GeV Kourkoumelis79 and the single CDF point measured at = 12 GeV/ in collisions at = 1800 GeV Abe93 had comparable maximum values. in p+p, p+A and A+A collisions. The high reach of the helps to characterize the mechanisms of truly perturbative parton-parton scatterings and parton fragmentation in different QCD environments (p+p, d+A and Au+Au). The data from p+p collisions are presented here as a baseline for medium effects in d+Au and Au+Au. Once a parametrization of the FF in is performed (see Section IV.5.2), the observed p+p cross section will additionally allow a test of pQCD predictions. Such a FF parametrization would be useful in particular in the light of upcoming high- asymmetry data obtained with polarized beams of relevance for the proton spin program phenix_eta_spin .
For d+Au and Au+Au reactions, we present the single spectra, the
nuclear modification factors, and the -to- ratio measured as a function of
in different centralities. Within uncertainties, the d+Au spectra for all centralities
are consistent with the p+p yields scaled by the corresponding number of incoherent
nucleon-nucleon () collisions. The maximum amount of broadening seen in the data is 10%, 1.0 – 1.1. Such a result confirms
the limited influence of cold nuclear matter effects, such as shadowing, Cronin
broadening or recombination, on high- meson production at mid-rapidity at RHIC ppg028 ; ppg044 .
On the other hand, the factor of 5 deficit of inclusive yields observed
above 4 GeV/ in central Au+Au compared to binary-scaled p+p collisions,
0.2, is the same as that found for high- ppg014 ; ppg054
and for inclusive charged hadrons ppg023 ; star_hipt_200 .
Such a common suppression pattern for , and is expected if the
energy loss takes place at the parton level in the dense medium formed in the reaction
prior to its fragmentation into a given hadron in the vacuum. Indeed, in this case
the high- deficit will just depend on the energy lost by the parent light-quark
or gluon (i.e. on the initial density of scatterers in the produced medium) and not on the nature
of the final leading hadron whose production will be described by the same universal
probabilities (fragmentation functions) which govern vacuum hadron production
in more elementary systems. Such an interpretation is supported by the fact that the
ratio of -differential cross-sections of mesons with respect to
in Au+Au, d+Au and p+p collisions is approximately constant,
0.40 – 0.48, which is consistent with the world average
measured: (i) in hadron-hadron, hadron-nucleus and nucleus-nucleus collisions above
3 GeV/; as well as (ii) in electron-positron annihilations at the pole
( 91.2 GeV) for energetic and with scaled momenta
0.35.
Comparison of our data to a world compilation of ratios is done
in the last section of the paper.
In addition to their interest as a signal in their own right, reliable knowledge of the production of mesons in p+p, d+Au and Au+Au reactions
is also required in order to determine and statistically remove the background of secondary and for other measurements such as single electrons (from heavy-quark
decays) phenix_charm ; phenix_dielec , dielectrons phenix_dielec
and direct photons ppg042 ; pp_gamma .
Indeed, mesons constitute the second most important source after the
of decay electrons (Dalitz and conversion) and photons contributing to these backgrounds.
The paper is organized as follows. Section II presents a description of the experimental setup and detector systems used in this work. Section III provides an explanation of the analysis methods employed to obtain the data. Section IV presents and compares the results ( spectra, nuclear modification factors, and ratios) measured in p+p, d+Au and Au+Au at = 200 GeV, and discusses the relative role of cold nuclear (d+Au) and hot and dense medium (Au+Au) effects on high- meson production. In particular, Section IV.5 discusses the measured -to- ratios in the context of different phenomenological models of high- hadron production as well as in comparison to other experimental results measured in high-energy particle collisions at different center-of-mass energies. A less detailed presentation of a subset of these results has already been published in ppg051 .
II EXPERIMENTAL SETUP
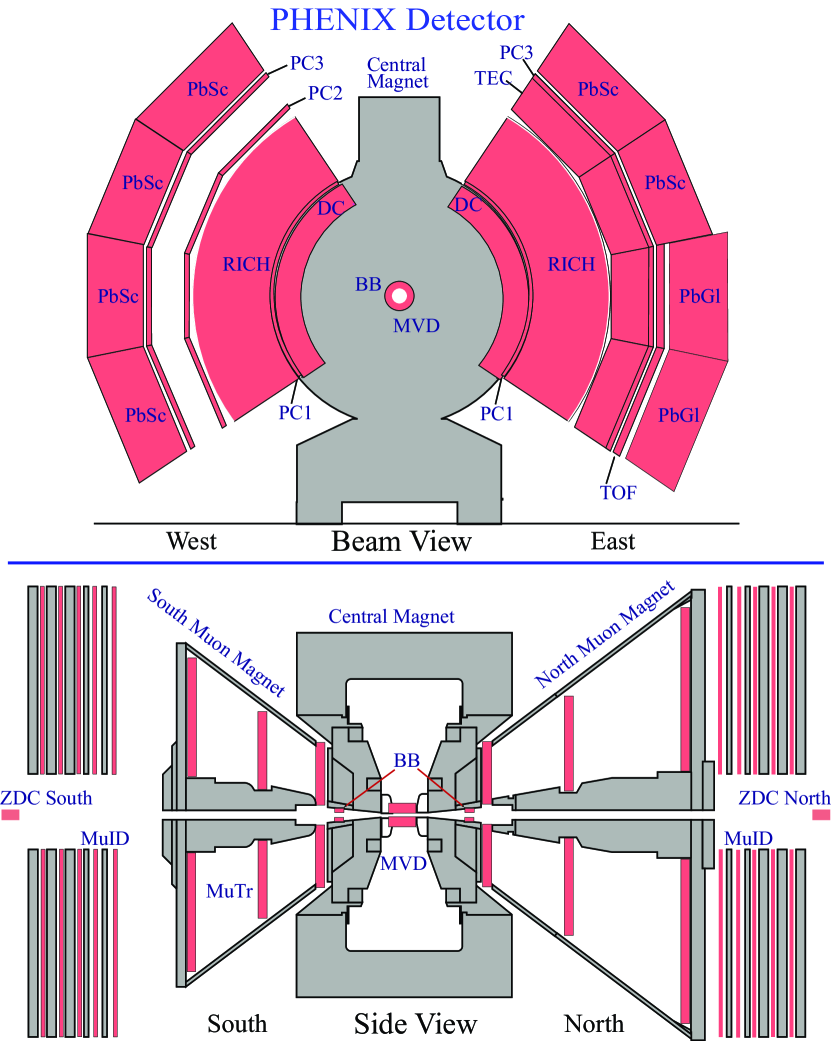
The PHENIX experiment at the RHIC facility nim_rhic at BNL is specifically designed to measure hard QCD probes such as high- hadrons, direct photons, leptons, and heavy flavor production. PHENIX achieves good mass and particle identification (PID) resolutions as well as small granularity by combining 13 detector subsystems (350,000 channels) divided into: (i) two central arm spectrometers for electron, photon and hadron measurements at mid-rapidity (, ); (ii) two forward-backward ( = 1.2 - 2.2, ) spectrometers for muon detection; and (iii) two global (inner) detectors for trigger and centrality selection. A detailed description of the complete detector can be found elsewhere nim_phenix . The data presented in this paper were obtained during the Run-2 (2001–2002, Au+Au) and Run-3 (2003, d+Au, p+p) operations at RHIC. The layout of the PHENIX detector during these run periods is shown in Fig. 1. The primary detectors used to obtain the present results are the PHENIX central arm
spectrometers,
particularly the electromagnetic calorimeters (EMCal) nim_emcal and the
charged particle tracking devices (the Drift Chamber (DC) nim_dc and Pad Chambers (PC) nim_pc ).
In addition, the Beam-Beam Counters (BBC) nim_bbc and the
Zero-Degree Calorimeters (ZDC) nim_zdc are used for triggering,
event characterization and (Au+Au and d+Au) centrality determination.
| collision | Events sampled | Total integrated luminosities | BBC attributes | |||
|---|---|---|---|---|---|---|
| system | MB (LVL1) trigger | High- (Gamma) trigger | absolute | equivalent p+p | cross section | efficiency |
| p+p | 216 nb-1 | 216 nb-1 | 23.0 mb 9.7% | (555)% | ||
| d+Au | 1.5 nb-1 | 590 nb-1 | 1.99 b 5.2% | (884)% | ||
| Au+Au | 9 b-1 | 230 nb-1 | 6.315 b 8.4% | (923)% | ||
II.1 Electromagnetic Calorimeter (EMCal)
The mesons are detected in PHENIX via their (branching ratio BR = 39.43%)
and (BR = 22.6%) decays pdg . Photons from the direct
channel as well as from the secondary (daughter) decays are measured in the
PHENIX EMCal, which has a pseudo-rapidity acceptance of
and covers radians in azimuth. The electromagnetic calorimeter is divided into
eight sectors with two distinct detection technologies (see Fig. 1).
A lead-scintillator
calorimeter (PbSc) consists of 15552 individual lead-scintillator sandwich modules
(5.54 cm 5.54 cm 37.5 cm, 18), grouped in six sectors
located at a radial distance of 5.1 m from the beam line, covering a total
solid angle of and .
A lead-glass Čerenkov calorimeter (PbGl) comprising two sectors, with a total
of 9216 modules (4 cm 4 cm 40 cm, 14.4), is located at a
radial distance of 5 m from the beam pipe and covers a total solid angle
at mid-rapidity of and .
The corresponding acceptance of a single tower at
is and for the PbSc and PbGl
calorimeters, respectively. The chosen transverse size of the towers is not much
larger than their corresponding Molière radius ( = 3.0 cm and 3.7 cm for
PbSc and PbGl, respectively) so that most of the electromagnetic showers extend
over several modules resulting in an improved position resolution based on a
“center of gravity” reconstruction of the impact point of the photon clusters.
The energy calibration of the PbSc modules was obtained from the original beam-test values and redundantly confirmed with (i) the position of the reconstructed mass peak, (ii) the energy deposit from minimum-ionizing charged particles traversing the calorimeter, as well as with (iii) the expected 1 value measured for electrons and positrons identified in the Ring-Imaging Čerenkov (RICH) detector and whose momentum was measured in the tracking detectors. In the PbGl modules, the reference energy calibration from the original beam-test values is corrected with the time-dependent gain corrections obtained with a light-emission-diode (LED) system for the lead-glass calorimeter. The LEDs emit light with known intensity, so gain fluctuations can be detected. The final PbGl calibration is obtained by comparing the measured peak position to its nominal value.
II.2 Central Arm Tracking
Charged pions are measured with the PHENIX central tracking system combining
information from the drift and pad chambers.
The momenta of the are measured at a radius of 2.0 m from the event vertex by
the Drift Chamber (DC). The DC, located outside the field of PHENIX
central magnets, uses several layers of wires to reconstruct the angle of the track, which
is inversely proportional to its momentum. The DC momentum resolution is determined to
be 0.71.1% (GeV/). The polar angle of the track is measured by
Pad Chamber 1 (PC1), a multi-wire proportional chamber located just beyond
the DC. The last pad-chamber layer, PC3, at a radius of 5.0 m and directly in front of the EMCal,
is used in this analysis for two purposes: to confirm the track by matching to a PC3 hit,
as well as to veto an EMCal cluster produced by a charged particle track.
The DC momentum scale is checked by the reconstruction of the correct mass of (i) , , identified with the time-of-flight system nim_pid , and (ii) , , mesons decaying into the channel identified with the RICH and EMCal. The momentum scale is thus known with an accuracy better than 0.2%. Since at low , the momentum resolution is better when measured with the tracking system than that using the energy measured via calorimetry, and given that the momentum range of the three decay products has a relatively low , the uncertainties in the tracking system calibration are less important in the measurement than in the decay channel. As a result, the tracking devices provide better accuracy for the mass reconstruction than the EMCal.
II.3 Global Detectors
Triggering and global event characterization is achieved using the Beam-Beam Counters
(BBC) and the Zero-Degree Calorimeters (ZDC).
The two BBC are placed around the beam pipe 1.44 m in each direction from the nominal
interaction point. Each BBC consists of 64 hexagonal quartz Čerenkov
radiators closely packed in an approximately azimuthally symmetric configuration.
The BBC are used to count the charged particle multiplicity in the pseudo-rapidity
range , to provide the start time for
time-of-flight measurement, and to give the collision vertex position along the interaction
diamond with a typical resolution of 0.6 (2) cm in Au+Au (p+p) collisions nim_bbc .
In d+Au collisions, the centrality of the collision is determined by measuring the
charge deposited in the BBC in the beam direction ppg036 ; whereas
in Au+Au reactions, the correlation between the BBC charge sum and the ZDC total
energy is used for centrality determination ppg001 (see next Section).
The ZDC are small hadronic calorimeters that measure the energy carried by spectator
neutrons at very forward angles. They are placed 18 m up- and downstream of the
interaction point along the beam line ( 2 mrad). Each ZDC consists of
three modules with a depth of 2 hadronic interaction lengths read out by a
single photo-multiplier tube (PMT). Both time and amplitude are digitized for each
PMT along with the analog sum of the three PMT signals for each ZDC.
III DATA ANALYSIS
In this section, we describe the event selection criteria, the reaction centrality determination in d+Au and Au+Au collisions, the identification and reconstruction procedures in the and channels and the various corrections (geometrical acceptance, reconstruction efficiency, trigger, absolute cross-section normalization) applied to the raw data. The systematic uncertainties of the measurements are discussed at the end of the section.
III.1 Event Selection
The data presented in this paper were collected under two general trigger conditions. The first sample, consisting of minimum-bias (MB) events with vertex position along the beam axis 30 cm, was conditioned on a local-level-1 (LVL1) trigger generated by coincidences between the two BBC (in the case of p+p and d+Au) or by coincidences between the BBC and ZDC detectors (in the case of Au+Au). The MB trigger cross sections measured by the BBC in p+p and d+Au collisions are respectively 23.0 mb 9.7% mb and 1.99 b 5.2% dau_totalxsec , whereas the Run-2 Au+Au minimum bias trigger has some inefficiency for the most peripheral interactions and records only % of ppg014 . In other words, the LVL1 triggers accept respectively (555)%, (884)%, and (923)% of the total inelastic cross sections: = 42 3 mb, = 2260 100 mb, and = 6850 540 mb. A second “photon-triggered” sample, requiring electromagnetic showers above a given threshold in the EMCal (with or without the MB BBC requirement), has been used to extend the measurements to higher . The details of this level-2 (LVL2) software trigger are described in ppg054 . The total number of events collected in the MB and photon-triggered samples (after vertex cuts) as well as the integrated luminosities for each collision system are listed in Table 1.
III.2 Centrality Determination (d+Au, Au+Au)
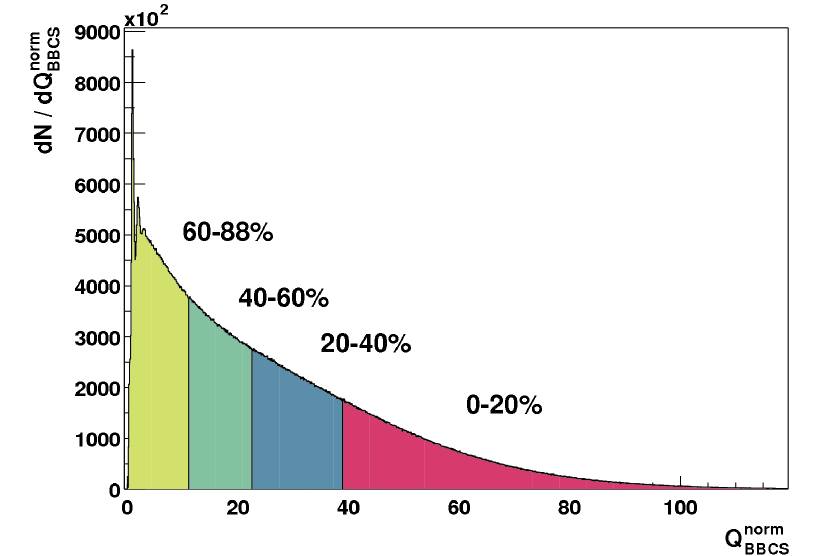
The events in d+Au collisions are classified into four different centrality classes given in percentiles of the total cross-section: 0–20%, 20–40%, 40–60% and 60–88%, with the latter being the most peripheral. The reaction centrality is related to the number of hits in the south Beam-Beam Counter (BBCS), which is proportional to the number of participant nucleons in the gold nucleus ppg036 . The distribution of the normalized charge in the BBCS and the classification into different centrality classes is shown in Fig. 2. In order to obtain reasonably large statistics in each Au+Au centrality class, three centralities are used in the current Au+Au analysis: 0–20% (central), 20–60% (semicentral) and 60–92% (peripheral), determined by cuts in the correlated distribution of the charge detected in the BBC and the energy measured in the ZDC ppg001 . A Glauber Monte Carlo model combined with a simulation of the BBC (plus ZDC) response allows determination of the mean value of the associated nuclear overlap function () for each d+Au (Au+Au) centrality bin. Table 2 lists the mean value of the nuclear overlap function for different centralities in both systems.
| centrality bin | (mb-1) | (mb-1) |
|---|---|---|
| min bias | 0.20 0.01 | 6.14 0.45 |
| 0-20% | 0.36 0.02 | 18.5 1.3 |
| 20-40% | 0.25 0.017 | - |
| 20-60% | - | 4.6 0.4 |
| 40-60% | 0.17 0.014 | - |
| 60-88% | 0.073 0.007 | - |
| 60-92% | - | 0.3 0.1 |
III.3 Reconstruction
The main mode of -meson reconstruction in PHENIX is via the electromagnetic channel . PHENIX has published the results of a number of measurements in the EMCal for different colliding systems ppg003 ; ppg014 ; ppg024 ; phnx_spin_pi0 ; ppg028 ; ppg044 ; ppg054 ; ppg051 . The technique for identifying the photons and reconstructing the yields as a function of and centrality is now well established and is exactly the same one used here to obtain the corresponding yields. Although the reconstruction methods are identical, the p+p and d+Au analyses do not suffer from the large particle multiplicity background that the Au+Au reconstruction faces, and there are a few differences between Au+Au and the other studies. In the Au+Au case, the applied analysis cuts (photon identification, invariant mass reconstruction, and other cuts) are tighter than in the p+p and d+Au cases. Additionally, in order to deal with cluster overlap effects appropriately, the Au+Au analysis uses a full GEANT geant Monte Carlo (MC) simulation, in which the simulated single are embedded into real events, rather than using a tuned fast MC simulation without embedding. These differences are explained in separate subsections below.
III.3.1 Photon reconstruction in EMCal
Electromagnetic clusters are reconstructed in the EMCal sectors by finding
contiguous calorimeter towers with pulse heights above the ADC pedestal value.
The energy of each EMCal cluster is corrected for angular dependence
and non-linearity based on test-beam results and simulation. The
linearity correction for the two detector types is different, with the
PbGl having a stronger dependence on the energy. The correction
factors for a photon with a detected energy of 1 GeV (10 GeV) are 1.00
(0.95) for the PbSc and 1.05 (0.975) for the PbGl, respectively. The
PbGl calorimeter also shows a stronger variation of the measured
photon energy with the angle of incidence on the detector surface:
at the measured energy is reduced by 5% compared to
perpendicular incidence (), while in the PbSc this reduction is
only of the order of 2%.
Since we are interested in high- production, only EMCal
clusters with energy above 1 GeV are selected for further analysis.
In addition, fiducial cuts excluding the edges of each EMCal sector
as well as an area of towers
around the towers that have been determined to be hot or dead,
were applied in order to exclude clusters with incorrectly reconstructed
energies.
Among the clusters passing the cuts, photon candidates are identified
by applying standard particle identification (PID) cuts based on
time-of-flight (TOF) and shower profile. Both cuts are applied to
reject slower and broader showers which are mostly of hadronic origin.
For the PbSc we require the measured cluster TOF to be ns where is the straight-line path from the
collision vertex to the reconstructed cluster centroid. For the
PbGl we require reconstructed clusters to have times, ns; the difference is due to the difference in
intrinsic timing resolution of the two calorimeter technologies.
Shower profile cuts are based on rejecting those clusters whose energy
deposition among the modules, and in particular in the most central
tower of the cluster, are not consistent, within a given -test
limit, with the shower shape expected for electromagnetic showers
as parametrized from test-beam data nim_emcal .
In the most central Au+Au events, the EMCal typically detects 300 clusters, corresponding to a detector occupancy of 10% in terms of hit towers, resulting in a non-negligible probability of particles making clusters which overlap. In order to minimize the effects of cluster overlaps due to high multiplicity, two methods are used to determine the cluster energy. First the energy of each cluster in the PbSc calorimeter is determined from the sum of all contiguous towers with deposited energy above a given threshold ( = 15 MeV, typically). Alternatively, an extrapolation (using a standard electromagnetic shower profile for an event with zero background) from the measured core energy (ecore) in the four central towers to the full cluster energy is used. For the latter case, the ecore energy was computed from the experimentally measured center of gravity, central shower energy, and impact angle in the calorimeter using a parametrized shower profile function obtained from electromagnetic showers measured in the beam tests. Such an ecore energy represents an estimate of the true energy of a photon impinging on the PbSc unbiased by background contributions from other particles produced in the same event and depositing energy in the neighborhood of a given cluster. The use of ecore instead of the total cluster energy for photon reconstruction helped considerably to minimize the effects of cluster overlaps in central Au+Au collisions.
III.3.2 Raw yield extraction (p+p and d+Au)
The yields are obtained by an invariant mass analysis of photon
candidate pairs having asymmetries
0.7.
The cut on the asymmetry reduces the background since high- combinatorial
pairs are strongly peaked near due to the steeply falling spectrum
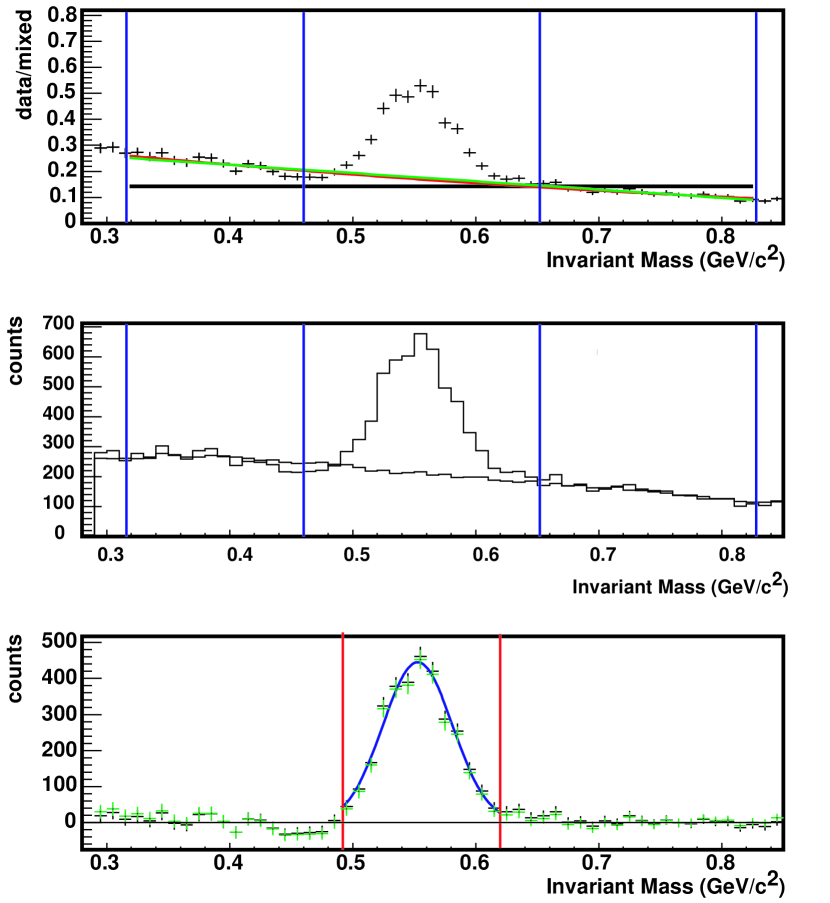
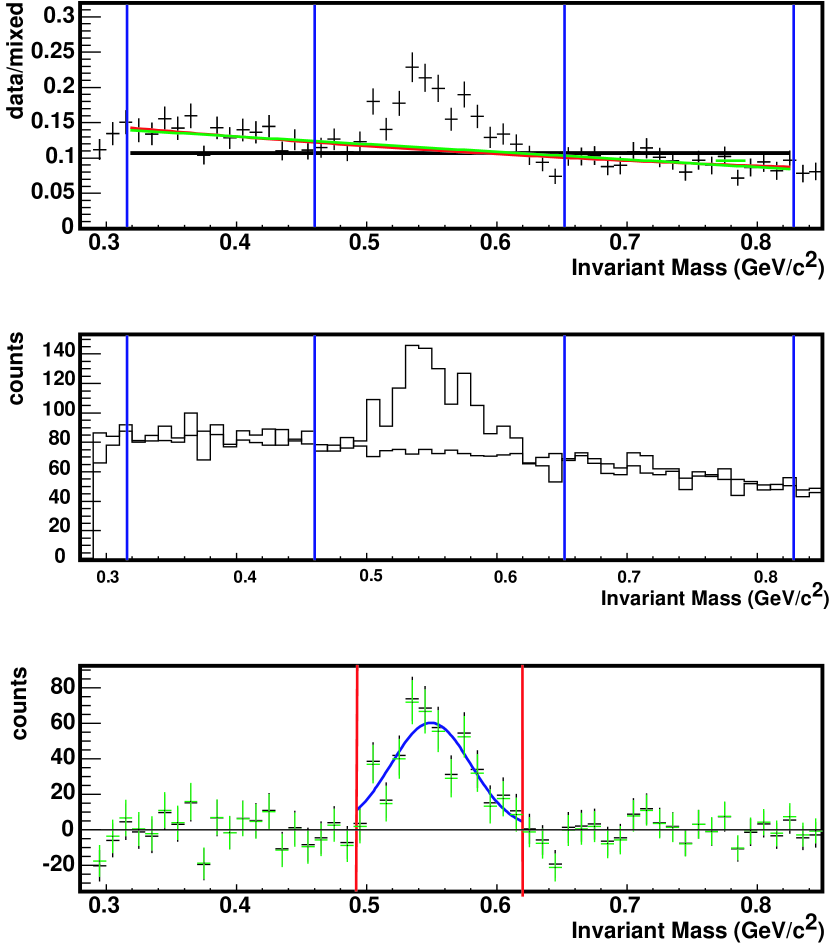
of single photon candidates. The resulting invariant mass spectra obtained
for proton-proton and deuteron-gold collisions are shown in Figs. 3
and 4 respectively for two typical bins.
A peak is seen at about MeV/, the expected mass of the meson.
The measured peak position is modified by detector effects which lead to energy
smearing. The combined effects of the energy resolution of the detector, the steeply falling single photon
spectrum, and the finite size of the energy bins lead to a
smearing of the measured photon energies which widens the signal.
As a result the average peak position in the invariant mass spectra is about
9 MeV/ larger than the nominal mass of the meson, an effect which
is well reproduced by the simulation.
The combinatorial background below the peak signal is estimated with the
event mixing method in which clusters from different events with similar event vertex
(and centrality class in d+Au) are combined to produce a “background” invariant
mass distribution. This background is normalized to the real invariant mass spectrum
and then subtracted from the invariant mass spectrum of the real events.
To estimate the normalization of the background, the distribution of the real events is
first divided by the mixed event distribution. This ratio is shown in the upper
panel of Figs. 3 and 4. The normalization function
is estimated by a fit in the region outside the peak. The spectrum, fitted to a
second-degree polynomial, is shown in the region denoted by the vertical lines
in the upper and the middle panels of Figs. 3
and 4. The final real event mass distribution after the
background subtraction is shown in the lower panel of
Figs. 3 and 4.
The interval over which the background is adjusted is limited by two considerations: the expected peak position and width . Both were estimated in a first analysis of the spectra and set to and . The background interval includes the region between and ( and ) excluding the peak region (). For higher transverse momenta, the background almost vanishes and thus the estimation of the normalization by a fit leads to large errors. Hence an alternative method is used where the fit function is replaced by the ratio of the number of photon pairs in the normalization region in the real and the mixed event distributions.
Finally, the total number of in a given bin is obtained
by integration of the invariant mass distribution within 3
around the peak position.
The statistical error of the peak extraction is estimated as done for
the and described in ppg054 . The uncertainty of the background
parametrization is estimated by calculating the error on the ratio of the
integrals of the real and the mixed event distributions in the region of
the background fit. Above = 10 GeV/ in p+p collisions, the mixed
event background does not work as expected as there are some entries in
the mixed event background but not in the region. For these cases,
the background was estimated by integrating the real event distribution
outside the peak (in the fit region mentioned above) and scaling this
to the integration region. This background is then subtracted
from the real event distribution to get the number of .
The error in this case is estimated with ,
being the signal and being the background.
The integral of the invariant mass distribution after the background
subtraction is calculated in a reduced interval
( MeV/ – MeV/).
III.3.3 Raw yield extraction (Au+Au)
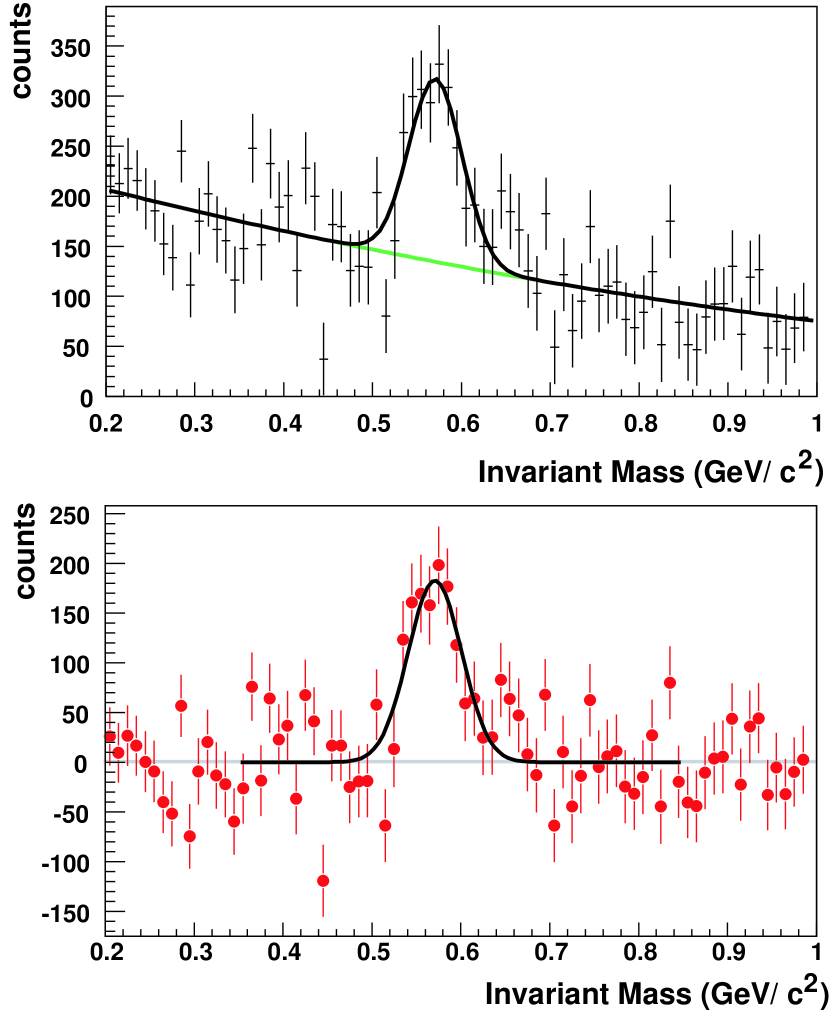
The yields for Au+Au are determined by calculating the invariant mass of photon pairs with asymmetries 0.5, a value tighter than that used for the p+p and d+Au cases in order to reduce the larger uncorrelated background in Au+Au collisions, and binned in . The yield in each bin is determined by integrating the background-subtracted invariant mass distribution around the peak. The combinatorial background is obtained by combining uncorrelated photon pairs from different events with similar centrality and vertex, and normalizing the distribution in a region below ( = 400 – 450 MeV/) and above ( = 750 – 1000 MeV/) the mass peak (Fig. 5 top). After the mixed background subtraction, the resulting distribution is fitted to a Gaussian plus an exponential (or linear, see below) function to account for the residual background – more important at low – not completely removed by the event-mixing technique. The bottom plot in Fig. 5 depicts the signal after mixed (and residual) background subtraction. To estimate the uncertainty in the subtraction of the residual background, different pair asymmetries and an alternative linear parametrization were used (see Section III.6). The signal-to-background (S/B) ratio in peripheral (central) Au+Au collisions is approximately 1.3 (1.5) and 0.05 (0.002) for the highest and lowest , respectively. The signal-to-background ratio is comparable for central and peripheral collisions at the highest because the spectrum in the central data extends to higher than that in the peripheral.
The scaled mixed-event distribution is subtracted from the real-event distribution to produce a statistical measure of the true yield. The result of such a subtraction procedure is shown in the bottom plot of Fig. 5. The raw yield is obtained by integrating the subtracted invariant mass distribution in a range determined by the mean and the width of the peak and given by . Th analysis described above is applied in bins of GeV/ for = 2 – 4 GeV/ and GeV/ above. We cease attempting to extract yields at high when the number of pairs within the selected (background-subtracted) mass window falls below 4 counts.
III.3.4 Acceptance correction
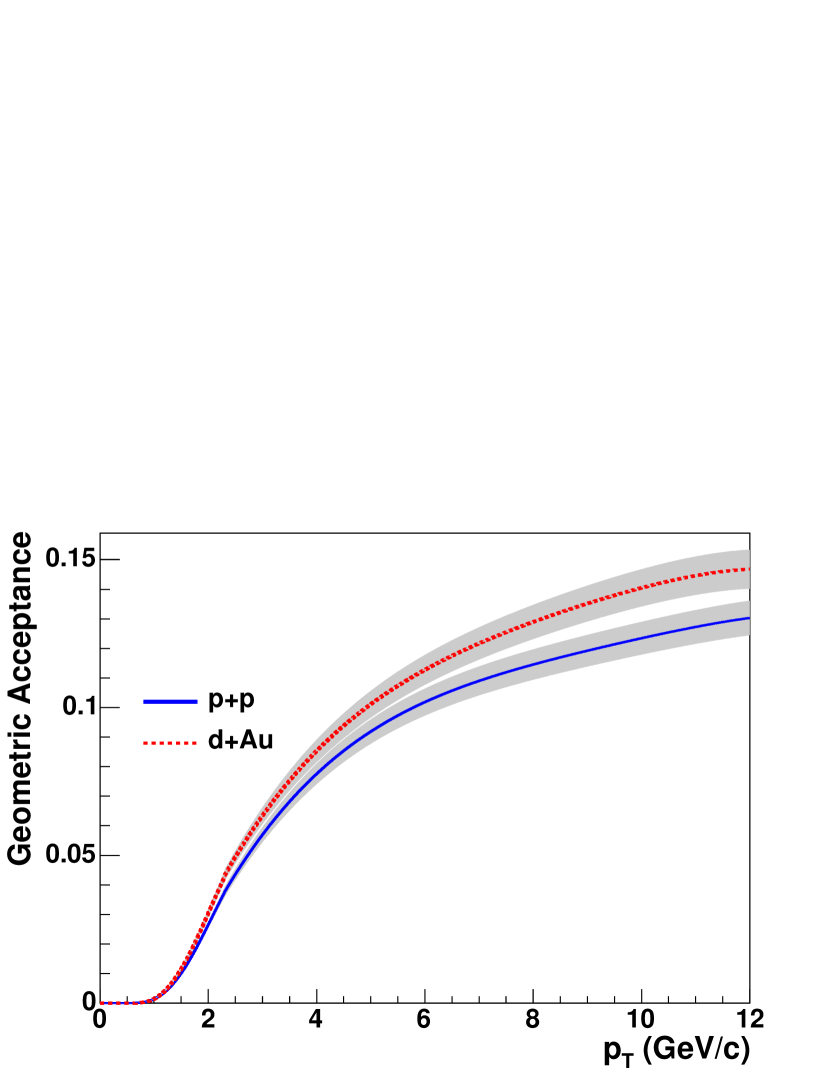
The geometric acceptance is evaluated using a fast Monte-Carlo (fastMC) program based on routines from the JETSET library Sjo94 to simulate the decays and determine the geometric acceptance of the calorimeter for the decaying photons. The acceptance correction accounts for the fraction of produced mesons whose decay photons will not actually hit the detector due to the finite solid angle covered by the detector. A decay photon will be accepted by the EMCal in the fastMC when it hits the active surface of the detector covering the pseudorapidity range (computed using a realistic distribution of event vertices within 30 cm) and 290∘ in azimuth. The acceptance shows a strong dependence on the transverse momentum because the opening angle of the decay photons decreases with increasing . Thus, the probability that both decay photons hit the detector decreases for small values of . The acceptance for p+p and d+Au collisions is shown in Fig. 6. The acceptance is influenced by the geometry of the whole detector as well as by dead and hot modules in the p+p and d+Au cases (for Au+Au the efficiency losses due to dead and hot modules are computed from the full GEANT3 simulation plus “embedding” and are accounted for in the efficiency loss correction). Due to a different number of masked out modules, the acceptance is not exactly the same in p+p and d+Au collisions.
III.3.5 Efficiency corrections of the raw yields (p+p, d+Au)
Reconstruction efficiency correction
The reconstruction efficiency takes into account that the measured spectrum in the detector is different from the real physical spectrum, i.e. the reconstruction efficiency is defined as the ratio between the output and the input spectra:
| (1) |
as obtained using the fastMC, which parametrizes all the detector effects on the input spectrum (EMCal energy and position resolution, efficiency losses due to identification cuts and reconstruction procedure, etc.). A realistic input spectrum is used as an initial spectrum for the efficiency calculation and an iterative procedure is performed, in which the corrected output spectrum is used as the input spectrum of the next iteration. To simulate detector effects, the smeared energies and hit positions of the decay photons are parametrized in the fastMC. The energy smearing has a constant and an energy-dependent term and follows the functional form
| (2) |
The parameters for Eq. (2) are given in Table 3 for the different collision systems and the two EMCal detector types. The initial values have been taken from the detector response obtained in the beam tests nim_emcal and re-tuned for real run conditions in previous analyses ppg024 ; phnx_spin_pi0 . During the cross-checks between simulated and real data it was found that the energy scale of the EMCal was slightly shifted compared to the parametrized results. Since the energy scale is estimated experimentally by fitting the location of the peak, and the position of the peak is also affected by reconstructed secondary neutral pions from decays which themselves decay off vertex, an additional correction is applied in the fastMC shifting the energy scale by 0.7%. After this correction, the position and the width of the simulated peaks are confirmed to be consistent with the position and the width measured in the data for all bins.
| collision | detector | energy-dependent | constant |
|---|---|---|---|
| system | type | term (A) | term (B) |
| p+p | PbGl | 0.085 | 0.059 |
| p+p | PbSc | 0.082 | 0.050 |
| d+Au | PbGl | 0.085 | 0.059 |
| d+Au | PbSc | 0.082 | 0.050 |
The efficiency correction also takes into account the different cuts
used for particle identification. The simulation must consider the
loss of photons and thus of due to the applied shower shape (or “dispersion”)
and energy threshold cuts. The effect of the dispersion cut is estimated by a
comparison of uncorrected spectra without a PID cut with the spectra obtained
with the different PID cuts. The spectra are obtained with a sharp asymmetry ()
cut and as a function of . The resulting loss of is translated
into a photon loss probability, which is then used in the simulation. The energy
cut is reproduced by rejecting photon hits according to an energy-dependent survival
probability in the simulation. Finally, the simulation reconstructs the
invariant mass and the transverse momentum of the from the reconstructed
(smeared) information. Only particles inside the interval used for the integration
of the real peak are accepted. The overall efficiency losses
obtained by this method are of the order of =
76% 3% (dominated by the asymmetry cut and the invariant mass yield
extraction procedure) and are flat within 1-2% in the whole range measured
for both (p+p and d+Au) colliding systems.
Photon conversion correction
Some of the produced are not reconstructed due to conversions of
one or both decay photons in the inner regions of the PHENIX detector.
Such an effect is not included in the fastMC and is computed independently
using a full simulation of the detector including a realistic
description of the material in front of the EMCal.
The correction factors obtained from this analysis are for PbSc
West, for PbSc East and for PbGl,
as the material between the collision vertex and the EMCal is different in
the east and the west arm and between PbGl and PbSc.
III.3.6 Efficiency corrections of the raw yields (Au+Au)
In the Au+Au case, the detection efficiency is determined using a full
PISA (PHENIX Integrated Simulation Application) GEANT3-based
Monte Carlo (MC) program of the PHENIX detector in order to simulate the
complete response of the calorimeter to single decays.
The nominal energy resolution was adjusted in the simulation by adding an
additional -independent energy smearing of for each PbSc tower.
The shape, position, and width of the peak measured for all and
centralities were thus well reproduced by the simulated data.
The data from each simulated is embedded into real Au+Au events
and the efficiency for detecting the embedded is evaluated analyzing
the merged events with the same analysis cuts used to obtain the real
yields. Using this technique we determine efficiency corrections that account
not only for the energy resolution and position resolution of the calorimeter,
but also for the losses due to overlapping clusters in a real Au+Au
event environment. The embedding also permits a precise determination
of the effect of edge cuts and bad modules. Though these effects can
in principle be considered as geometric acceptance corrections (as done in the
p+p and d+Au analyses), they depend not only on the geometry but also on the
energy deposition of an electromagnetic shower in the different calorimeter towers.
Lastly, in the full-simulation plus embedding procedure we additionally
have control over the effects of photon conversions, as the GEANT simulation
considers the material in front of the EMCal and the information
whether a decay-photon converts is kept for evaluation in the efficiency
determination.
The input spectrum embedded in real events is weighted to match a functional form fit to the measured spectrum so that the correct folding of the spectrum with the resolution is obtained. This procedure is iterated, with the fit of the dependence of the input weights adjusted as the estimate of the efficiency correction improves, until the procedure converges within the nearly -independent statistical error of the embedded sample, approximately 3%. The final overall yield reconstruction efficiency correction factor was 3 with a centrality dependence of 20%. The losses were dominated by fiducial and asymmetry cuts.
III.4 Reconstruction
III.4.1 Raw yield extraction
The second mode of -meson reconstruction in PHENIX is via the
three-body decay channel with
branching ratio BR = 22.6% 0.4%. This mode has been used for
the p+p and d+Au data, but not for the Au+Au where the large detector
occupancy makes the signal very difficult to extract. Reconstruction
starts with identifying the candidates among the pairs of
EMCal -clusters with energy 0.2 GeV in the same
way described in the previous section for the direct
channel. The mass of a candidate is required
to be within two standard deviations from the peak position of .
The peak position and its width are determined by the decay
kinematics and EMCal resolution for each of the clusters and its
position. These parameters were found to be consistent with the
expected values. Selected candidates with transverse
momentum 1.0 GeV/ are assigned the exact mass of the meson
and measured of the pair. These candidates are further combined
into triplets with positive and negative particle tracks measured by
DC and PC1 to have momentum in the range 0.2 GeV/ 4.0
GeV/. No particle identification was used
on the charged tracks.
In order to extract the raw yields the mixed-event subtraction
technique was not used in this case because it does not adequately
reproduce the shape of the background in the real events. The most
important physical reason for this is that there are a significant
number of correlated tracks among the pairs coming from
various heavier particle decays. The yield extraction was done by
simultaneous fitting of the peak and the background in the adjacent
region. The characteristic peak in the three-particle mass
distribution is shown in the top panel of
Fig. 7. The position of the peak is consistent
with the nominal mass of the -meson within the statistical
error of the fit shown in the figure. The measured 8 MeV/ width
of the peak is narrower than in the decay
channel. Unlike the channel where the full width of the peak
is defined by the EMCal resolution alone, in
only 1/4 of the measured mass is derived from an EMCal-based measurement. Given the relatively low of the
decay products, tracking has better resolution than the
calorimeter. These two effects result in higher accuracy of the mass
measurement and smaller width of the peak compared to
the analyses.
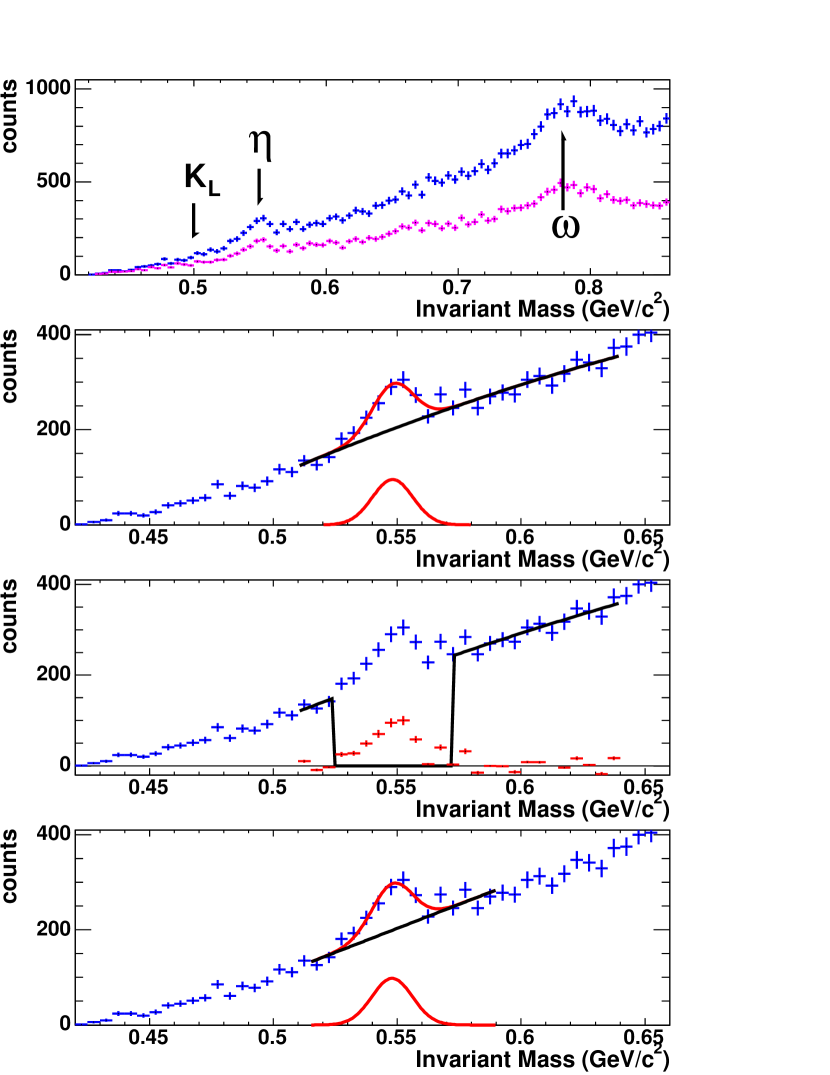
The raw yield numbers were extracted by simultaneously fitting the
signal with a Gaussian function and the background to a quadratic function.
The fit was limited to the mass window of 510 MeV/ 640 MeV/. The lower limit is chosen to avoid the
region where the decay (branching
ratio BR = 13%) yields an additional signal at and above
= 498 MeV/. The upper limit is chosen at a safe distance
from the (BR = 89.1%) peak at
782 MeV/ with a width of 20-25 MeV/.
An example of the fit is shown in the second panel in Fig. 7.
We also compared the result of such a combined signal+background fit
with separate fitting of the background. For that, the region under the peak,
530 MeV/ 570 MeV/, was rejected from the fit and
the background was approximated by the quadratic function. The function was
interpolated and subtracted from the histogram in Fig. 7
(third panel). The histogram counts in the region initially rejected were summed
up to calculate the yield.
In addition, simultaneous fitting was done in the restricted window below 580 MeV/, with the background approximated by a linear function. The same three fits were repeated applying an additional condition in the analysis. Each charged track was required to match a hit in PC3 or in the EMCal in case a track missed the active area of PC3. The resultant invariant mass spectrum is shown by the lower curve in the top panel of Fig. 7. The amplitude of the signal is reduced by about a factor of two because many tracks fall outside the acceptance of these two detectors, but the background is also reduced and, more importantly, modified in its shape. The overall significance of the results with and without matching is approximately the same. Signal loss due to matching can be corrected with the simulation with small systematic uncertainty and the results can be compared to deduce the accuracy of the yield extraction procedure. Thus, for each point we obtain six statistically correlated measurements of the raw yields. The first measurement with its statistical error is used in further analysis and the variance of the six measurements provides the estimate of the systematic errors of the yield extraction.
III.4.2 Acceptance and efficiency corrections of the raw yields
Similar corrections as described for the decay channel need to be applied to the raw yields. However, for the 3-pion analysis, we use the full detector simulation and both corrections, namely the acceptance and the efficiency corrections, are computed at the same time. A MC hadron decay generator was used to produce initial -mesons with a distribution providing satisfactory statistical significance in all bins after acceptance and trigger losses. The full GEANT-based PISA simulation was updated with the three-body decay of the -meson and used to decay -mesons. PISA also performs the full simulation of the PHENIX detector and generates the response of all its subsystems up to the electronics-signal level, which was then processed by standard PHENIX reconstruction software. Special attention was paid to verify that the simulation code represented the real configuration of the detector, and that the peak parameters in the real data and simulation were consistent with each other. The reconstruction of the simulated data was carried out using the same steps and tools as the real data.
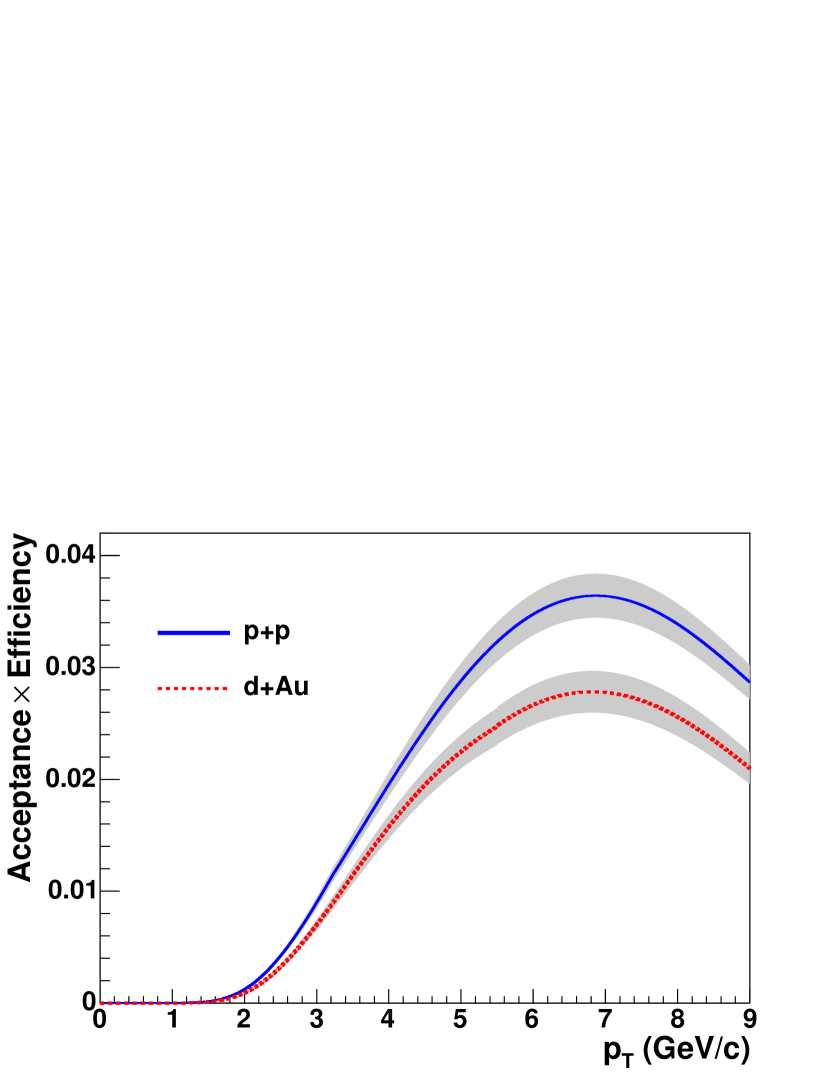
Figure 8 shows the combined efficiencyacceptance as a function of for the three-pion decay analysis. In order to compare this with the decay channel reconstruction efficiency one needs to multiply the acceptance curve shown in Fig. 6 with the obtained = 76% 3% overall efficiency loss. The three-body decay combined acceptance is significantly lower than the acceptance of the decay channel. With comparable branching ratios of the two modes the resulting statistics in the three-body decay mode is expected to be smaller. The decrease of the efficiency at high is due to the momentum cut on the to be below 4.0 GeV/. Above that threshold the track sample is contaminated by products of in-flight decays of long-lived particles with mismeasured momentum.
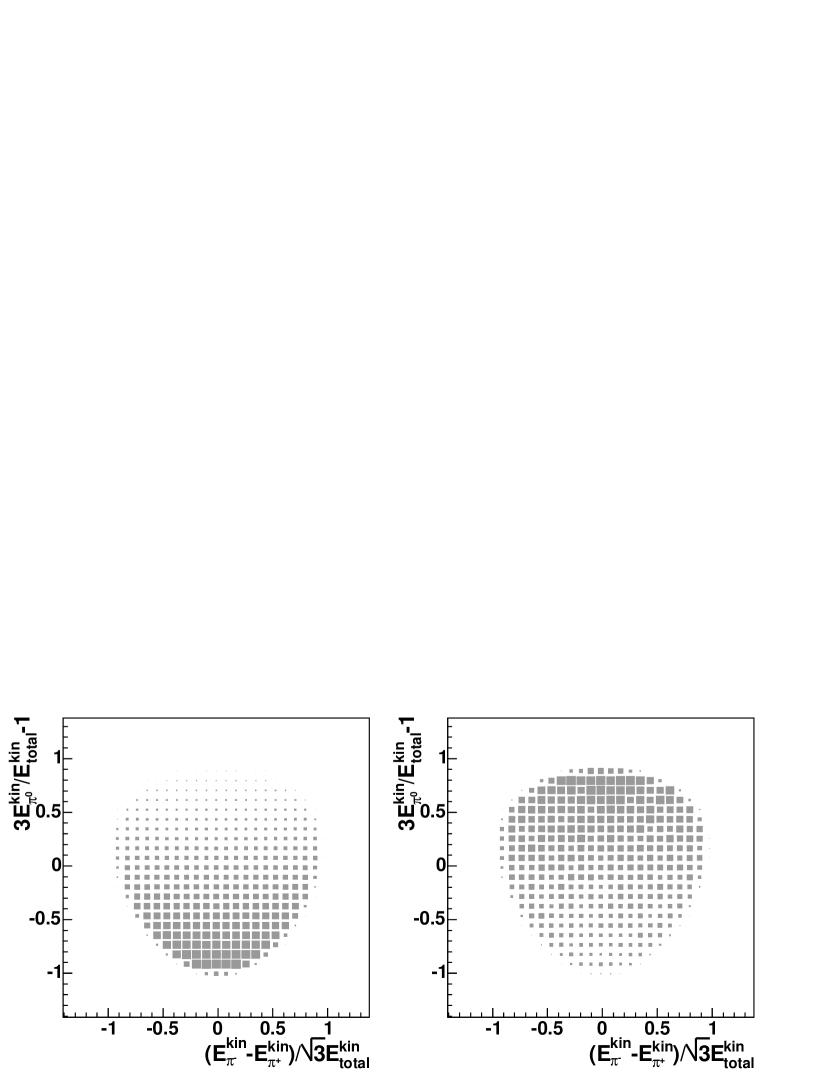
III.4.3 Phase-space density correction
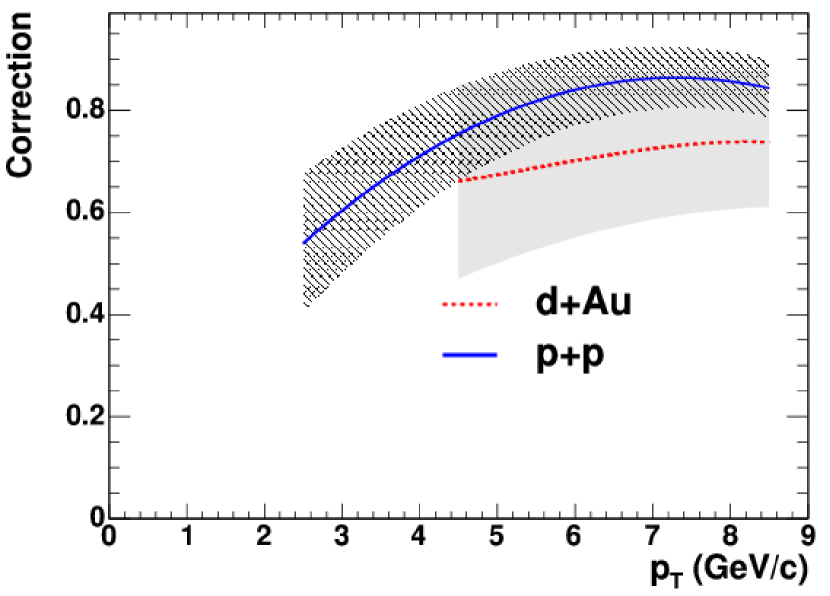
The decay channel required an additional correction to take into account the uneven distribution of the momenta of the three pions within the kinematically allowed region. Such a distribution, taken from eta-phase1 ; eta-phase2 ; eta-phase3 , is shown in the left panel of Fig. 9. The vertical axis is the fraction of kinetic energy carried by the in the -meson rest frame. The horizontal axis shows the difference between kinetic energies of and divided by the total in the same system. The left plot of Fig. 9 shows that on average the -meson carries less kinetic energy, and thus momentum, than the two charged -mesons. The right panel shows the PHENIX reconstruction efficiency including geometrical acceptance, high- trigger efficiency (see next Section), and analysis cuts. The latter two effectively select higher momentum and lower momentum in the lab frame. In the -meson rest frame these translate into the effect opposite of what is shown in the left panel. In order to correct for that we used the following approach. The uniform distribution of the phase-space density produced by the simulated event generator was weighted according to the known probabilities of the -meson momenta to be observed in the -meson decay. The corresponding correction was deduced by comparing the reconstruction efficiencies with and without applying weights. The systematic uncertainties associated with the measurement of the phase-space density accuracy were thus obtained. This correction is shown in Fig. 10. The correction factor is calculated in the range where data is available.
III.5 Trigger Corrections and Absolute Cross-Section Normalization
III.5.1 Minimum-bias trigger efficiency
The minimum bias trigger does not detect every collision; only a certain fraction of the inelastic collisions and a fraction of the mesons can be observed. The spectra have to be corrected for both of these effects. The correction factors , determined in ppg036 for d+Au collisions, are shown in Table 4. In the case of p+p collisions, as well as in
| collision system | correction factor |
|---|---|
| d+Au 0-20% central | 0.95 |
| d+Au 20-40% semicentral | 0.99 |
| d+Au 40-60% semiperipheral | 1.03 |
| d+Au 60-88% peripheral | 1.04 |
MB d+Au
collisions, one can directly determine the inelastic cross
section. Therefore, one does not apply the correction factors mentioned
above but rather multiplies the spectra by the total cross section observed
by the BBC, found to be 23.0 mb 9.7% in Run-3 p+p
collisions and 1.99 b 0.10 b in Run-3 d+Au
collisions ppg038 . An additional correction has to be applied for
the bias of the BBC to high- . It is found to be 0.79 for
p+p ppg044 and 0.94 for d+Au ppg038 collisions.
III.5.2 High- Gamma-trigger efficiency
The efficiency of the high- trigger has to be studied as well
to get spectra for the Gamma-triggered data at high
transverse momenta, as previously performed for PHENIX
analyses ppg024 ; ppg054 . The Gamma triggers in
PHENIX are implemented by adding together amplitudes in
adjacent EMCal towers during data taking and comparing them to a
pre-set threshold. In the case of p+p the threshold was set to
correspond to = 1.5 GeV while for d+Au it was set at
= 3.5 GeV. In the case of Au+Au, triggering was performed
by a LVL2 software algorithm run over the MB-triggered events
during data taking, such that the number of rejected
minimum bias events were recorded. This allowed two different threshold
triggers to be employed based on event centrality in Au+Au:
= 1.5 GeV for the 60-92% peripheral sample and = 3.5 GeV
for the more central event selections.
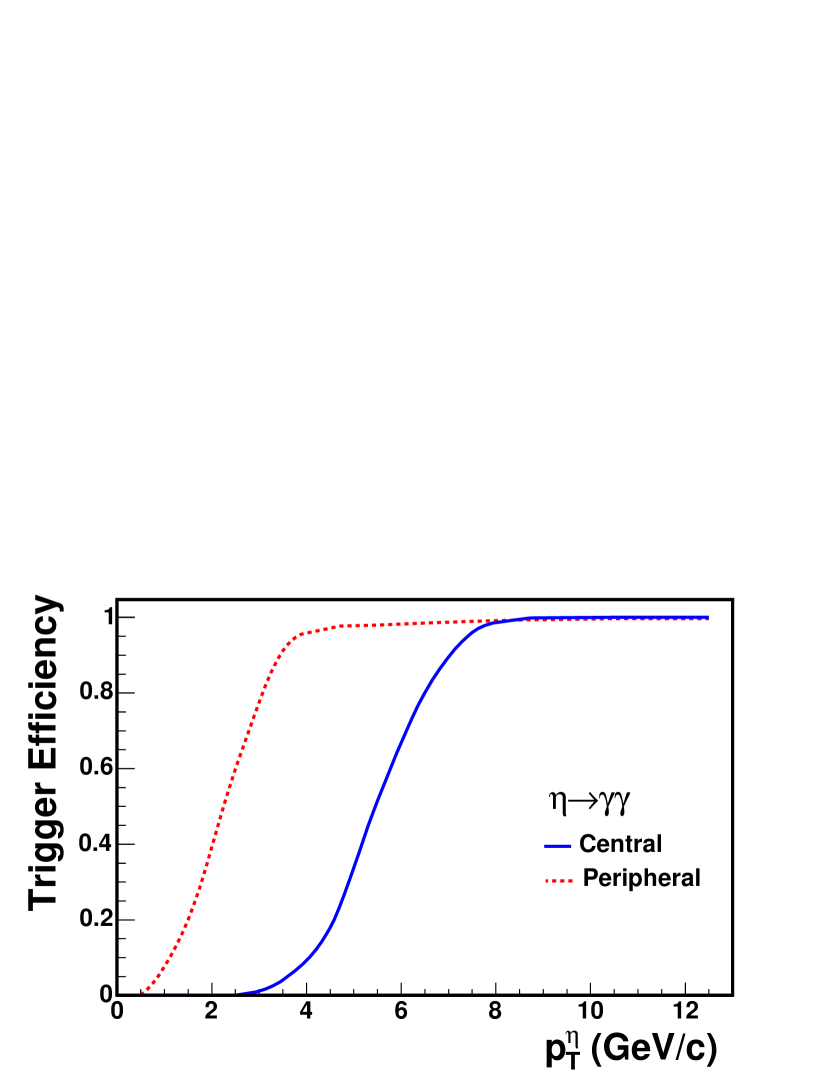
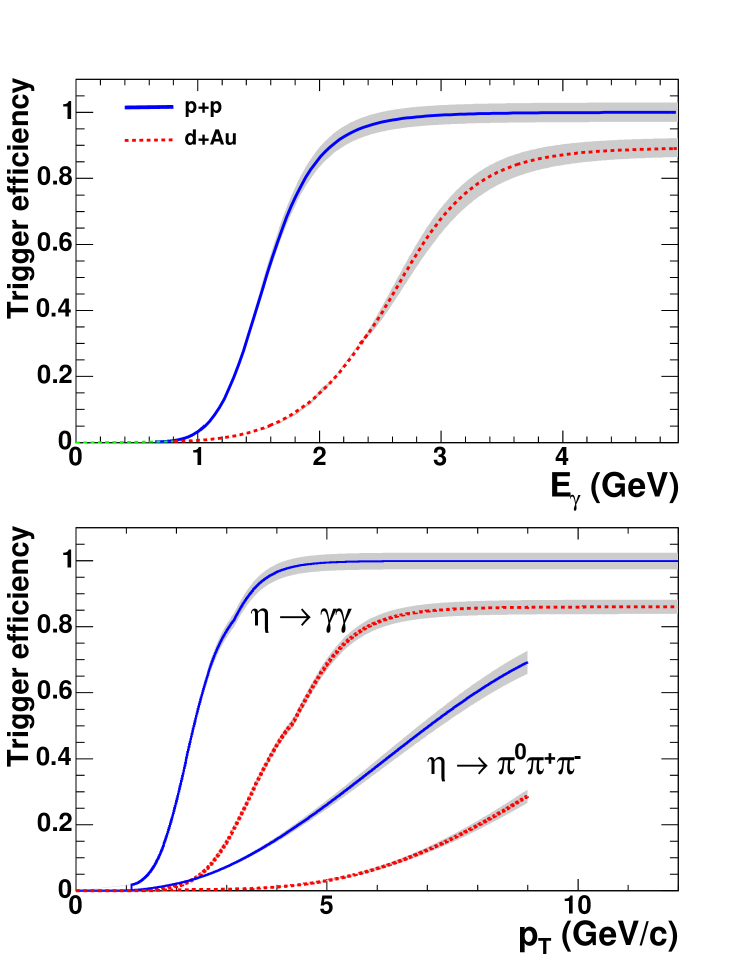
The trigger efficiency curves versus the energy of a single photon
for two different threshold settings used in p+p and d+Au
collisions are shown in the top panel of Fig. 11.
Based upon these curves, the 2- efficiency is calculated as
for the previous analyses ppg024 ; ppg054 using
the fastMC calculation. For this calculation, the single-photon
trigger turn-on curve is represented by an integrated Gaussian for
the d+Au analysis and by the integrated sum of two Gaussians for
the p+p analysis. In the case of the Au+Au LVL2 triggers, the
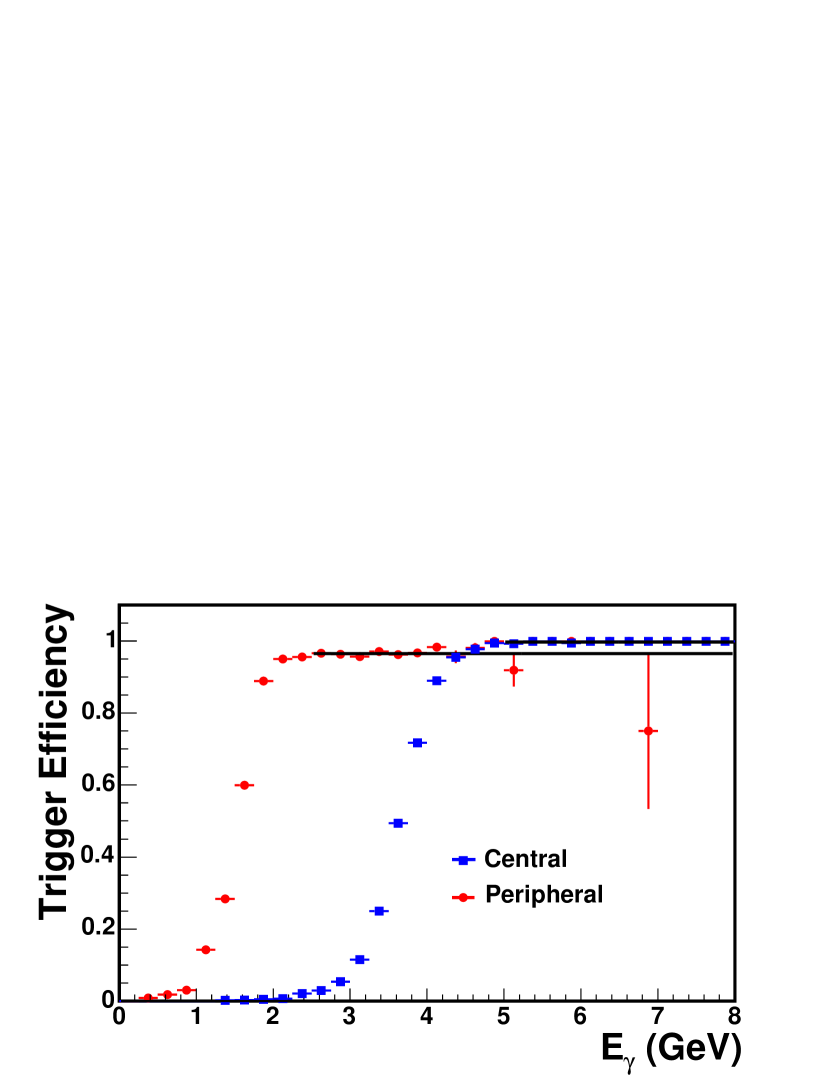
high-statistics measurement of the single-photon efficiency, which
for the central trigger reaches 100% above threshold, is used
itself as shown in the top panel of Fig. 12. The
derived efficiency is checked by comparing the ratio of the
number of in MB events that carry the trigger
flag to the number of in all MB events. In this
way the normalization of the LVL2 data sample relative to the MB
data sample is confirmed to be accurate to .
In the same way we determine the trigger efficiency which is shown in the lower panel of Figs. 11 and 12. In the decay channel where the statistics is very limited, we use the measured single-photon trigger efficiency curves shown in the top panel and full detector MC to determine the efficiency of the trigger. The derived curves for p+p and d+Au are also shown in the lower panel of Fig. 11. One can see that the trigger efficiency plateaus at a of the about twice the energy of the threshold in the case of the decay channel, but in the three-body decay mode where the trigger can only be fired by one of the from , it requires the of the to be approximately 4 times the threshold. In central Au+Au the efficiency reaches 50% (100%) for above , as shown in Fig. 12, bottom panel. The LVL2 data were used only for regions where the trigger had better than 50% efficiency: 5 GeV/c for the central trigger and 2 GeV/c for peripheral.
III.5.3 Cross-section normalization
The invariant cross-sections for production as a function of in MB p+p and d+Au collisions are obtained from the measured number of counts in each bin via
| (3) |
where , , and are the acceptance, reconstruction efficiency, and trigger efficiency, respectively, determined in the previous Section; = 0.3943 0.0026 is the known decay branching ratio of the meson, and is the integrated luminosity obtained using the absolute inelastic cross-section normalization (see Section III.1). The invariant yields as a function of for a given bin in collision centrality in d+Au and Au+Au collisions are obtained via
| (4) |
A final bin-shift correction is needed to take into account the fact that the data points of the spectra are plotted at the center of each given interval (bins whose width is as large as = 2 GeV/), which, due to the exponentially falling spectrum, does not represent the true physical value of the yield in the interval lafferty94 . Usually, either the correction is applied displacing the -values horizontally (i.e. the center of the bin is decreased) keeping their -value, or the -values are moved vertically (i.e. the yields are decreased) keeping the -values at the center of the bin. The second method (yield correction) is preferred here because it facilitates taking bin-to-bin ratios of spectra (with slightly different shapes) from different collisions systems. The net effect of this recipe is a small (few %) shift downwards of the invariant yields in each bin.
III.6 Systematic Uncertainties
III.6.1 analysis (p+p and d+Au)
All systematic errors for the p+p and the d+Au analysis are summarized in Table 7. Hereafter, the errors are categorized by type:
(A) point-to-point error uncorrelated between bins,
(B) correlated, all points move in the same direction but not by the same factor,
(C) an overall normalization error in which all points move by the same factor independent of .
The cross section measurement of the MB trigger has a type-C uncertainty of 9.7% in p+p and 5.2% in d+Au. All other systematic errors are of type B, i.e. they are correlated.
| error source | -indep. | 3 GeV/ | 5 GeV/ | 10 GeV/ | type |
|---|---|---|---|---|---|
| peak extraction | 14.5% (p+p), 9.5% (d+Au) | 6% | 6% | B | |
| geometric acceptance | 4.5% | 4.5% | 4.5% | B | |
| reconstruction efficiency | 1.3% | 2.3% | 3.6% | B | |
| global energy scale | 5.5% | 7.0% | 8.4% | B | |
| energy scale linearity | 1.5% | 0.4% | 4.3% | B | |
| Gamma-trigger efficiency | 9% (p+p), - (d+Au) | 0% (p+p), 2.5% (d+Au) | 0% | B | |
| conversion correction | 2.0% | B | |||
| absolute cross-section normalization | 9.7% (p+p), 5.2% (d+Au) | C |
| error source | percent error | type |
|---|---|---|
| raw yield (peak) extraction (point-to-point) | 0-31% | A |
| raw yield (peak) extraction ( correlated) | 10-20% | B |
| energy scale | 3-8% | B |
| PID cuts | 8% | A |
| geometric acceptance | 4-2% | B |
| trigger efficiency | 5-2% | B |
| reconstruction efficiency | 2% | A |
| error source | indep. | 3 GeV/ | 4 GeV/ | 5 GeV/ | 6 GeV/ | 7 GeV/ | 8 GeV/ | type |
|---|---|---|---|---|---|---|---|---|
| EMCal geometrical acceptance | 4% (4%) | C | ||||||
| DC-PC1 acceptance | 2% (2%) | B | ||||||
| acceptance variation | 0.5% (3%) | B | ||||||
| PC3-EMCal matching | 2% (2%) | B | ||||||
| selection | 3% | 3% | 3% (3%) | 3% (3.5%) | 3% (4%) | 3% (4%) | B | |
| conversion uncertainty | 3% (3%) | C | ||||||
| EMCal energy resolution | 2% | 2.5% | 3% (5%) | 4% (5%) | 5% (5%) | 5% (5%) | B | |
| EMCal energy scale | 3% | 3% | 3% (4%) | 3.5% (4%) | 4% (4%) | 5% (4.5%) | B | |
| Gamma-trigger efficiency | 5% | 5% | 5% (5%) | 5% (5%) | 5% (5%) | 4% (4.5%) | B | |
| Gamma-trigger run-by-run variation | 4% (4%) | B | ||||||
| peak extraction in data (fit) | 10% | 13% | 20% (30%) | 13% (20%) | 23% (20%) | 30% (15%) | A | |
| peak extraction in data (width) | 10% | 10% | 10% (15%) | 10% (15%) | 10% (10%) | 12% (20%) | A | |
| peak extraction in simulation | 3% (5%) | B | ||||||
| branching ratio uncertainty | 1.8% (1.8%) | C | ||||||
| phase space corrections | 20% | 15% | 11% (27%) | 8% (24%) | 7% (20%) | 7% (19%) | B | |
| MB trigger | 9.7% (5.2%) | C | ||||||
| trigger bias | 2.5% (1%) | C | ||||||
| total | 28% | 26% | 29% (45%) | 24% (38%) | 30% (33%) | 36% (35%) |
The error of the raw yield (peak) extraction was estimated, as
described in ppg054 , calculating the error of the ratio of the
integrals of the real and the mixed event distributions in the region of
the background fit. The systematic error in peak extraction differs
from the systematic error estimated for neutral pions in ppg054 because
the background in the region cannot be estimated as well as the
background in the region. This type-B error, estimated
to be 4% higher than for pions, becomes dominant at very low transverse momenta
due to the small S/B ratio.
The error on the acceptance correction includes fiducial cuts on the edges of the
EMCal sector as well as cuts around towers that have been determined to be hot or dead.
The uncertainty in the MC (GEANT) description of the detector geometry is estimated
varying these cuts slightly in the fastMC and in the embedded events
(Au+Au). Those variations are found to result in differences in the yields of less than 5%.
Different combinations of particle ID cuts were used in the analysis
to estimate the uncertainty related to the photon identification.
The differences among the various samples are less than 4% for
all the different PID cuts for p+p as well as for d+Au reactions.
The error in the reconstruction efficiency contains this difference.
The most important source of uncertainty at high is related to the
energy scale. The peak positions and widths observed in the data
are not reproduced to better than 1.5%. An error in the energy scale
of 1.5% leads to an error of 4% in the yield at GeV/ and
of 8% at GeV/.
The error of the high- trigger efficiency in p+p is different
from in d+Au: it amounts to 7.5 at = 3.5 GeV/ and becomes
negligible at = 5 GeV/ (see Section III.5.2).
III.6.2 analysis (Au+Au)
The sources of systematic errors in the Au+Au analysis are listed in Table 7. The main sources of systematic errors in the measurement are the uncertainties in the yield extraction (10–30%), the yield correction (10%), and the energy scale (a maximum of 8%). The energy scale uncertainty is basically the same as discussed before for the p+p and d+Au analyses. The uncertainty on the raw yield extraction was studied by varying the normalization region of the mixed event background and by comparing yields extracted from 2 and 3 integration windows. The yields were found to vary within 10% of the expectation for all centralities. The final results obtained with different PID cut combinations are found to be consistent within 8%, and this was the assigned systematic uncertainty for the photon identification procedure. The final combined systematic errors on the spectra are at the level of 10-15% (type-A, point-to-point) and 10-15% (type-B, -correlated).
III.6.3 analysis (p+p and d+Au)
Systematic errors for the channel are summarized in Table 7. The p+p and d+Au data samples have different systematic errors which are usually larger in d+Au. This is due to the larger high- trigger threshold set during d+Au data taking. The PC3-EMCal matching uncertainty is used to evaluate peak extraction uncertainty. The dominant systematic uncertainties in the p+p (d+Au) measurement are in the yield extraction and the phase-space corrections, with uncertainties of 10-30% (10-30%) and 10% (25%), respectively. The final combined systematic errors on the spectra are at the level of 30% (p+p) and 40% (d+Au).
s
IV RESULTS AND DISCUSSION
In this section, the fully corrected spectra for production differential in in p+p, d+Au and Au+Au are presented, as well as the nuclear modification factors for d+Au and Au+Au collisions. The measured ratio as a function of for the three colliding systems is presented and discussed in comparison with a compilation of world data for hadron-hadron, hadron-nucleus, nucleus-nucleus and collisions and to phenomenological (PYTHIA and “-scaling”) expectations.
IV.1 Transverse Momentum Spectra (p+p, d+Au, Au+Au)
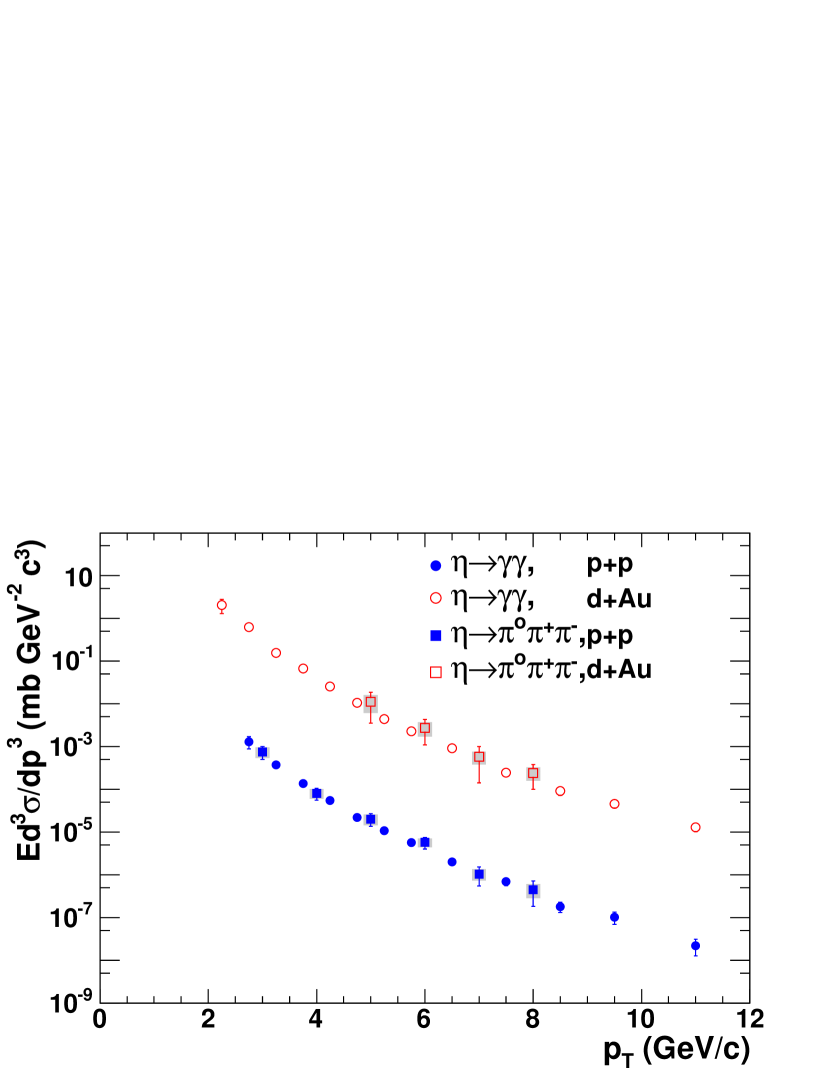
The fully corrected spectra for the meson are shown in Fig. 13 for MB events in proton-proton and deuteron-gold collisions at = 200 GeV. The figure shows the spectra obtained in both the and decay channels. For the result, the error bars represent the total error, given by the quadratic sum of the statistical and the systematic uncertainties. For the pion-triplet spectra, the error bars (bands) represent the statistical (systematic) uncertainties. These results agree well in spite of very different analysis approaches and sources of systematic uncertainties. Due to higher acceptance and lower trigger threshold (see Figs. 6, 8, 11), the channel has superior statistics and therefore these results alone are used henceforth.
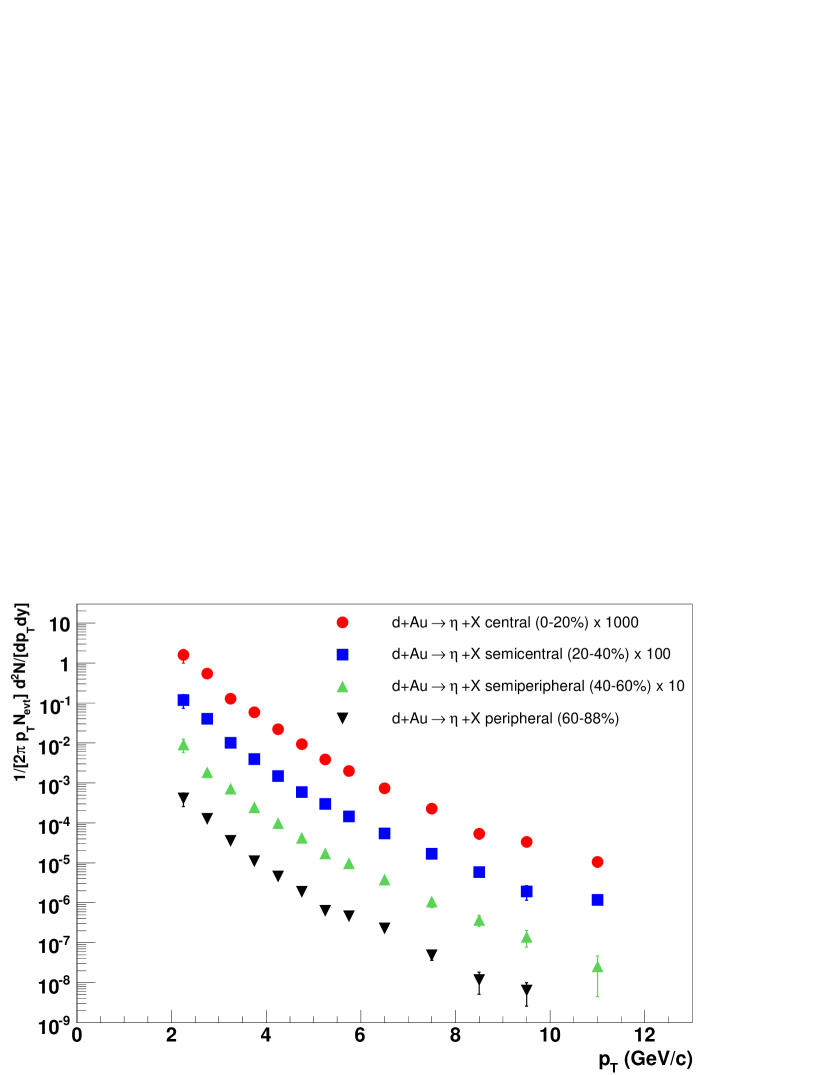
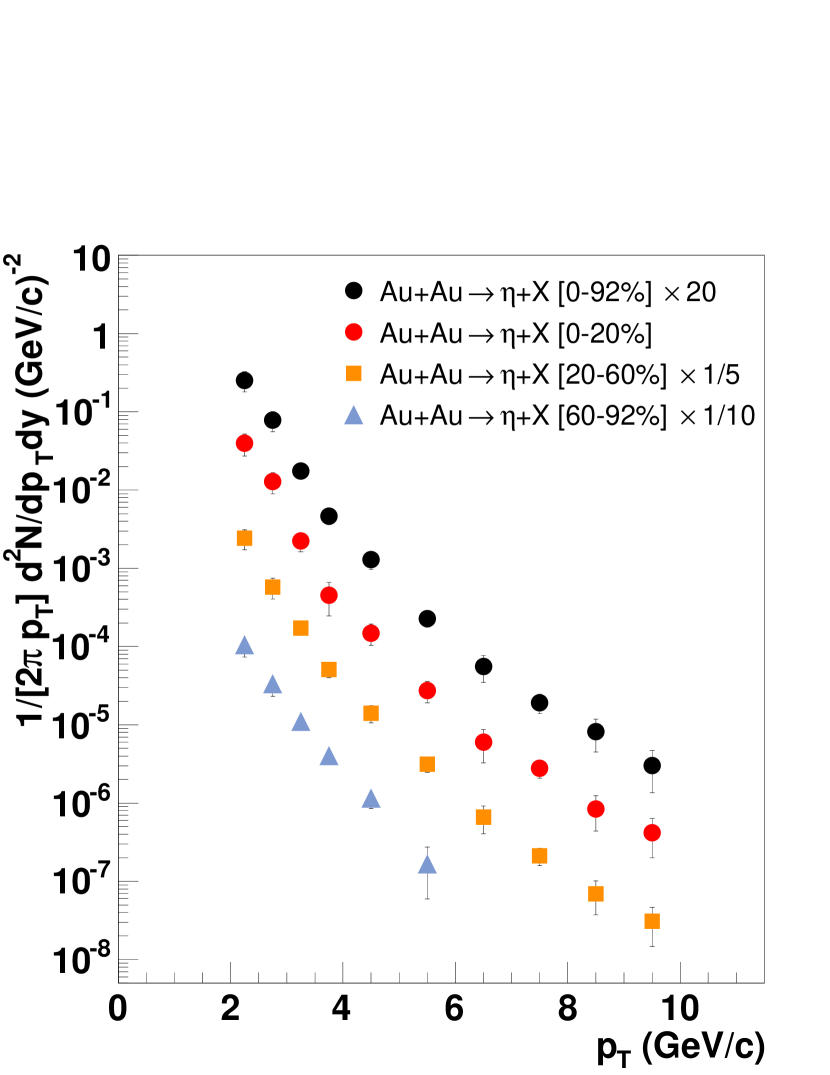
The invariant yields measured in four different centrality classes in d+Au collisions at = 200 GeV are shown in Fig. 14. In Fig. 15 the fully corrected invariant spectra for MB and three different centrality classes in Au+Au collisions at = 200 GeV are shown. The error bars represent the quadratic sum of the statistical and the point-to-point systematic uncertainties.
IV.2 Nuclear Modification Factor in d+Au, )
Medium effects in d+A collisions are quantitatively determined using the nuclear modification factor given as the ratio of the measured d+A invariant yields, , over the measured p+p cross-sections, , scaled by the nuclear thickness function in the centrality bin under consideration:
| (5) |
Deviations from = 1 quantify the degree of departure of the hard d+A yields from an incoherent superposition of collisions. The values of the nuclear thickness function for different centralities are obtained in a Glauber MC calculation and tabulated in Table 2. The resulting for mesons in d+Au collisions is plotted for different centralities in Fig. 16.
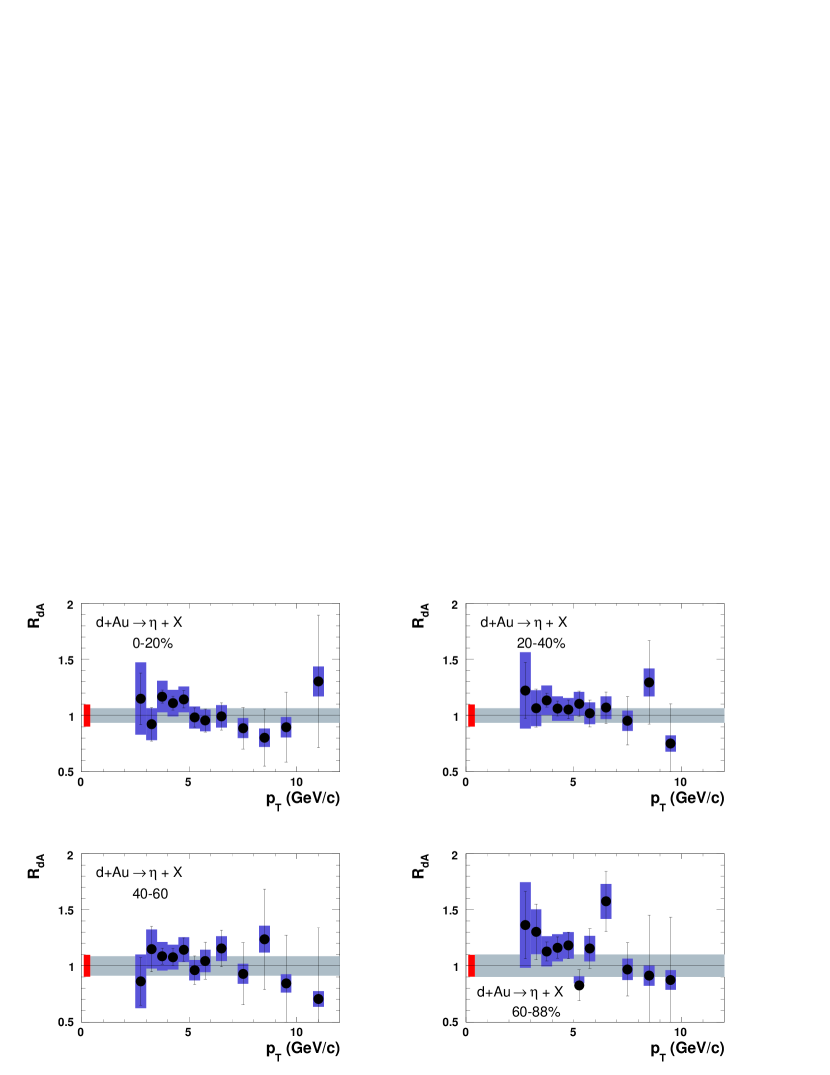
The data points at lower transverse momenta have large statistical errors.
This is caused by the poor signal-to-background ratio of the peak in
the sample that is not triggered with the Gamma trigger.
The systematic uncertainties shown in the plot are computed propagating
the experimental uncertainties in the p+p and d+Au measurements
described in Section III.6. Some of these uncertainties cancel out
when calculating the nuclear modification factor (Eq. 5).
The error due to the reconstruction efficiency as well as the error due
to uncertainties in the energy scale are very similar for the measurement of
mesons in p+p and d+Au collisions as the measured data have been taken
in the same experimental run, and they cancel almost completely in the ratio.
In the case of minimum bias d+Au collisions, the nuclear modification factor, shown in Fig. 17, is more simply defined as the ratio of d+Au over p+p cross sections normalized by the total number of nucleons ( for a d+A collision) with for a gold nucleus:
| (6) |
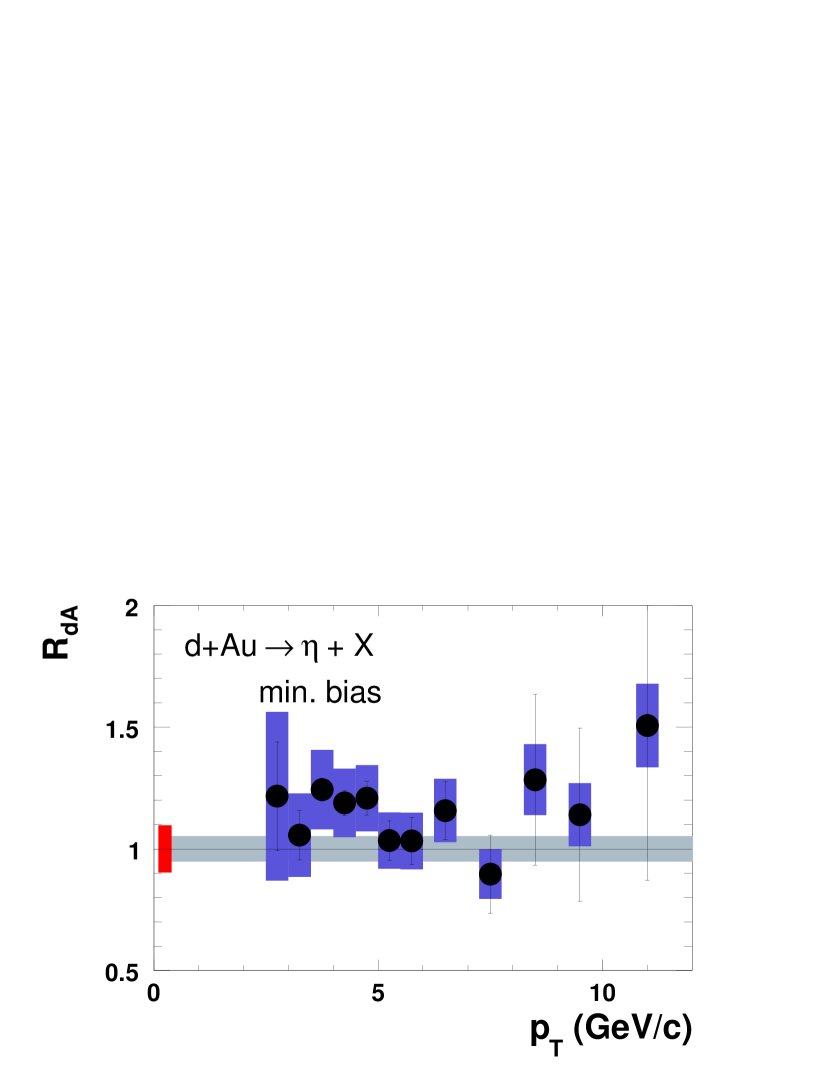
All the d+Au nuclear modification factors shown in Figs. 16
and 17 are approximately 1 and show a very weak and/or
centrality dependence.
Similar trends have been observed for production ppg044 .
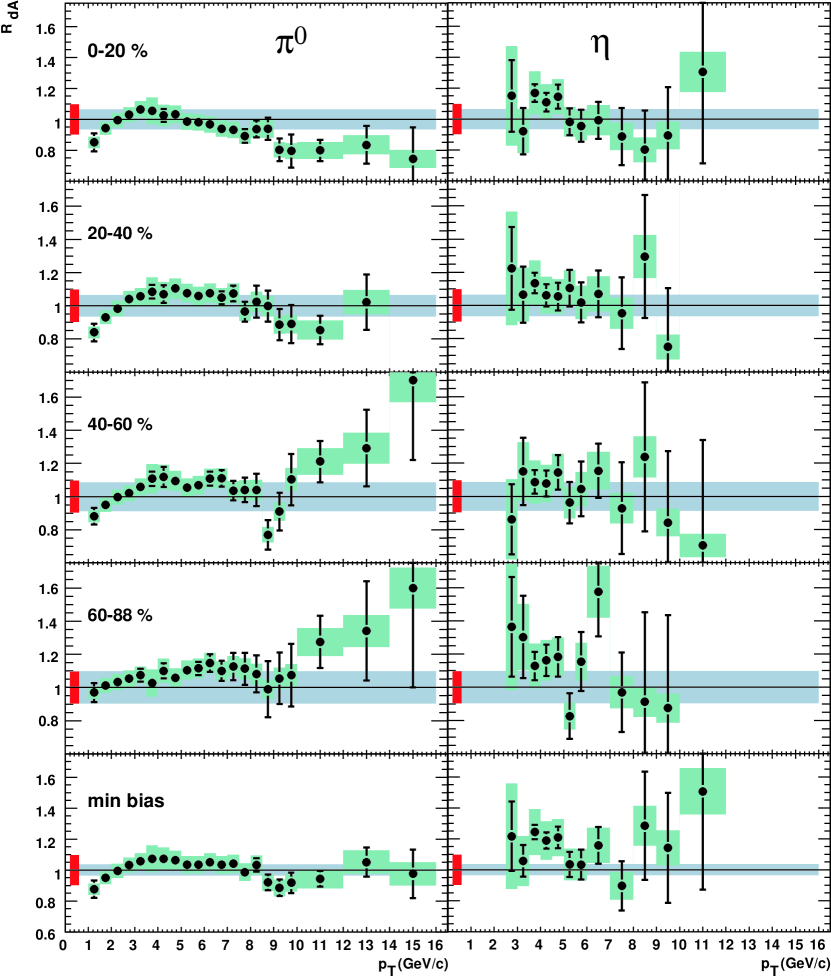
As shown in the comparison plot of Fig. 18, the
nuclear modification factors indicate small shape modifications with centrality,
with a possible Cronin enhancement on the level of around 4 GeV/
disappearing for GeV/. At high the
MB result can be described well by next-to-leading-order
pQCD calculations deFlorian03 ; guzey04 without implementation of the
Cronin effect. The contribution of (anti-)shadowing effects eks98 ; deFlorian03
in the or production is very small, as expected for this
kinematical region with 0.02-0.2.
The small role of initial-state cold nuclear effects observed in the mid-rapidity spectra of neutral mesons at high is also consistent with other similar observations in d+Au reactions at = 200 GeV such as: (i) the absence of significant nuclear modifications in the yields of compared to p+p collisions ppg038 , and (ii) the very similar characteristics of near-side and away-side jet-like correlations in p+p and d+Au ppg039 . Those results indicate that the nuclear medium has little influence on the hard processes in d+Au collisions at top RHIC energies and = 0.
IV.3 Nuclear Modification Factor in Au+Au, )
The nuclear modification factor, , for production in each centrality class in Au+Au collisions is computed using the standard formula:
| (7) |
where (i) the Au+Au spectra are used in the numerator (Fig. 15),
(ii) the p+p invariant spectrum (Fig. 13)
is used in the denominator, and
(iii) are the values of the average Glauber overlap
function for each Au+Au centrality (Table 2).
The is computed taking the bin-to-bin ratio of Au+Au and p+p spectra
and propagating the corresponding uncertainties. Only the acceptance
uncertainty (5%) cancels in the Au+Au/p+p ratio of spectra.
Figure 19 compares the nuclear modification
factor for measured in central (0–20%), semicentral (20–60%) and
peripheral (60–92%) Au+Au collisions. The error bars are the total point-to-point errors
(including type-A systematic and statistical uncertainties) of the
Au+Au and p+p measurements.
The error bands on the left are the uncertainties in for each
centrality class. The error box on the right is the Run-3 p+p cross-section
uncertainty of 9.7%. As observed for high-
ppg014 ; ppg054 , the Au+Au yields are consistent
with the expectation of independent scatterings in peripheral
reactions (1) but they are increasingly depleted with respect to this expectation
for more central collisions. There is no dependence of , as seen also
for neutral pions.
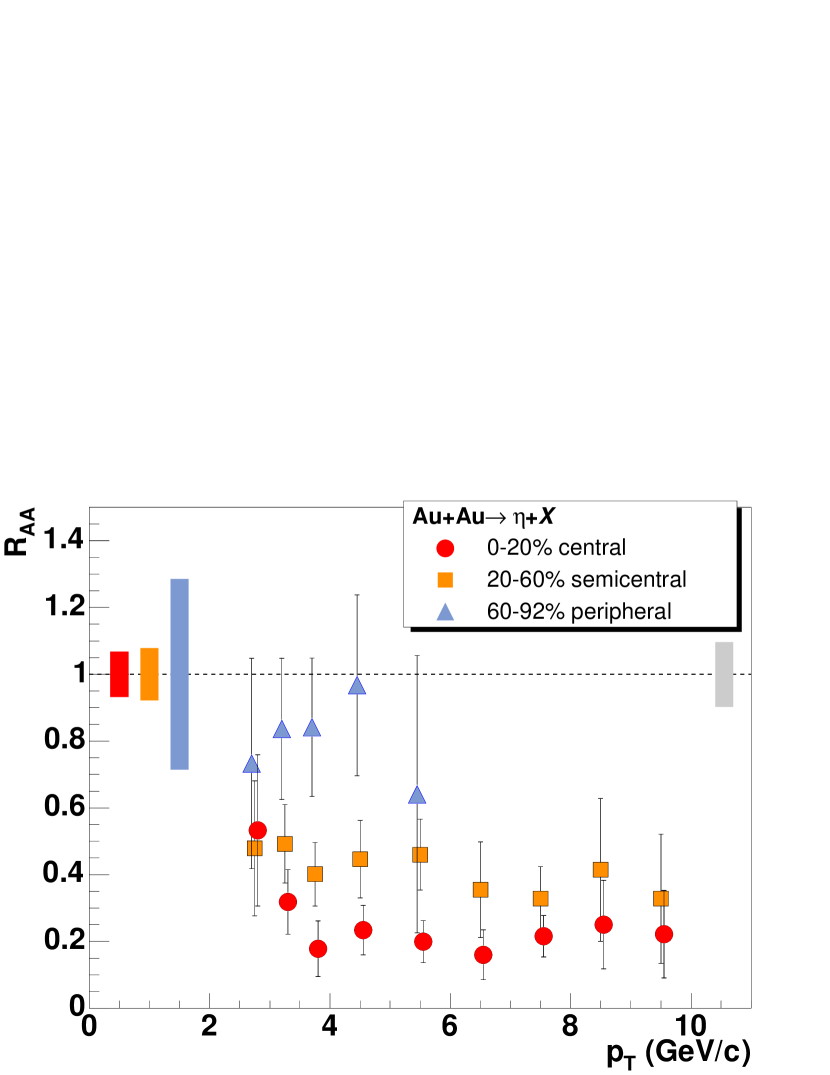
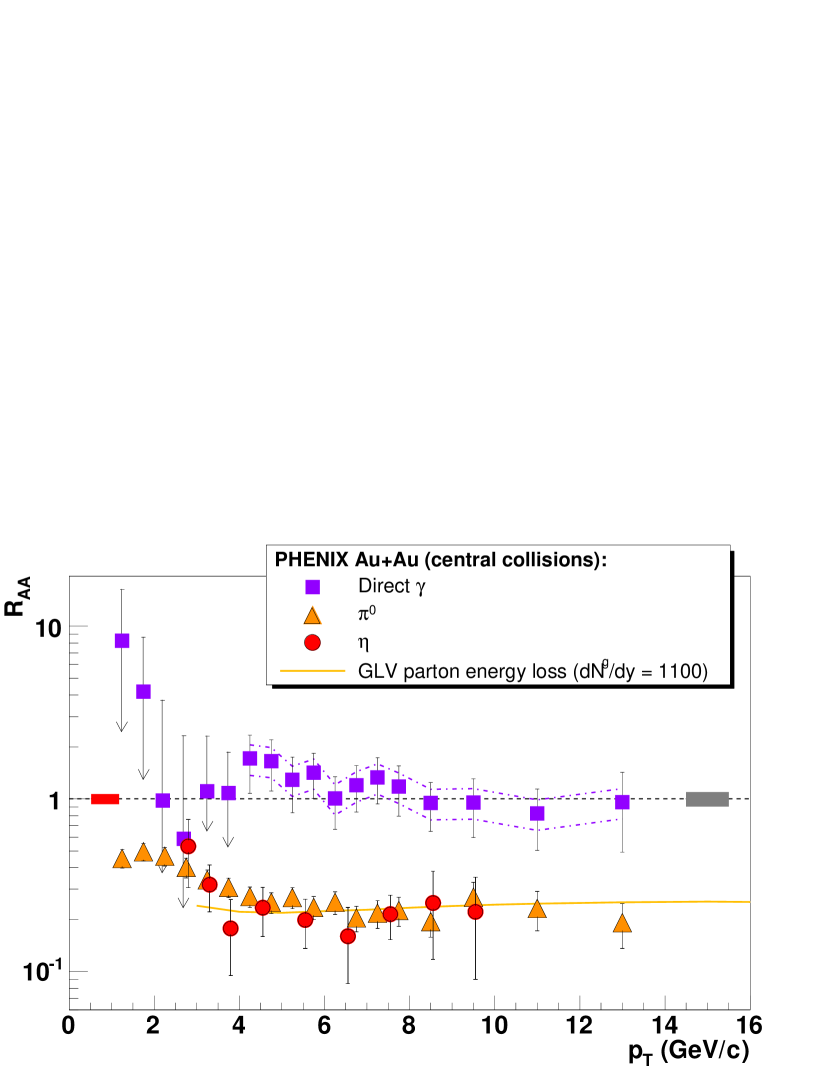
Figure 20 contrasts the nuclear modification factors measured
in central Au+Au at = 200 GeV for , ppg014 ; ppg054 and
ppg042 . Whereas direct photons are unsuppressed compared to the
scaled reference given by a NLO pQCD calculation ppg042 ; vogelsang that
reproduces the PHENIX p+p results well pp_gamma , neutral pions and
are suppressed by a similar factor of 5 compared to the corresponding
cross sections measured in p+p. Within the current uncertainties, light-quark neutral mesons at RHIC show a flat
suppression in the range 4 – 15 GeV/, independent of
their mass (note that the is 4 times heavier than the ).
Those results are in agreement with parton energy loss calculations in a
system with initial effective gluon densities of the order 1000
(solid curve in the figure) vitev_gyulassy .
The equal suppression of and mesons and the agreement
with parton energy loss calculations suggest that
the final fragmentation of the quenched parton into a leading meson
occurs in the vacuum according to the same probabilities (fragmentation functions)
that govern high- hadroproduction in more elementary systems (p+p, ).
This conclusion is examined in more detail in the next two sections.
IV.4 Ratio of to (p+p, d+Au, Au+Au)
A useful way to determine possible differences in the suppression pattern of
and is to study the centrality dependence of the
ratio, , in d+Au and Au+Au reactions and compare it
with the values measured in more elementary systems (p+p, ).
The “world” ratio in hadronic and proton-nucleus collisions
increases rapidly with and flattens out above 2.5 GeV/
at values 0.40 – 0.50 (see Section IV.5.1).
Likewise, in electron-positron annihilations at the pole ( GeV),
0.5 for energetic and
(with 0.4,
consistent with the range of scaled momenta considered here),
as discussed in Section IV.5.2.
It is interesting to test if this ratio is modified in any way
by initial- and/or final-state effects in d+Au and Au+Au collisions
at RHIC energies.
The production ratio of and mesons is shown in
Fig. 21 for p+p and in Fig. 22
for d+Au (MB and 4 centrality classes). The ratio is calculated point-by-point
for the d+Au measurements, propagating the corresponding errors. In the p+p case, a fit to the spectrum ppg054 was used.
All the ratios are consistent with the PYTHIA pythia
curve for p+p at = 200 GeV
(dashed line, see discussion in Section IV.5.1)
with an asymptotic = 0.5 value.
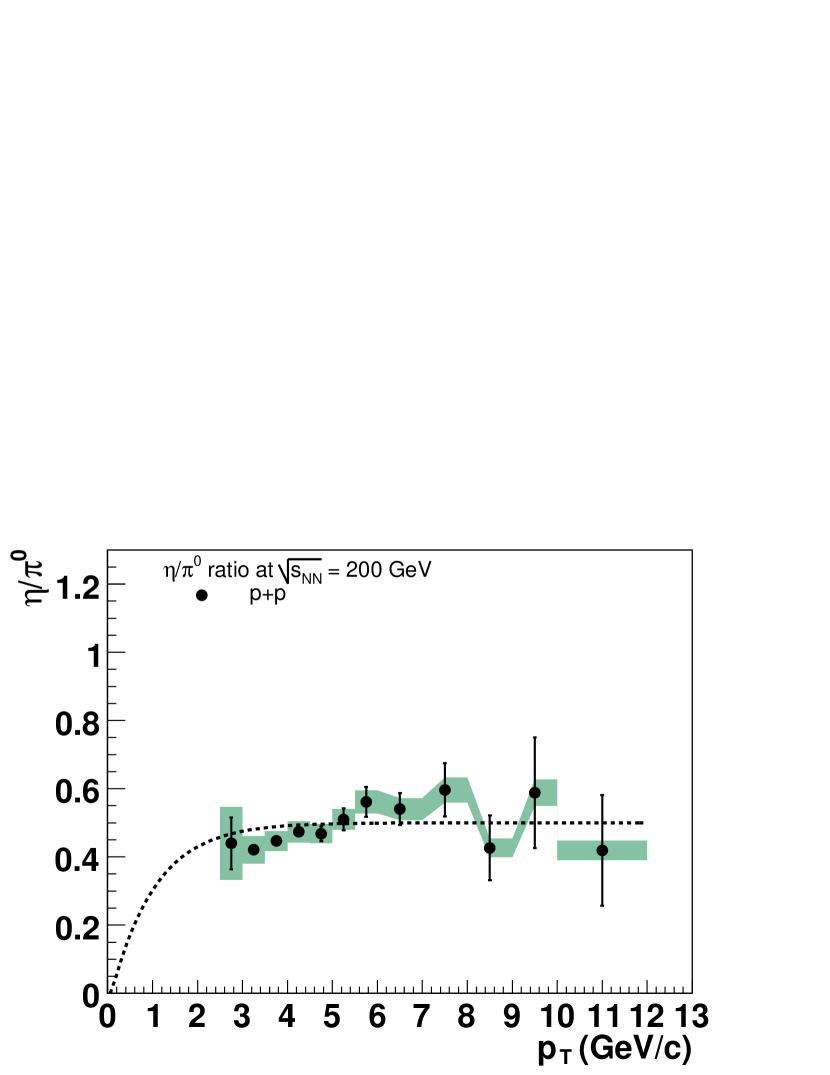
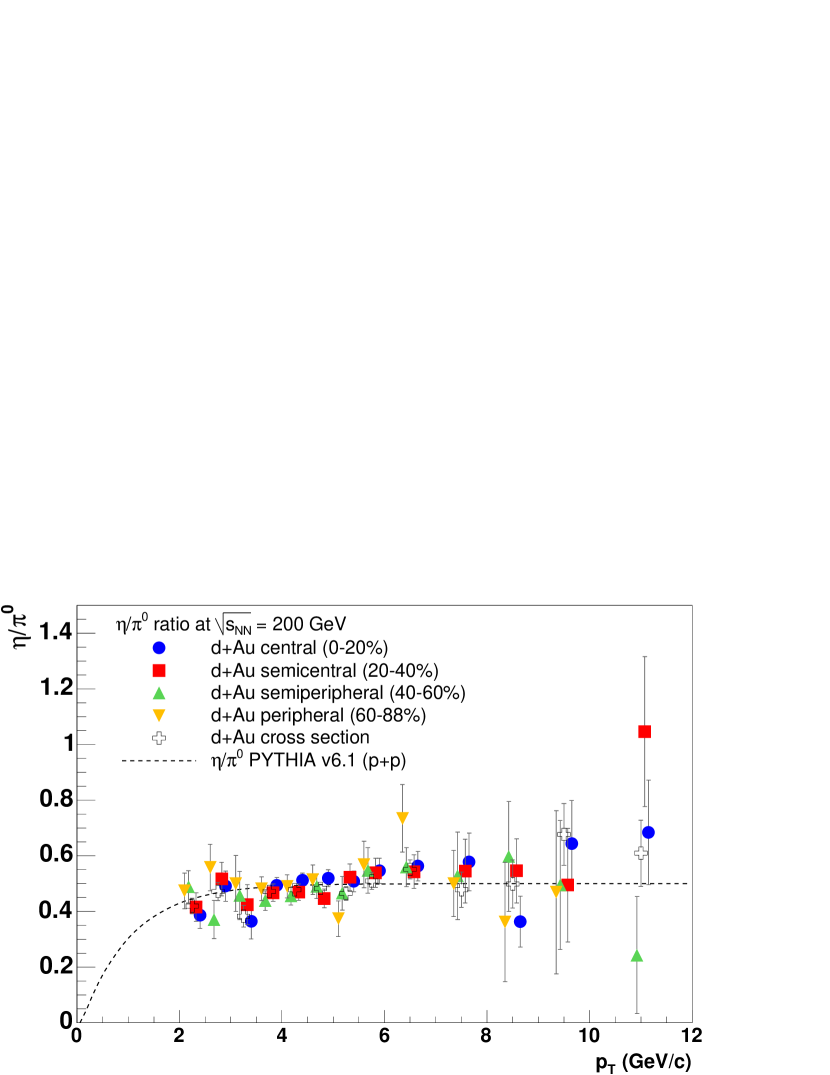
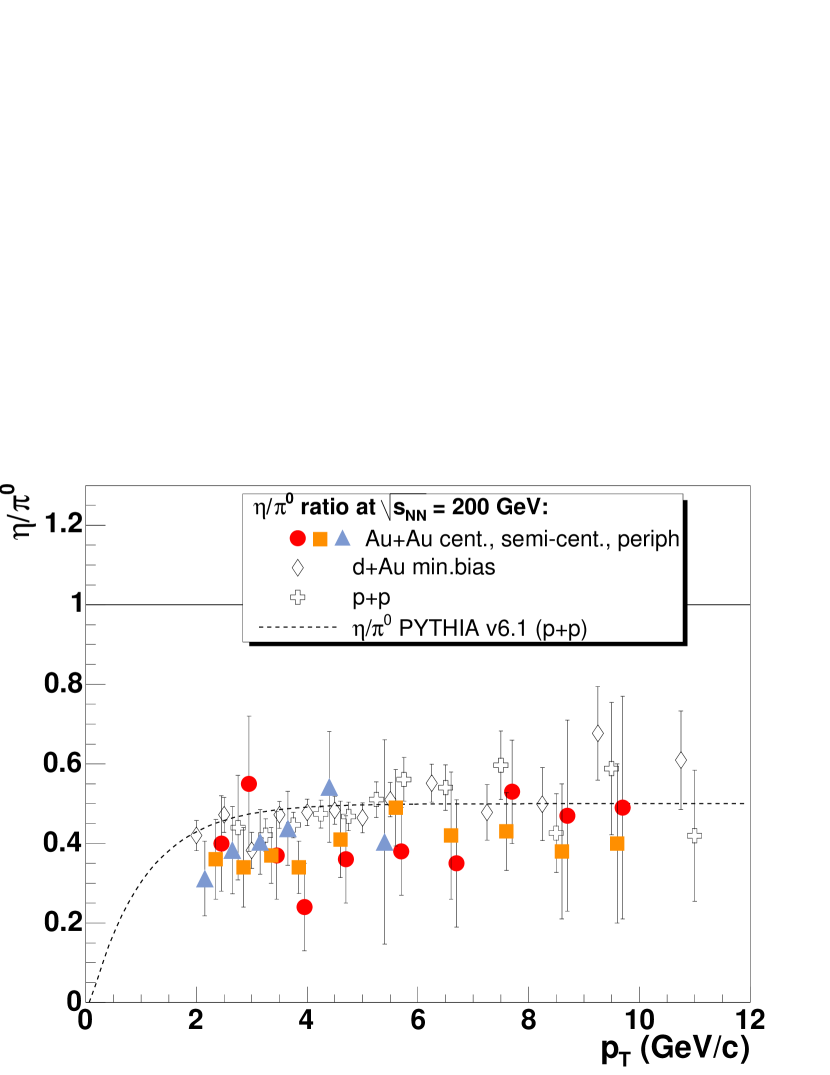
Figure 23 shows the ratio for MB and three Au+Au centralities, obtained using the latest PHENIX spectra ppg054 and removing those systematic uncertainties which cancel in the ratio. The data for Au+Au is compared to a PYTHIA pythia calculation that reproduces the hadronic collision data well (see next Section). Within uncertainties, all the ratios are consistent with 0.5 (dashed line) and show no collision system, centrality, or dependence. A simple fit to a constant above = 2 GeV/ yields the following ratios:
-
•
(Au+Au cent) = 0.40 0.04 (stat) 0.02 (syst), /ndf = 0.48
-
•
(Au+Au semicent) = 0.39 0.03 (stat) 0.02 (syst), /ndf = 0.26
-
•
(Au+Au periph) = 0.40 0.04 (stat) 0.02 (syst), /ndf = 0.42
-
•
(p+p)= 0.48 0.02 (stat) 0.02 (syst), /ndf = 0.89
-
•
(d+Au)= 0.47 0.02 (stat) 0.02 (syst), /ndf = 0.84
IV.5 World Data on the Ratio in High-Energy Particle Collisions
In this last Section of the paper, we present a compilation of experimental ratios as a function of transverse momentum, , measured in different hadronic and nuclear colliding systems in a wide range of center-of-mass energies ( 3 – 1800 GeV). The collected world data on ratios includes:
-
(i) hadron-hadron collisions (26 p+p, p+, +p data sets),
-
(ii) hadron-nucleus collisions (17 p,+A sets), and
-
(iii) nucleus-nucleus collisions (7 A+A data sets).
In addition, we present also the ratio obtained from inclusive and cross-sections in as a function of scaled momentum measured by the four LEP experiments at the pole ( 91.2 GeV) . In all cases, the ratio increases rapidly with (or ) and saturates at 0.4 – 0.5 above 3 GeV/ ( 0.3). The experimental ratios are also compared to PYTHIA and to -scaling expectations. PHENIX p+p, d+Au and Au+Au ratios at = 200 GeV are found to be consistent with the obtained world data on .
IV.5.1 ratio in hadron-hadron, hadron-nucleus and nuclear collisions ( 3 – 1800 GeV)
In Tables 8, 9 and 10 we list all data sets with published
and spectra and/or published ratios in
hadron-hadron, hadron-nucleus, and nucleus-nucleus collisions that we have found in the
literature. Most of those measurements are performed around mid-rapidity.
Roughly half of the listed have been directly taken from the original works whose references are
provided in the data tables. A few others have been constructed by taking the ratio of the
published and invariant cross-section spectra measured at the same .
In the latter case, the error in the ratio has been computed by adding statistical and systematic
uncertainties quadratically. There were a few cases where the binning of the
spectrum did not match that of the . In these cases, the spectrum
was fitted with a functional form that reproduced the data well
(usually a modified power law of the form discussed in dde_hq04 ) and the ratio was then obtained by dividing the spectrum data
points by the values of the function at each point. In this case, the error
was computed by dividing the quoted error by the function value at that point.
The uncertainty arising from the spectrum fit was obtained by computing the
minimum and maximum ratio values at each point. Both errors were then added in quadrature.
In Tables 8, 9 and 10, together with the general info
on the collected data sets, we indicate for each measurement the approximate and
ranges, as well as the average value of at
high , obtained by fitting the data to a constant above = 2 GeV/.
With the exception of the higher energy data ( 100 GeV), most of the
experimental ratios have been measured in a fractional momentum range
0.1 – 0.3 where the parton distribution functions are dominated by
valence quarks (rather than gluons) and, hence, the produced high-
and mesons come largely from fragmentation.
Figures 24, 25, and 26
show the corresponding ratios for each type of colliding system.
All the ratios show a rapid increase with and level off at
0.4 – 0.5 above 3 GeV/.
No difference is observed for different colliding systems. The PHENIX p+p, d+Au and Au+Au
high- data presented in the previous section are consistent with those ratios.
A fit of the PHENIX ratios to a constant gives = 0.47 0.03
for both p+p and d+Au and, slightly lower but still consistent,
= 0.40 0.04 for Au+Au.
Together with the data points in Figs. 24–26,
we also plot two phenomenological curves with PYTHIA 6.131 pythia based on the
Lund fragmentation model And83 ; And98 , and on -scaling expectations
for the ratio in p+p collisions at = 200 GeV.
Lund string fragmentation:
The fragmentation mechanism in PYTHIA is based on the phenomenological Lund string scheme And83 ; And98 which considers the color field between the partons to be the fragmenting entity rather than the quarks and gluons themselves. The string is viewed as a color flux tube formed by gluon self-interaction between the partons. As the partons move apart the potential energy stored in the string increases. At some point the string breaks via the production of new pairs according to the probability of a quantum-mechanical tunneling process, , which depends on the transverse-mass squared () and the string tension 1 GeV/fm 0.2 GeV2. The string break-up process proceeds repeatedly into color singlet systems as long as the invariant mass of the string pieces exceeds the on-shell mass of a hadron (each hadron corresponding to a small piece of string with a quark at one end and an antiquark at the other). At each branching, probabilistic rules are given for the production of flavors ( = 1 : 1 : 0.3 in the default settings), spin (e.g. a 3:1 mixture between the lowest lying vector and pseudoscalar multiplets is used, suggested by spin counting arguments), and for the sharing of energy and momentum among the products. Regarding the latter, the probability that a hadron picks a fraction of out of the available ( is the momentum of the formed hadron along the direction of the quark ) is given by the “Lund symmetric fragmentation function”:
| (8) |
where and are free parameters adjusted to bring the fragmentation into
accordance with measured LEP data, e.g. = 0.3 and = 0.58 GeV-2 are
the current default values for PYTHIA 6.3 pythia6.3 .
In addition, for the flavor-diagonal meson states ,
PYTHIA also includes mixing into the physical mesons. This is done according to a
parametrization, based on the mixing angles given in the Review of Particle
Properties pdg . In particular, the default choices correspond to
and
.
Thus, in the system, no account is taken of the difference
in masses, an approximation which seems to lead to an overestimate of
rates in annihilation aleph92_eta_Buskulic . PYTHIA includes therefore parameters
to allow an additional “tunable” suppression of and states.
The PYTHIA Monte Carlo simulations of and -differential cross-sections
were carried out with the default settings. In particular, no ad-hoc suppression of was
selected. Any uncertainty related to the choice of any (flavor-independent) settings
should in principle cancel in the ratio of both spectra.
As seen in Figs. 24–26, within the (relatively large in some cases) experimental uncertainties, good agreement between
the data and the model prediction is found
for all the colliding systems and ranges, despite being at very different
center-of-mass energies. We have also run PYTHIA at = 30 GeV as a reference
for lower energy results, but the resulting curve, though slightly lower
at high- ( 0.44) is still relatively close to the
one obtained at = 200 GeV. This is an indication that the dependence of
the production mechanisms for both neutral mesons are very similar for all systems and
c.m. energies and, correspondingly, the ratio of -differential cross-sections is basically
independent of the characteristics of the initial collision process, but dominated by the
ratio of and (vacuum) FF which is relatively constant in this kinematic
range (see discussion in Section IV.5.2).
| System | (GeV) | (GeV/) | range (GeV/) | range | 2 GeV/) | Authors | Collab./Exp. | Ref. |
|---|---|---|---|---|---|---|---|---|
| p+p | 13.8 | 100. | Donaldson 78 | FNAL M2 | Donaldson78 | |||
| +p | 13.8 | 100. | Donaldson 78 | FNAL M2 | Donaldson78 | |||
| +p | 13.8 | 100. | Donaldson 78 | FNAL M2 | Donaldson78 | |||
| +p | 19.4 | 200. | Donaldson 78 | FNAL M2 | Donaldson78 | |||
| +p | 19.4 | 200. | Donaldson 78 | FNAL M2 | Donaldson78 | |||
| p+p | 19.4 | 200. | Donaldson 78 | FNAL M2 | Donaldson78 | |||
| p+p | 23.0 | 280. | Bonesini 88 | CERN WA70 | Bonesini88 | |||
| +p | 23.0 | 280. | Bonesini 88 | CERN WA70 | Bonesini88 | |||
| +p | 23.0 | 280. | Bonesini 88 | CERN WA70 | Bonesini88 | |||
| p+p | 24.3 | Antille 87 | CERN UA6 | Antille87 | ||||
| +p | 24.3 | Antille 87 | CERN UA6 | Antille87 | ||||
| p+p | 27.5 | 400. | Aguilar 91 | NA 27 | na27 | |||
| p+p | 30.6 | Amaldi 79 | ISR | Amaldi79 | ||||
| p+p | 30.6 | Kourkoumelis 79 | ISR | Kourkoumelis79 | ||||
| p+p | 31.6 | 530. | Apanasevich 02 | FNAL 706 | Apanasevich02 | |||
| p+p | 38.8 | 800. | Apanasevich 02 | FNAL 706 | Apanasevich02 | |||
| p+p | 52.7 | Kourkoumelis 79 | ISR | Kourkoumelis79 | ||||
| +p | 53. | Akesson 85 | ISR AFS | Akesson85 | ||||
| p+p | 53. | Akesson 85 | ISR AFS | Akesson85 | ||||
| p+p | 53.2 | Amaldi 79 | ISR | Amaldi79 | ||||
| p+p | 62.4 | Kourkoumelis 79 | ISR AFS | Kourkoumelis79 | ||||
| p+p | 63. | Akesson 86 | ISR AFS | Akesson86 | ||||
| p+p | 63. | Akesson 83 | ISR AFS | Akesson83 | ||||
| p+p | 200. | S.S.Adler 06 | PHENIX | this work | ||||
| +p | 540. | Banner 85 | CERN UA2 | Banner85 | ||||
| +p | 1800. | Abe 93 | CDF | Abe93 |
| System | (GeV) | (GeV/) | range (GeV/) | range | 2 GeV/) | Authors | Collab./Exp. | Ref. |
|---|---|---|---|---|---|---|---|---|
| p+Be | 19.4 | 200. | Povlis 83 | FNAL E629 | Povlis83 | |||
| p+C | 19.4 | 200. | Povlis 83 | FNAL E629 | Povlis83 | |||
| p+Al | 19.4 | 200. | Povlis 83 | FNAL E629 | Povlis83 | |||
| +C | 19.4 | 200. | Povlis 83 | FNAL E629 | Povlis83 | |||
| p+Be | 23.8 | 300. | Deschamps 85 | FNAL E515 | Delchamps85 | |||
| p+Be | 29.1 | 450. | Agakichiev 98 | TAPS/CERES | taps_ceres | |||
| p+Au | 29.1 | 450. | Agakichiev 98 | TAPS/CERES | taps_ceres | |||
| p+Be | 29.1 | 450. | Tikhomirov 95 | HELIOS | helios95 | |||
| p+Be | 30.7 | 500. | Alverson 93 | FNAL E706 | Alverson93 | |||
| +Be | 30.7 | 500. | Alverson 93 | FNAL E706 | Alverson93 | |||
| +p | 31.1 | 515. | Apanasevich 03 | FNAL 706 | Apanasevich03 | |||
| +Be | 31.1 | 515. | Apanasevich 03 | FNAL 706 | Apanasevich03 | |||
| +Cu | 31.1 | 515. | Apanasevich 03 | FNAL 706 | Apanasevich03 | |||
| p+Be | 31.6 | 530. | Apanasevich 03 | FNAL 706 | Apanasevich03 | |||
| p+Cu | 31.6 | 530. | Apanasevich 03 | FNAL 706 | Apanasevich03 | |||
| p+Be | 38.8 | 800. | Apanasevich 03 | FNAL 706 | Apanasevich03 | |||
| p+Cu | 38.8 | 800. | Apanasevich 03 | FNAL 706 | Apanasevich03 | |||
| d+Au | 200. | S.S.Adler 06 | PHENIX | this work |
| System | (GeV) | (GeV/) | range (GeV/) | range | 2 GeV/) | Authors | Collab./Exp. | Ref. |
|---|---|---|---|---|---|---|---|---|
| C+C | 2.7 | 2. | Averbeck 97 | GSI TAPS | Averbeck97 | |||
| Ca+Ca | 2.7 | 2. | Averbeck 03 | GSI TAPS | Averbeck03 | |||
| Ni+Ni | 2.7 | 1.9 | Averbeck 03 | GSI TAPS | Averbeck03 | |||
| Pb+Pb | 17.3 | 158. | Aggarwal 00 | CERN WA98 | Aggarwal00 | |||
| S+S | 19.4 | 200. | Albrecht 95 | CERN WA80 | Albrecht95 | |||
| S+Au | 19.4 | 200. | Albrecht 95 | CERN WA80 | Albrecht95 | |||
| Au+Au | 200. | S.S.Adler 06 | PHENIX | this work |
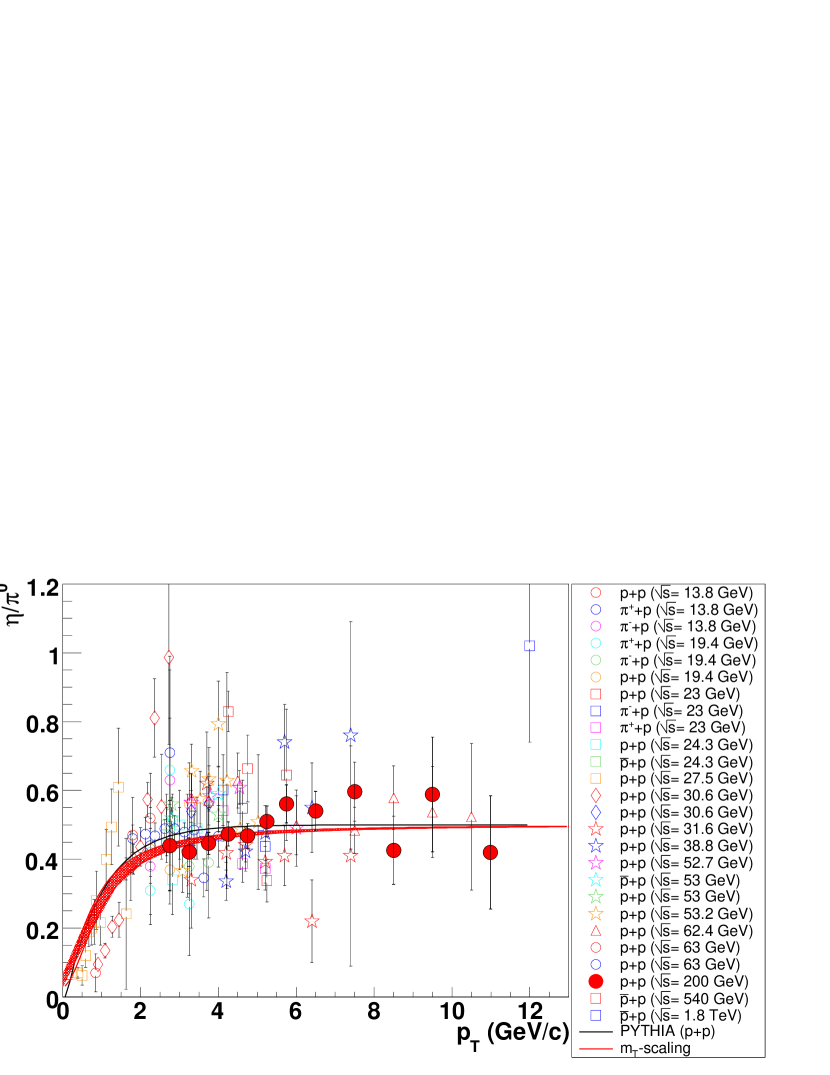
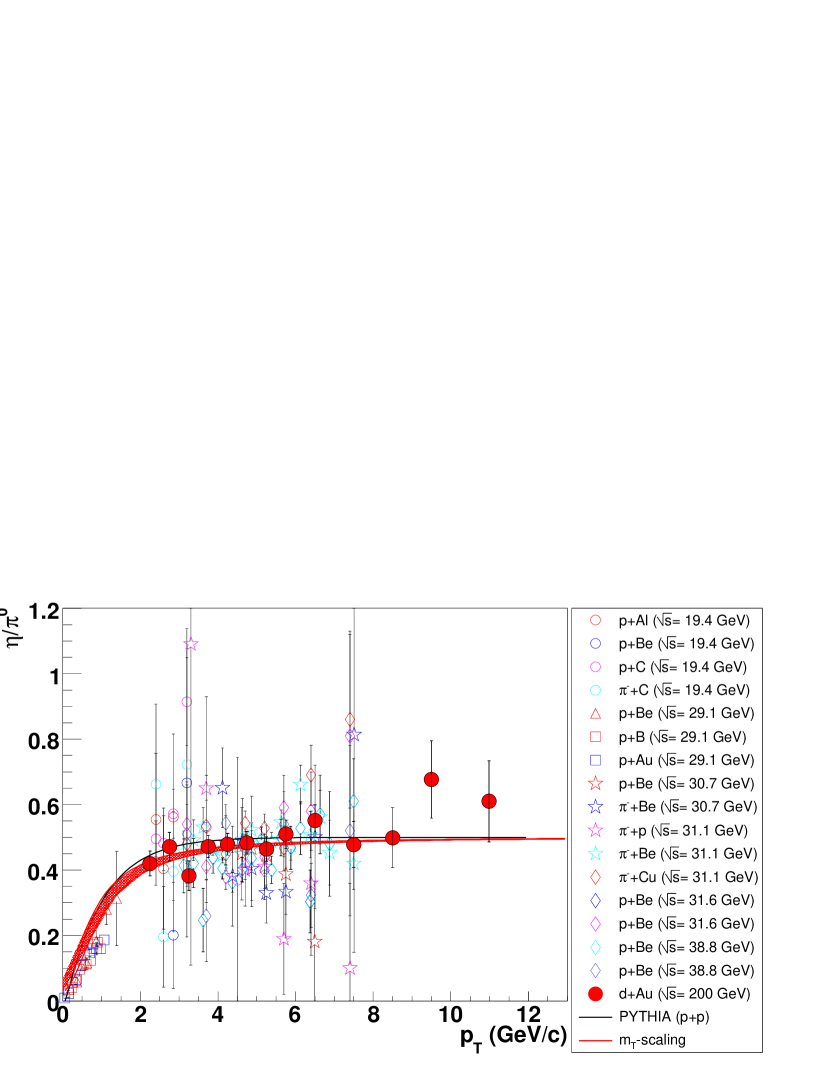
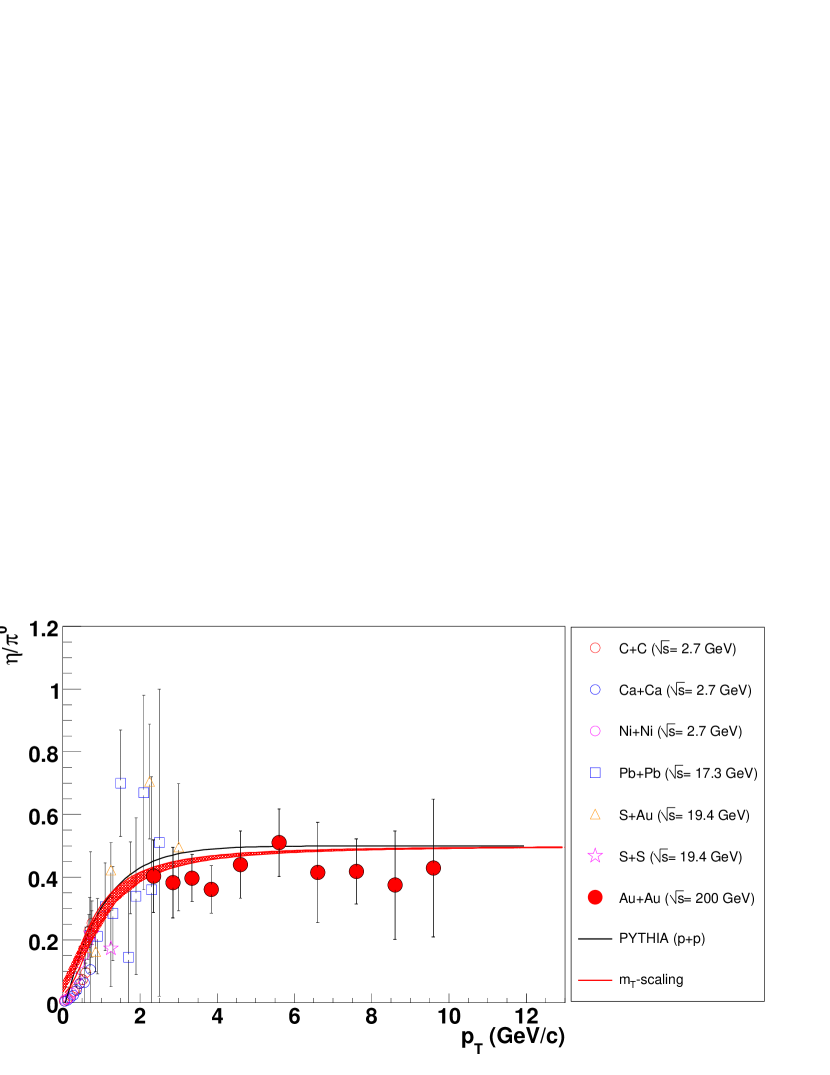
scaling:
The red shaded curve shown in Figs. 24, 25 and 26 corresponds to an empirical -scaling observation mt_scaling which assumes that the hadron differential cross-sections, plotted as a function of the transverse mass of the produced particle , all have the same shape, , with an absolute normalization factor which can vary but which is found to be the same for many species:
| (9) |
Assuming isospin symmetry for pion production, we have combined the measured PHENIX charged (measured in the range = 0.2 – 2.6 GeV/) ppg045 and neutral ( = 1 – 14 GeV/) ppg044 pion differential cross-sections in p+p collisions and fitted them with a modified power-law functional form222Note that the and parameters of Eq. (10) are not independent but strongly correlated. They are actually related to the mean transverse mass of the spectrum via . that reproduces the full spectra well in the range 0.2 – 14 GeV/:
| (10) |
If one assumes that -scaling holds for , then its spectrum can also be represented by Eqs. (9) and (10) (with, in principle, a different ) and therefore, the ratio as a function of should follow:
| (11) |
where is the asymptotic value
of the ratio of over for large . Note that since the assumption
of -scaling is that both -differential cross-sections have the same shape,
the same parameters = 1.2 and = 10 are valid for both spectra as well as
for the ratio (Eq. 11). In all figures, the plotted -scaling
curve with an asymptotic value of = 0.5 is found to be
in good agreement with both the data and the PYTHIA predictions. We note that the
agreement between PYTHIA and -scaling is not unexpected in as much as the Lund
“fragmentation function,” Eq. (8), depends explicitly on the
of the produced hadron. The upper red curve shown in all plots is that
with the and parameters of Eq. (11) that reproduce the
power-law shape of the meson spectra at = 200 GeV. At lower ,
the spectra get increasingly steeper and and change accordingly ( and
are correlated with which itself is a logarithmically increasing function
of , i.e. ). For illustrative purposes, we have
(arbitrarily) fixed the parameter to the value = 1.2 and refitted the spectra measured at different center-of-mass energies
with as a free exponent.
With fixed the corresponding values of the power-law exponent increase with decreasing
as 10., 11.5, 13.5 and 14.0 at = 200, 63, 27 and 13 GeV,
respectively. The shaded red area indicates the range of expected -scaling ratios
for power-law exponents = 10.–14. The differences are negligible at large
– where the and masses are much smaller than their and the ratio
(Eq. 11)
is independent of – but become increasingly large at lower ( 3 GeV).
Furthermore, it is worth noting that in the low- region below 1 GeV/, the agreement
between the data and the -scaling curve is not always perfect for all data sets, even taking into account different
power-law exponents. This is due to the fact that at very low 0.–0.4 GeV/,
the pion yield rises due to contributions from multiple resonance decays and
the formula (Eq. 10) does not reproduce the spectral shape of the data anymore.
Instead, an exponential behavior of the form hagedorn
extrapolates the spectra better in the soft regime all the way down to = 0 GeV/.
However, for all practical purposes in this analysis focused on high- production,
we will consider Eq. (10) (and correspondingly Eq. 11)
to be a good enough approximation.
Lastly we want to mention that in the case of nucleus-nucleus collisions the existence of a strong collective radial flow ( 0.6 at RHIC phnx_whitepaper ), absent in p+p collisions, changes the spectral shape of different hadrons produced at low transverse momenta ( 2 GeV/) and should result in a violation of the -scaling behavior witt04 . Since hydrodynamical flow results in a larger boost for the (heavier) than for , one expects a comparatively larger ratio in Au+Au than in p+p collisions below 2 GeV/. Unfortunately, we cannot test this assertion with RHIC data since our lowest value ( 2 GeV/) is just in the range where radial flow effects start to die out. The same holds true also for the recent proposal peitzmann05 to study the ratio as a tool to test different parton recombination scenarios in hadron production in nucleus-nucleus collisions. Lower- measurements, which are intrinsically more difficult due to the reduced PHENIX acceptance and the larger combinatorial background, would be needed to better address the role of collective flow and/or parton recombination effects on the spectral shape and yields of light neutral mesons in Au+Au collisions at RHIC.
IV.5.2 ratio in collisions at the pole ( 91.2 GeV)
In this last section we are interested in determining the ratio in an elementary colliding system such as and comparing it to the corresponding ratios obtained in hadronic and nuclear collisions. In the dominant high-momentum hadron production mechanism is fragmentation since gluon production (and subsequent fragmentation) occurs with a probability which is suppressed by a factor , and therefore plays a comparatively less significant role than in the (highest energy) hadronic and nuclear collisions discussed in the previous section. Some of the experimental interest in the study of production in collisions was in fact triggered by theoretical expectations that the isoscalar mesons contained a significant component, and thus that gluon jets should exhibit an anomalously large tendency to fragment into and mesons Peterson:1980ax ; Ball:1995zv ; Fritzsch:1997ps . However, this hypothesis was not confirmed by a detailed analysis of the ALEPH gluon fragmentation data aleph99_eta_pi0_Barate . Table 11 lists all the existing measurements of inclusive and production in collisions at LEP at energies around the pole. At lower energies, there are several results on inclusive production in but few measurements exist ( 29 and 35 GeV at SLAC PEP Wormser:1988ru ; Abachi:1987qd and SLC Bartel:1983pe ; Bartel:1985wn ; Pitzl:1989qy ; Behrend:1989gn , respectively), and we could not determine the corresponding ratios.
| Collaboration - Year | Particle | Authors [Ref.] |
|---|---|---|
| ALEPH 92 | Buskulic et al. aleph92_eta_Buskulic | |
| ALEPH 96a | Barate et al. aleph96_pi0_Barate | |
| ALEPH 96b | Barate et al. aleph96_eta_pi0_Barate | |
| ALEPH 99 | Barate et al. aleph99_eta_pi0_Barate | |
| ALEPH 01 | Heister et al. aleph01_eta_Heister | |
| DELPHI 95 | Adam et al. delphi95_pi0_Adam | |
| L3 91 | Adeva et al. l3_91_pi0_Adeva | |
| L3 92 | Adriani et al. l3_92_eta_Adriani | |
| L3 94a | Acciarriet al. l3_94_eta_pi0_Acciarri | |
| OPAL 98 | Ackerstaff et al. opal98_eta_pi0_Ackerstaff | |
| OPAL 00 | Abbiendi et al. opal00_eta_pi0_Abbiendi |
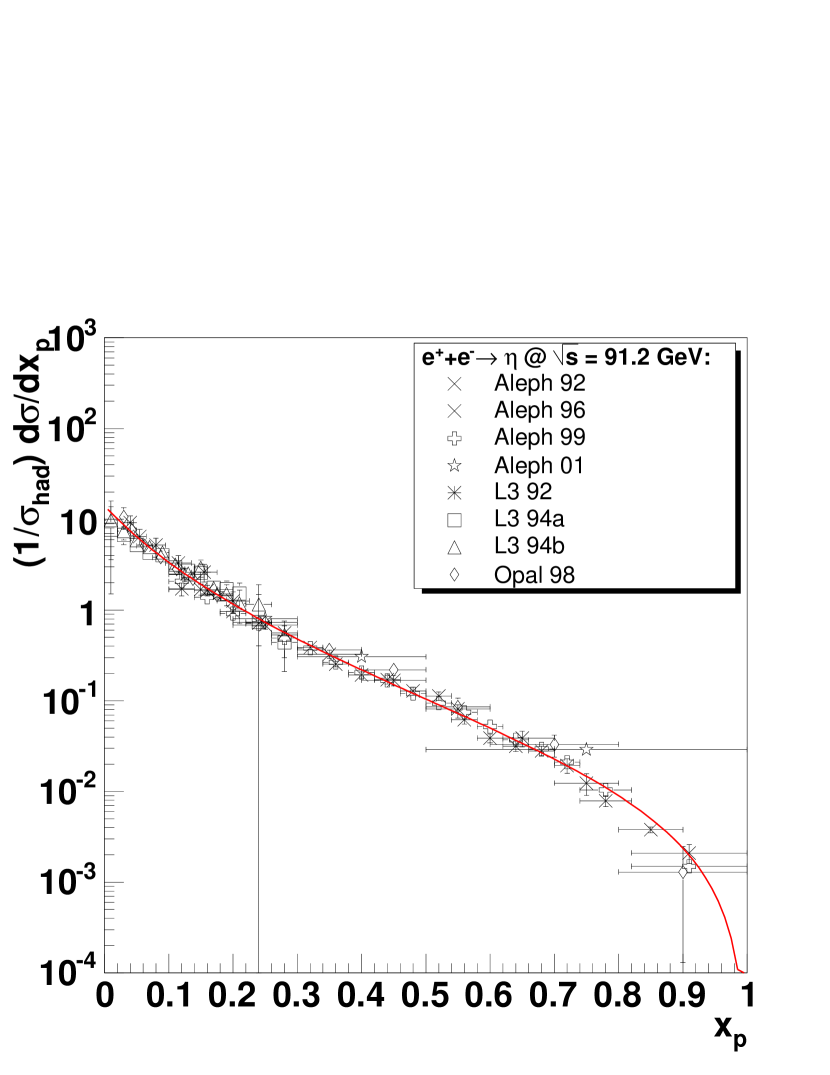
Figures 27 and 28 show the combined inclusive and invariant cross-sections measured as a function of the scaled particle momentum . Note that the overall and spectra have been measured in ranges which are not completely overlapping. There are more experimental measurements on inclusive () production at large (small) 0.7 (0.1). For this reason, in order to obtain the ratio of over cross-sections, we have parametrized the cross-section as
| (12) |
and taken the ratio of the individual data points over the resulting fit. We note that there is currently no FF available in the standard FF sets at hand in the literature (BKK bkk , KKP kkp , Kretzer kretzer , BFGW bfgw ). Namely, the LEP data compiled in Fig. 27 have not been fitted and coded so far into any usable format that can be handled within a QCD collinear factorization approach. We are aware of only two works (Rolli et al. at NLO eta_FF_rolli , and Indumathi and collaborators at LO Indumathi:1998am ) which have tried to parametrize the FF from these data. An updated version of the FF would be useful as input to a NLO pQCD cross-section calculation for comparison to the results presented here and especially in the light of upcoming high- asymmetry results using polarized beams of relevance for the proton spin program at RHIC phenix_eta_spin . Fitting all the available data with Eq. (12), we obtain the following empirical parametrization:
| (13) |
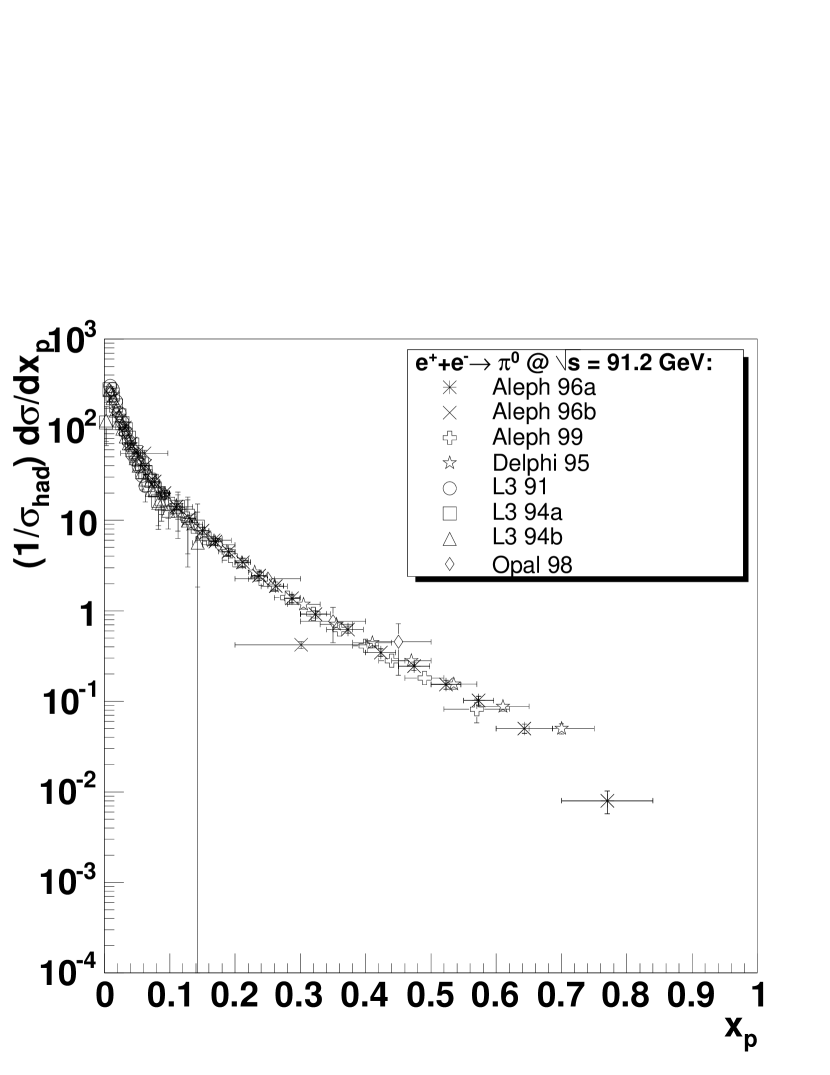
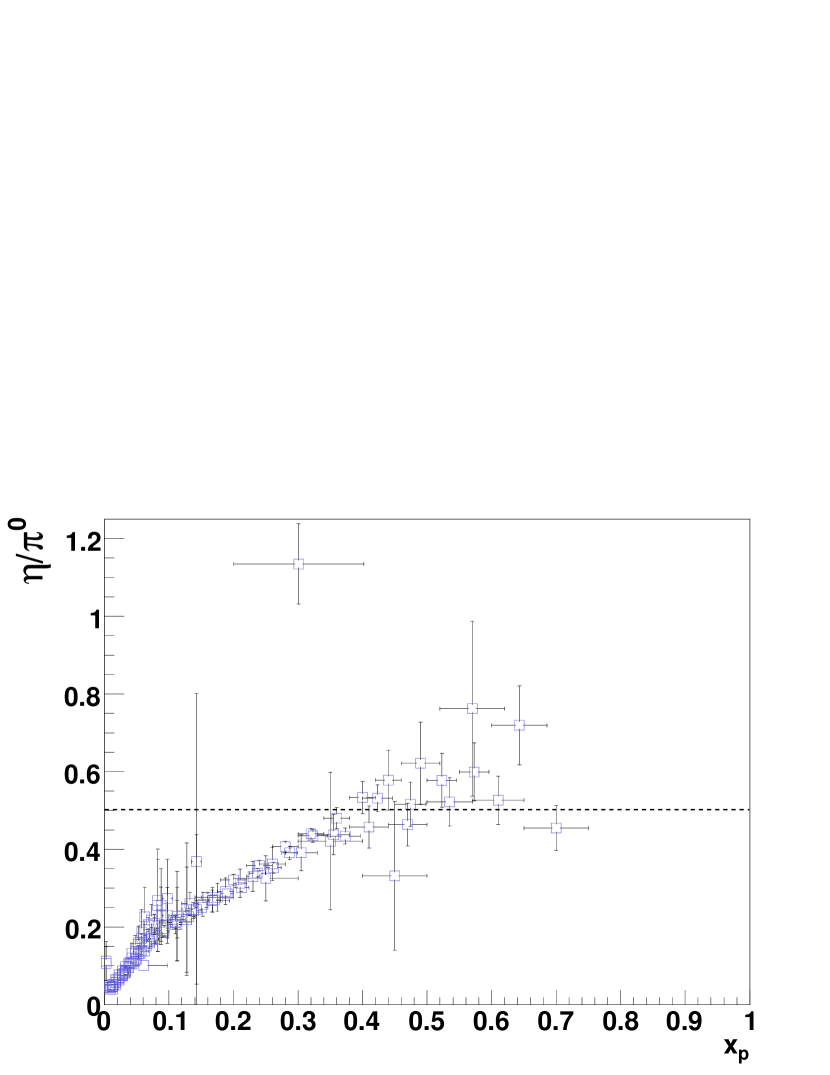
Using the fit (Eq. 13) and the data plotted in Fig. 28 we have obtained the ratio shown in Fig. 29. As seen for the corresponding ratios in hadronic and nuclear collisions, at low values of (scaled) momentum the production overwhelms that of (a significant fraction of low-energy pions issues from decay contributions of heavier hadrons), but the ratio increases with . From , the ratio is consistent with the asymptotic ratio of 0.5 found in hadron and nuclear collisions (dashed curve). This range corresponds to the values of fractional momenta typically carried by the leading high- hadrons produced in high-energy h+p, h+A and A+A collisions ppg029 ; kretzer2 . New results on inclusive and production above = 0.6 in collisions at the -factories (BELLE and BaBar) would be useful to determine whether the value of the ratio indeed saturates at = 0.5 or keeps increasing with as suggested by Fig. 29.
IV.6 Summary of Experimental Results
The studies presented here on high- and production in the three colliding systems (p+p, d+Au, Au+Au) provide interesting insights on initial- and final-state QCD effects in cold nuclear matter (d+Au) and on the properties of the hot and dense medium produced in central Au+Au collisions. The absence of any strong deviation from the point-like scaling expectations for the -differential and yields measured in d+Au relative to p+p (Fig. 18) indicates that the amount of nuclear shadowing and initial-state broadening is a small effect (at the 10% level) at mid-rapidity at RHIC energies. This is in contrast with results at lower energies which showed a larger Cronin enhancement for high- mesons than observed here. One reason for the difference is likely due to the fact that hadron spectra at lower have steeper slopes and thus initial-state “kicks” produce a relatively larger net effect than on the harder spectra at RHIC energies. The unsuppressed d+Au yields combined with the observation of strongly depleted yields of and in central Au+Au compared to binary-scaled p+p collisions (Fig. 19) indicate that the suppression is a final-state effect in the hot and dense matter produced in the central Au+Au reactions. The consistent values of the ratios measured at high in nuclear (Figs. 25 and 26) as well as in more elementary p+p (Fig. 24) and (Fig. 29) collisions clearly supports the idea that the suppression occurs at the parton level before the fragmentation of the parent quarks and gluons into a given leading meson. In particular, the overall agreement of the ratio measured in Au+Au and collisions suggests that although the fast parent partons lose energy while traversing the system produced in central Au+Au collisions, their relative probability to fragment into a given meson, given by universal fragmentation functions, is preserved as expected for final hadron formation in the vacuum.
V SUMMARY
In summary, the transverse momentum spectra of mesons in the range = 2–12 GeV have been measured at mid-rapidity by the PHENIX experiment at RHIC in p+p, d+Au and Au+Au collisions at = 200 GeV. The mesons are reconstructed through their channel in the three colliding systems, as well as through the decay mode in p+p and d+Au collisions. These data provide additional characterization of high- hadroproduction in hadronic and nuclear collisions at RHIC energies. The d+Au yields are largely consistent with the p+p differential cross-sections scaled by the number of incoherent nucleon-nucleon collisions ( 1). No or centrality dependence is observed in the nuclear modification factor within uncertainties. Such an observation indicates a null or very weak broadening and, in general, a very modest influence of cold nuclear matter effects, such as shadowing of parton distribution functions, Cronin broadening, and/or hadronization by parton recombination, on high- meson production at mid-rapidity at top RHIC energies. In contrast, the invariant yields measured in Au+Au are increasingly depleted with centrality compared to expectations from binary-scaled p+p collisions, up to a maximum factor of 5 suppression in central collisions. The magnitude, and centrality dependence of the Au+Au suppression is the same for mesons and neutral pions. The measured / ratio in p+p, d+Au and Au+Au is nearly flat over = 2–12 GeV/ and is independent of the reaction centrality. A fit to a constant yields = 0.4–0.5, in agreement with the experimental world values at high collected here for hadron-hadron, hadron-nucleus and nucleus-nucleus collisions in a wide range of center-of-mass energies ( 3–1800 GeV), as well as at high ( 0.35) in electron-positron annihilations measured at 91.2 GeV at LEP. These results indicate that any initial- and/or final-state nuclear effects influence the production of light neutral mesons at large in the same way. The similar suppression pattern of and mesons is consistent with the expectations of final-state parton energy loss in the dense medium formed in Au+Au reactions. The approximately constant / 0.40 0.04 ratio measured in central Au+Au collisions indicates that the attenuated parent partons fragment into leading mesons () in the vacuum according to the same probabilities that govern high- hadron production in more elementary (, p+p) collisions.
Acknowledgements
We thank the staff of the Collider-Accelerator and Physics Departments at Brookhaven National Laboratory and the staff of the other PHENIX participating institutions for their vital contributions. We acknowledge support from the Department of Energy, Office of Science, Office of Nuclear Physics, the National Science Foundation, Abilene Christian University Research Council, Research Foundation of SUNY, and Dean of the College of Arts and Sciences, Vanderbilt University (U.S.A), Ministry of Education, Culture, Sports, Science, and Technology and the Japan Society for the Promotion of Science (Japan), Conselho Nacional de Desenvolvimento Científico e Tecnológico and Fundação de Amparo à Pesquisa do Estado de São Paulo (Brazil), Natural Science Foundation of China (People’s Republic of China), Centre National de la Recherche Scientifique, Commissariat à l’Énergie Atomique, and Institut National de Physique Nucléaire et de Physique des Particules (France), Ministry of Industry, Science and Tekhnologies, Bundesministerium für Bildung und Forschung, Deutscher Akademischer Austausch Dienst, and Alexander von Humboldt Stiftung (Germany), Hungarian National Science Fund, OTKA (Hungary), Department of Atomic Energy (India), Israel Science Foundation (Israel), Korea Research Foundation and Korea Science and Engineering Foundation (Korea), Ministry of Education and Science, Rassia Academy of Sciences, Federal Agency of Atomic Energy (Russia), VR and the Wallenberg Foundation (Sweden), the U.S. Civilian Research and Development Foundation for the Independent States of the Former Soviet Union, the US-Hungarian NSF-OTKA-MTA, and the US-Israel Binational Science Foundation.
APPENDIX: DATA TABLES
.1 Invariant cross-sections (p+p, d+Au) and yields (Au+Au)
This Appendix collects the data tables of the spectra of mesons measured at mid-rapidity in p+p, d+Au and Au+Au collisions at = 200 GeV. The invariant cross-sections for production in MB p+p and d+Au collisions are tabulated in Table 13 and Table 13, respectively. The invariant d+Au yields measured in centralities 0–20%, 20–40%, 40–60%, and 60–88% are tabulated in Table 14. Finally, the invariant yields in Au+Au reactions (MB and centralities 0–20%, 20–60%, and 60–92%) are presented in Tables 15. The quoted errors are categorized by type:
(A) is a point-to-point error uncorrelated between bins,
(B) is correlated, all points move in the same direction but not by the same factor,
(C) is a normalization error in which all points move by the same factor independent of .
.2 Nuclear modification factors (d+Au, Au+Au)
We report below the data tables for various centralities in d+Au and Au+Au collisions. The errors quoted are the point-to-point and absolute normalization ones. Note that there is an additional 9.7% overall normalization uncertainty (Run-3 p+p BBC error, gray box in Fig. 19) not tabulated.
.3 ratios (p+p, d+Au, Au+Au)
The ratio of to invariant yields in p+p, d+Au and Au+Au collisions at = 200 GeV at mid-rapidity are tabulated in Tables 18, 19, and 20. The data presented here are for minimum bias events and various centrality bins in d+Au and Au+Au collisions.
| (GeV/) | (mb) | tot. err. | stat. err. | sys. err. | error A | error B | error C |
| 2.75 | 1.30e-03 | 4.20e-04 | 2.25e-04 | 7.91e-06 | 0 | 3.34e-04 | 1.20e-04 |
| 3.25 | 3.78e-04 | 6.81e-05 | 8.09e-06 | 1.37e-06 | 0 | 5.79e-05 | 3.48e-05 |
| 3.75 | 1.37e-04 | 2.15e-05 | 3.53e-06 | 4.03e-07 | 0 | 1.70e-05 | 1.26e-05 |
| 4.25 | 5.49e-05 | 8.20e-06 | 1.81e-06 | 1.47e-07 | 0 | 6.20e-06 | 5.05e-06 |
| 4.75 | 2.22e-05 | 3.34e-06 | 1.03e-06 | 5.76e-08 | 0 | 2.43e-06 | 2.04e-06 |
| 5.25 | 1.08e-05 | 1.70e-06 | 6.82e-07 | 2.83e-08 | 0 | 1.20e-06 | 9.90e-07 |
| 5.75 | 5.66e-06 | 9.36e-07 | 4.39e-07 | 1.52e-08 | 0 | 6.42e-07 | 5.21e-07 |
| 6.5 | 2.02e-06 | 3.47e-07 | 1.75e-07 | 5.58e-09 | 0 | 2.36e-07 | 1.86e-07 |
| 7.5 | 6.99e-07 | 1.40e-07 | 9.14e-08 | 2.00e-09 | 0 | 8.45e-08 | 6.43e-08 |
| 8.5 | 1.81e-07 | 4.92e-08 | 4.04e-08 | 5.35e-10 | 0 | 2.26e-08 | 1.67e-08 |
| 9.5 | 1.02e-07 | 3.22e-08 | 2.80e-08 | 3.08e-10 | 0 | 1.30e-08 | 9.34e-09 |
| 11 | 2.21e-08 | 9.24e-09 | 8.52e-09 | 1.35e-10 | 0 | 2.94e-09 | 2.03e-09 |
| 3.0 | 7.5e-04 | 2.4e-04 | 1.3e-04 | 2.1e-04 | 1.1e-04 | 1.6e-04 | 8.5e-05 |
| 4.0 | 8.1e-05 | 2.5e-05 | 1.4e-05 | 2.1e-05 | 1.3e-05 | 1.4e-05 | 9.1e-06 |
| 5.0 | 2.0e-05 | 6.6e-06 | 3.3e-06 | 5.8e-06 | 4.5e-06 | 2.9e-06 | 2.3e-06 |
| 6.0 | 5.8e-06 | 1.7e-06 | 1.1e-06 | 1.4e-06 | 9.5e-07 | 7.2e-07 | 6.5e-07 |
| 7.0 | 1.0e-06 | 5.0e-07 | 3.9e-07 | 3.2e-07 | 2.6e-07 | 1.3e-07 | 1.2e-07 |
| 8.0 | 4.5e-07 | 2.7e-07 | 2.1e-07 | 1.6e-07 | 1.5e-07 | 5.6e-08 | 5.1e-08 |
| (GeV/) | (mb) | tot. err. | stat. err. | sys. err. | error A | error B | error C |
| 2.25 | 2.06e+00 | 7.49e-01 | 1.30e-01 | 3.37e-04 | 0 | 7.30e-01 | 1.08e-01 |
| 2.75 | 6.25e-01 | 1.09e-01 | 4.06e-02 | 4.41e-05 | 0 | 9.55e-02 | 3.28e-02 |
| 3.25 | 1.58e-01 | 2.40e-02 | 1.48e-02 | 7.84e-06 | 0 | 1.70e-02 | 8.27e-03 |
| 3.75 | 6.72e-02 | 8.21e-03 | 1.86e-03 | 3.31e-06 | 0 | 7.18e-03 | 3.53e-03 |
| 4.25 | 2.57e-02 | 3.18e-03 | 7.56e-04 | 1.28e-06 | 0 | 2.78e-03 | 1.35e-03 |
| 4.75 | 1.06e-02 | 1.34e-03 | 3.64e-04 | 5.39e-07 | 0 | 1.17e-03 | 5.55e-04 |
| 5.25 | 4.38e-03 | 5.65e-04 | 1.96e-04 | 2.20e-07 | 0 | 4.77e-04 | 2.30e-04 |
| 5.75 | 2.30e-03 | 3.08e-04 | 1.22e-04 | 1.18e-07 | 0 | 2.56e-04 | 1.21e-04 |
| 6.5 | 9.20e-04 | 1.27e-04 | 5.11e-05 | 4.86e-08 | 0 | 1.05e-04 | 4.83e-05 |
| 7.5 | 2.47e-04 | 4.39e-05 | 3.00e-05 | 1.35e-08 | 0 | 2.93e-05 | 1.30e-05 |
| 8.5 | 9.17e-05 | 1.89e-05 | 1.44e-05 | 5.18e-09 | 0 | 1.12e-05 | 4.82e-06 |
| 9.5 | 4.56e-05 | 9.14e-06 | 6.69e-06 | 2.65e-09 | 0 | 5.75e-06 | 2.40e-06 |
| 11 | 1.31e-05 | 2.88e-06 | 2.21e-06 | 7.92e-10 | 0 | 1.72e-06 | 6.88e-07 |
| 5.0 | 1.1e-02 | 7.6e-03 | 5.7e-03 | 5.1e-03 | 3.7e-03 | 3.2e-03 | 9.9e-04 |
| 6.0 | 2.7e-03 | 1.6e-03 | 1.2e-03 | 1.0e-03 | 6.9e-04 | 7.3e-04 | 2.4e-04 |
| 7.0 | 5.8e-04 | 4.4e-04 | 3.9e-04 | 1.9e-04 | 1.3e-04 | 1.3e-04 | 5.1e-05 |
| 8.0 | 2.4e-04 | 1.4e-04 | 1.1e-04 | 8.4e-05 | 6.1e-05 | 5.4e-05 | 2.1e-05 |
| Centrality | (GeV/) | inv. yield | tot. err. | stat. err. | sys. err. | error A | error B | error C |
|---|---|---|---|---|---|---|---|---|
| 2.25 | 1.59e-03 | 5.96e-04 | 1.85e-04 | 5.67e-04 | 0 | 5.67e-04 | 0 | |
| 2.75 | 5.46e-04 | 1.02e-04 | 5.65e-05 | 8.49e-05 | 0 | 8.49e-05 | 0 | |
| 3.25 | 1.27e-04 | 2.49e-05 | 2.05e-05 | 1.42e-05 | 0 | 1.42e-05 | 0 | |
| 3.75 | 5.84e-05 | 6.89e-06 | 2.43e-06 | 6.45e-06 | 0 | 6.45e-06 | 0 | |
| 4.25 | 2.22e-05 | 2.66e-06 | 9.62e-07 | 2.48e-06 | 0 | 2.48e-06 | 0 | |
| 4.75 | 9.26e-06 | 1.15e-06 | 4.61e-07 | 1.06e-06 | 0 | 1.06e-06 | 0 | |
| 5.25 | 3.85e-06 | 4.92e-07 | 2.36e-07 | 4.32e-07 | 0 | 4.32e-07 | 0 | |
| 0-20% | 5.75 | 1.97e-06 | 2.70e-07 | 1.47e-07 | 2.26e-07 | 0 | 2.26e-07 | 0 |
| 6.5 | 7.29e-07 | 1.06e-07 | 6.15e-08 | 8.60e-08 | 0 | 8.60e-08 | 0 | |
| 7.5 | 2.26e-07 | 4.57e-08 | 3.64e-08 | 2.76e-08 | 0 | 2.76e-08 | 0 | |
| 8.5 | 5.29e-08 | 1.36e-08 | 1.19e-08 | 6.65e-09 | 0 | 6.65e-09 | 0 | |
| 9.5 | 3.31e-08 | 8.26e-09 | 7.06e-09 | 4.27e-09 | 0 | 4.27e-09 | 0 | |
| 11 | 1.05e-08 | 2.84e-09 | 2.47e-09 | 1.41e-09 | 0 | 1.41e-09 | 0 | |
| 2.25 | 1.18e-03 | 4.38e-04 | 1.37e-04 | 4.16e-04 | 0 | 4.16e-04 | 0 | |
| 2.75 | 4.02e-04 | 7.52e-05 | 4.36e-05 | 6.13e-05 | 0 | 6.13e-05 | 0 | |
| 3.25 | 1.02e-04 | 1.93e-05 | 1.59e-05 | 1.09e-05 | 0 | 1.09e-05 | 0 | |
| 3.75 | 3.92e-05 | 4.60e-06 | 1.90e-06 | 4.18e-06 | 0 | 4.18e-06 | 0 | |
| 4.25 | 1.47e-05 | 1.77e-06 | 7.97e-07 | 1.59e-06 | 0 | 1.59e-06 | 0 | |
| 4.75 | 5.89e-06 | 7.53e-07 | 3.79e-07 | 6.50e-07 | 0 | 6.50e-07 | 0 | |
| 5.25 | 2.99e-06 | 4.01e-07 | 2.35e-07 | 3.25e-07 | 0 | 3.25e-07 | 0 | |
| 20-40% | 5.75 | 1.45e-06 | 2.06e-07 | 1.28e-07 | 1.61e-07 | 0 | 1.61e-07 | 0 |
| 6.5 | 5.44e-07 | 8.24e-08 | 5.41e-08 | 6.22e-08 | 0 | 6.22e-08 | 0 | |
| 7.5 | 1.68e-07 | 3.69e-08 | 3.11e-08 | 1.99e-08 | 0 | 1.99e-08 | 0 | |
| 8.5 | 5.91e-08 | 1.29e-08 | 1.07e-08 | 7.23e-09 | 0 | 7.23e-09 | 0 | |
| 9.5 | 1.92e-08 | 7.74e-09 | 7.35e-09 | 2.42e-09 | 0 | 2.42e-09 | 0 | |
| 11 | 1.19e-08 | 2.90e-09 | 2.45e-09 | 1.55e-09 | 0 | 1.55e-09 | 0 | |
| 2.25 | 9.14e-04 | 3.40e-04 | 1.03e-04 | 3.24e-04 | 0 | 3.24e-04 | 0 | |
| 2.75 | 1.85e-04 | 4.31e-05 | 3.25e-05 | 2.83e-05 | 0 | 2.83e-05 | 0 | |
| 3.25 | 7.17e-05 | 1.47e-05 | 1.25e-05 | 7.73e-06 | 0 | 7.73e-06 | 0 | |
| 3.75 | 2.46e-05 | 3.01e-06 | 1.47e-06 | 2.62e-06 | 0 | 2.62e-06 | 0 | |
| 4.25 | 9.73e-06 | 1.22e-06 | 6.23e-07 | 1.05e-06 | 0 | 1.05e-06 | 0 | |
| 4.75 | 4.19e-06 | 5.67e-07 | 3.27e-07 | 4.63e-07 | 0 | 4.63e-07 | 0 | |
| 5.25 | 1.71e-06 | 2.69e-07 | 1.95e-07 | 1.85e-07 | 0 | 1.85e-07 | 0 | |
| 40-60% | 5.75 | 9.73e-07 | 1.71e-07 | 1.33e-07 | 1.08e-07 | 0 | 1.08e-07 | 0 |
| 6.5 | 3.84e-07 | 6.14e-08 | 4.29e-08 | 4.39e-08 | 0 | 4.39e-08 | 0 | |
| 7.5 | 1.07e-07 | 3.14e-08 | 2.87e-08 | 1.27e-08 | 0 | 1.27e-08 | 0 | |
| 8.5 | 3.69e-08 | 1.15e-08 | 1.06e-08 | 4.52e-09 | 0 | 4.52e-09 | 0 | |
| 9.5 | 1.41e-08 | 6.31e-09 | 6.06e-09 | 1.77e-09 | 0 | 1.77e-09 | 0 | |
| 11 | 2.56e-09 | 2.11e-09 | 2.09e-09 | 3.35e-10 | 0 | 3.35e-10 | 0 | |
| 2.25 | 4.07e-04 | 1.54e-04 | 5.17e-05 | 1.45e-04 | 0 | 1.45e-04 | 0 | |
| 2.75 | 1.27e-04 | 2.64e-05 | 1.75e-05 | 1.97e-05 | 0 | 1.97e-05 | 0 | |
| 3.25 | 3.52e-05 | 7.72e-06 | 6.66e-06 | 3.90e-06 | 0 | 3.90e-06 | 0 | |
| 3.75 | 1.11e-05 | 1.45e-06 | 7.84e-07 | 1.22e-06 | 0 | 1.22e-06 | 0 | |
| 4.25 | 4.55e-06 | 6.09e-07 | 3.40e-07 | 5.06e-07 | 0 | 5.06e-07 | 0 | |
| 4.75 | 1.88e-06 | 2.71e-07 | 1.68e-07 | 2.13e-07 | 0 | 2.13e-07 | 0 | |
| 60-88% | 5.25 | 6.34e-07 | 1.21e-07 | 9.76e-08 | 7.10e-08 | 0 | 7.10e-08 | 0 |
| 5.75 | 4.65e-07 | 8.14e-08 | 6.17e-08 | 5.31e-08 | 0 | 5.31e-08 | 0 | |
| 6.5 | 2.27e-07 | 4.27e-08 | 3.34e-08 | 2.66e-08 | 0 | 2.66e-08 | 0 | |
| 7.5 | 4.83e-08 | 1.17e-08 | 1.01e-08 | 5.87e-09 | 0 | 5.87e-09 | 0 | |
| 8.5 | 1.18e-08 | 6.61e-09 | 6.44e-09 | 1.48e-09 | 0 | 1.48e-09 | 0 | |
| 9.5 | 6.33e-09 | 3.76e-09 | 3.67e-09 | 8.15e-10 | 0 | 8.15e-10 | 0 |
| Centrality | (GeV/) | inv. yield | tot. err. | sys. err. | stat. err. + error A | error B | error C |
| 2.25 | 1.26e-02 | 3.66e-03 | 1.84e-03 | 3.16e-03 | 1.48e-03 | 0 | |
| 2.75 | 3.90e-03 | 1.12e-03 | 5.78e-04 | 9.61e-04 | 4.66e-04 | 0 | |
| 3.25 | 8.79e-04 | 1.70e-04 | 1.32e-04 | 1.08e-04 | 1.07e-04 | 0 | |
| 3.75 | 2.33e-04 | 5.13e-05 | 3.53e-05 | 3.72e-05 | 2.88e-05 | 0 | |
| 0-92% | 4.50 | 6.44e-05 | 1.60e-05 | 9.97e-06 | 1.25e-05 | 8.22e-06 | 0 |
| (MB) | 5.50 | 1.14e-05 | 2.57e-06 | 1.82e-06 | 1.81e-06 | 1.52e-06 | 0 |
| 6.50 | 2.80e-06 | 1.05e-06 | 4.59e-07 | 9.48e-07 | 3.87e-07 | 0 | |
| 7.50 | 9.60e-07 | 2.63e-07 | 1.62e-07 | 2.07e-07 | 1.38e-07 | 0 | |
| 8.50 | 4.09e-07 | 1.84e-07 | 7.07e-08 | 1.70e-07 | 6.09e-08 | 0 | |
| 9.50 | 1.51e-07 | 8.25e-08 | 2.67e-08 | 7.81e-08 | 2.32e-08 | 0 | |
| 2.25 | 3.95e-02 | 1.24e-02 | 5.80e-03 | 1.09e-02 | 4.65e-03 | 0 | |
| 2.75 | 1.29e-02 | 3.86e-03 | 1.91e-03 | 3.36e-03 | 1.54e-03 | 0 | |
| 3.25 | 2.23e-03 | 5.99e-04 | 3.34e-04 | 4.97e-04 | 2.71e-04 | 0 | |
| 3.75 | 4.53e-04 | 2.07e-04 | 6.88e-05 | 1.95e-04 | 5.61e-05 | 0 | |
| 4.50 | 1.49e-04 | 4.55e-05 | 2.30e-05 | 3.93e-05 | 1.90e-05 | 0 | |
| 0-20% | 5.50 | 2.74e-05 | 8.33e-06 | 4.37e-06 | 7.09e-06 | 3.65e-06 | 0 |
| 6.50 | 5.99e-06 | 2.73e-06 | 9.83e-07 | 2.55e-06 | 8.30e-07 | 0 | |
| 7.50 | 2.79e-06 | 6.99e-07 | 4.71e-07 | 5.17e-07 | 4.02e-07 | 0 | |
| 8.50 | 8.42e-07 | 4.02e-07 | 1.46e-07 | 3.75e-07 | 1.25e-07 | 0 | |
| 9.50 | 4.18e-07 | 2.18e-07 | 7.40e-08 | 2.05e-07 | 6.43e-08 | 0 | |
| 2.25 | 1.21e-02 | 3.51e-03 | 1.78e-03 | 3.03e-03 | 1.42e-03 | 0 | |
| 2.75 | 2.88e-03 | 8.52e-04 | 4.26e-04 | 7.38e-04 | 3.43e-04 | 0 | |
| 3.25 | 8.58e-04 | 1.66e-04 | 1.29e-04 | 1.06e-04 | 1.04e-04 | 0 | |
| 3.75 | 2.54e-04 | 5.40e-05 | 3.85e-05 | 3.78e-05 | 3.14e-05 | 0 | |
| 4.50 | 7.05e-05 | 1.74e-05 | 1.09e-05 | 1.36e-05 | 8.99e-06 | 0 | |
| 20-40% | 5.50 | 1.57e-05 | 3.36e-06 | 2.51e-06 | 2.24e-06 | 2.09e-06 | 0 |
| 6.50 | 3.30e-06 | 1.28e-06 | 5.42e-07 | 1.16e-06 | 4.58e-07 | 0 | |
| 7.50 | 1.06e-06 | 2.65e-07 | 1.79e-07 | 1.96e-07 | 1.53e-07 | 0 | |
| 8.50 | 3.46e-07 | 1.60e-07 | 5.99e-08 | 1.48e-07 | 5.16e-08 | 0 | |
| 9.50 | 1.54e-07 | 7.97e-08 | 2.72e-08 | 7.49e-08 | 2.36e-08 | 0 | |
| 2.25 | 1.06e-03 | 3.27e-04 | 2.41e-04 | 2.21e-04 | 2.22e-04 | 0 | |
| 2.75 | 3.34e-04 | 1.02e-04 | 7.61e-05 | 6.83e-05 | 7.03e-05 | 0 | |
| 3.25 | 1.11e-04 | 2.34e-05 | 1.66e-05 | 1.65e-05 | 1.34e-05 | 0 | |
| 60-92% | 3.75 | 4.04e-05 | 9.05e-06 | 6.13e-06 | 6.66e-06 | 5.00e-06 | 0 |
| 4.50 | 1.16e-05 | 3.11e-06 | 1.80e-06 | 2.54e-06 | 1.48e-06 | 0 | |
| 5.50 | 1.67e-06 | 1.07e-06 | 2.65e-07 | 1.04e-06 | 2.22e-07 | 0 |
| Centrality | (GeV/) | tot. err. | stat. err. + error A | error B | error C | |
|---|---|---|---|---|---|---|
| 2.75 | 1.22 | 0.435 | 0.224 | 0.340 | 0.134 | |
| 3.25 | 1.06 | 0.233 | 0.102 | 0.162 | 0.117 | |
| 3.75 | 1.24 | 0.220 | 0.047 | 0.148 | 0.137 | |
| 4.25 | 1.19 | 0.201 | 0.052 | 0.125 | 0.131 | |
| 4.75 | 1.21 | 0.205 | 0.070 | 0.119 | 0.133 | |
| 5.25 | 1.03 | 0.183 | 0.080 | 0.102 | 0.114 | |
| 0-88% | 5.75 | 1.03 | 0.191 | 0.097 | 0.102 | 0.114 |
| (MB) | 6.5 | 1.16 | 0.220 | 0.119 | 0.115 | 0.128 |
| 7.5 | 0.896 | 0.215 | 0.160 | 0.089 | 0.099 | |
| 8.5 | 1.28 | 0.406 | 0.350 | 0.128 | 0.142 | |
| 9.5 | 1.14 | 0.400 | 0.356 | 0.114 | 0.126 | |
| 11 | 1.51 | 0.680 | 0.635 | 0.151 | 0.166 | |
| 2.75 | 1.15 | 0.421 | 0.231 | 0.322 | 0.130 | |
| 3.25 | 0.922 | 0.236 | 0.150 | 0.141 | 0.104 | |
| 3.75 | 1.17 | 0.210 | 0.057 | 0.140 | 0.132 | |
| 4.25 | 1.11 | 0.191 | 0.060 | 0.116 | 0.126 | |
| 4.75 | 1.15 | 0.198 | 0.078 | 0.113 | 0.130 | |
| 5.25 | 0.982 | 0.179 | 0.087 | 0.097 | 0.111 | |
| 0-20% | 5.75 | 0.956 | 0.184 | 0.103 | 0.094 | 0.108 |
| 6.5 | 0.992 | 0.199 | 0.120 | 0.098 | 0.112 | |
| 7.5 | 0.887 | 0.232 | 0.184 | 0.088 | 0.101 | |
| 8.5 | 0.802 | 0.285 | 0.254 | 0.080 | 0.091 | |
| 9.5 | 0.894 | 0.343 | 0.312 | 0.089 | 0.101 | |
| 11 | 1.30 | 0.626 | 0.590 | 0.131 | 0.148 | |
| 2.75 | 1.22 | 0.450 | 0.249 | 0.342 | 0.139 | |
| 3.25 | 1.07 | 0.270 | 0.169 | 0.163 | 0.121 | |
| 3.75 | 1.14 | 0.206 | 0.062 | 0.136 | 0.129 | |
| 4.25 | 1.06 | 0.186 | 0.067 | 0.111 | 0.120 | |
| 4.75 | 1.05 | 0.188 | 0.084 | 0.104 | 0.120 | |
| 5.25 | 1.10 | 0.208 | 0.112 | 0.109 | 0.125 | |
| 19-40% | 5.75 | 1.02 | 0.201 | 0.120 | 0.100 | 0.116 |
| 6.5 | 1.07 | 0.222 | 0.141 | 0.106 | 0.121 | |
| 7.5 | 0.953 | 0.264 | 0.216 | 0.095 | 0.108 | |
| 8.5 | 1.30 | 0.425 | 0.371 | 0.129 | 0.147 | |
| 9.5 | 0.750 | 0.374 | 0.354 | 0.075 | 0.085 | |
| 11 | 2.13 | 0.995 | 0.934 | 0.214 | 0.242 | |
| 2.75 | 0.86 | 0.338 | 0.212 | 0.241 | 0.102 | |
| 3.25 | 1.15 | 0.305 | 0.202 | 0.176 | 0.136 | |
| 3.75 | 1.09 | 0.201 | 0.071 | 0.130 | 0.128 | |
| 4.25 | 1.08 | 0.192 | 0.078 | 0.113 | 0.127 | |
| 4.75 | 1.14 | 0.210 | 0.104 | 0.113 | 0.135 | |
| 40-60% | 5.25 | 0.962 | 0.198 | 0.126 | 0.095 | 0.114 |
| 5.75 | 1.04 | 0.234 | 0.164 | 0.103 | 0.123 | |
| 6.5 | 1.15 | 0.246 | 0.163 | 0.114 | 0.136 | |
| 7.5 | 0.929 | 0.314 | 0.277 | 0.092 | 0.110 | |
| 8.5 | 1.24 | 0.490 | 0.449 | 0.123 | 0.146 | |
| 9.5 | 0.842 | 0.451 | 0.430 | 0.084 | 0.099 | |
| 11 | 0.704 | 0.645 | 0.636 | 0.071 | 0.083 | |
| 2.75 | 1.36 | 0.515 | 0.301 | 0.381 | 0.165 | |
| 3.25 | 1.30 | 0.358 | 0.248 | 0.200 | 0.158 | |
| 3.75 | 1.13 | 0.213 | 0.085 | 0.135 | 0.137 | |
| 4.25 | 1.16 | 0.212 | 0.095 | 0.122 | 0.141 | |
| 4.75 | 1.18 | 0.223 | 0.119 | 0.117 | 0.143 | |
| 60-88% | 5.25 | 0.826 | 0.190 | 0.138 | 0.081 | 0.010 |
| 5.75 | 1.15 | 0.255 | 0.177 | 0.114 | 0.140 | |
| 6.5 | 1.57 | 0.368 | 0.269 | 0.156 | 0.191 | |
| 7.5 | 0.969 | 0.285 | 0.239 | 0.096 | 0.117 | |
| 8.5 | 0.913 | 0.558 | 0.538 | 0.091 | 0.111 | |
| 9.5 | 0.874 | 0.578 | 0.561 | 0.087 | 0.106 |
| Centrality | (GeV/) | tot. err. | error C | |
|---|---|---|---|---|
| 2.75 | 0.532 | 0.227 (42.6%) | 0.036 (6.8%) | |
| 3.25 | 0.318 | 0.096 (30.2%) | 0.022 (6.8%) | |
| 3.75 | 0.178 | 0.084 (46.9%) | 0.012 (6.8%) | |
| 4.50 | 0.234 | 0.074 (31.7%) | 0.016 (6.8%) | |
| 5.50 | 0.199 | 0.063 (31.6%) | 0.014 (6.8%) | |
| 0-20% | 6.50 | 0.160 | 0.075 (46.9%) | 0.011 (6.8%) |
| 7.50 | 0.215 | 0.062 (28.9%) | 0.015 (6.8%) | |
| 8.50 | 0.250 | 0.133 (53.0%) | 0.017 (6.8%) | |
| 9.50 | 0.222 | 0.131 (59.3%) | 0.015 (6.8%) | |
| 2.75 | 0.479 | 0.202 (42.3%) | 0.037 (7.8%) | |
| 3.25 | 0.492 | 0.117 (23.8%) | 0.038 (7.8%) | |
| 3.75 | 0.401 | 0.095 (23.6%) | 0.031 (7.8%) | |
| 4.50 | 0.446 | 0.116 (26.0%) | 0.035 (7.8%) | |
| 5.50 | 0.460 | 0.106 (23.1%) | 0.036 (7.8%) | |
| 20-60% | 6.50 | 0.355 | 0.143 (40.3%) | 0.028 (7.8%) |
| 7.50 | 0.329 | 0.095 (28.9%) | 0.026 (7.8%) | |
| 8.50 | 0.414 | 0.214 (51.6%) | 0.032 (7.8%) | |
| 9.50 | 0.328 | 0.193 (58.9%) | 0.026 (7.8%) | |
| 2.75 | 0.733 | 0.315 (43.0%) | 0.209 (28.6%) | |
| 3.25 | 0.837 | 0.211 (25.3%) | 0.239 (28.6%) | |
| 60-92% | 3.75 | 0.841 | 0.208 (24.7%) | 0.240 (28.6%) |
| 4.50 | 0.967 | 0.271 (28.0%) | 0.276 (28.6%) | |
| 5.50 | 0.641 | 0.415 (64.8%) | 0.183 (28.6%) |
| (GeV/) | tot. err. | stat. err. | error A | error B | error C | |
|---|---|---|---|---|---|---|
| 2.75 | 0.440 | 0.131 | 0.076 | 0 | 0.107 | 0 |
| 3.25 | 0.421 | 0.041 | 0.009 | 0 | 0.040 | 0 |
| 3.75 | 0.446 | 0.032 | 0.012 | 0 | 0.030 | 0 |
| 4.25 | 0.473 | 0.035 | 0.016 | 0 | 0.031 | 0 |
| 4.75 | 0.468 | 0.036 | 0.022 | 0 | 0.029 | 0 |
| 5.25 | 0.510 | 0.045 | 0.032 | 0 | 0.031 | 0 |
| 5.75 | 0.561 | 0.055 | 0.044 | 0 | 0.034 | 0 |
| 6.5 | 0.540 | 0.057 | 0.047 | 0 | 0.033 | 0 |
| 7.5 | 0.596 | 0.086 | 0.078 | 0 | 0.037 | 0 |
| 8.5 | 0.426 | 0.099 | 0.095 | 0 | 0.027 | 0 |
| 9.5 | 0.588 | 0.166 | 0.162 | 0 | 0.039 | 0 |
| 11 | 0.419 | 0.164 | 0.162 | 0 | 0.029 | 0 |
| Centrality | (GeV/) | tot. err. | stat. err. + error A | error B | error C | |
|---|---|---|---|---|---|---|
| 2.25 | 0.420 | 0.038 | 0.028 | 0.025 | 0 | |
| 2.75 | 0.472 | 0.044 | 0.033 | 0.028 | 0 | |
| 3.25 | 0.383 | 0.045 | 0.039 | 0.023 | 0 | |
| 3.75 | 0.472 | 0.034 | 0.018 | 0.028 | 0 | |
| 4.25 | 0.478 | 0.033 | 0.017 | 0.029 | 0 | |
| 4.75 | 0.483 | 0.035 | 0.020 | 0.029 | 0 | |
| 0-88% | 5.25 | 0.465 | 0.037 | 0.025 | 0.028 | 0 |
| (MB) | 5.75 | 0.510 | 0.043 | 0.030 | 0.031 | 0 |
| 6.5 | 0.552 | 0.048 | 0.034 | 0.033 | 0 | |
| 7.5 | 0.478 | 0.070 | 0.064 | 0.029 | 0 | |
| 8.5 | 0.499 | 0.092 | 0.087 | 0.030 | 0 | |
| 9.5 | 0.677 | 0.118 | 0.111 | 0.041 | 0 | |
| 11 | 0.609 | 0.124 | 0.119 | 0.037 | 0 | |
| 2.25 | 0.386 | 0.052 | 0.047 | 0.023 | 0 | |
| 2.75 | 0.491 | 0.062 | 0.054 | 0.029 | 0 | |
| 3.25 | 0.364 | 0.066 | 0.063 | 0.022 | 0 | |
| 3.75 | 0.494 | 0.041 | 0.028 | 0.030 | 0 | |
| 4.25 | 0.512 | 0.040 | 0.026 | 0.031 | 0 | |
| 4.75 | 0.520 | 0.043 | 0.030 | 0.031 | 0 | |
| 5.25 | 0.508 | 0.048 | 0.037 | 0.030 | 0 | |
| 0-20% | 5.75 | 0.547 | 0.056 | 0.045 | 0.033 | 0 |
| 6.5 | 0.563 | 0.063 | 0.053 | 0.034 | 0 | |
| 7.5 | 0.579 | 0.109 | 0.104 | 0.035 | 0 | |
| 8.5 | 0.363 | 0.094 | 0.091 | 0.022 | 0 | |
| 9.5 | 0.644 | 0.159 | 0.154 | 0.039 | 0 | |
| 11 | 0.684 | 0.193 | 0.188 | 0.041 | 0 | |
| 2.25 | 0.416 | 0.057 | 0.051 | 0.025 | 0 | |
| 2.75 | 0.517 | 0.068 | 0.060 | 0.031 | 0 | |
| 3.25 | 0.425 | 0.077 | 0.072 | 0.025 | 0 | |
| 3.75 | 0.467 | 0.042 | 0.031 | 0.028 | 0 | |
| 4.25 | 0.470 | 0.041 | 0.029 | 0.028 | 0 | |
| 4.75 | 0.447 | 0.043 | 0.033 | 0.027 | 0 | |
| 20-40% | 5.25 | 0.524 | 0.057 | 0.048 | 0.031 | 0 |
| 5.75 | 0.539 | 0.062 | 0.053 | 0.032 | 0 | |
| 6.5 | 0.543 | 0.069 | 0.060 | 0.033 | 0 | |
| 7.5 | 0.545 | 0.119 | 0.114 | 0.033 | 0 | |
| 8.5 | 0.546 | 0.119 | 0.115 | 0.033 | 0 | |
| 9.5 | 0.495 | 0.206 | 0.204 | 0.030 | 0 | |
| 11 | 1.046 | 0.277 | 0.269 | 0.063 | 0 | |
| 2.25 | 0.489 | 0.065 | 0.058 | 0.029 | 0 | |
| 2.75 | 0.372 | 0.072 | 0.069 | 0.022 | 0 | |
| 3.25 | 0.457 | 0.091 | 0.086 | 0.027 | 0 | |
| 3.75 | 0.439 | 0.044 | 0.035 | 0.026 | 0 | |
| 4.25 | 0.456 | 0.043 | 0.033 | 0.027 | 0 | |
| 4.75 | 0.490 | 0.053 | 0.044 | 0.029 | 0 | |
| 40-60% | 5.25 | 0.466 | 0.066 | 0.060 | 0.028 | 0 |
| 5.75 | 0.547 | 0.088 | 0.082 | 0.033 | 0 | |
| 6.5 | 0.560 | 0.078 | 0.070 | 0.034 | 0 | |
| 7.5 | 0.528 | 0.160 | 0.157 | 0.032 | 0 | |
| 8.5 | 0.598 | 0.200 | 0.197 | 0.036 | 0 | |
| 9.5 | 0.495 | 0.234 | 0.232 | 0.030 | 0 | |
| 11 | 0.243 | 0.211 | 0.210 | 0.015 | 0 | |
| 2.25 | 0.474 | 0.070 | 0.064 | 0.028 | 0 | |
| 2.75 | 0.558 | 0.090 | 0.083 | 0.033 | 0 | |
| 3.25 | 0.500 | 0.105 | 0.101 | 0.030 | 0 | |
| 3.75 | 0.482 | 0.051 | 0.042 | 0.029 | 0 | |
| 4.25 | 0.490 | 0.051 | 0.042 | 0.029 | 0 | |
| 4.75 | 0.514 | 0.062 | 0.053 | 0.031 | 0 | |
| 60-88 % | 5.25 | 0.374 | 0.068 | 0.064 | 0.022 | 0 |
| 5.75 | 0.569 | 0.090 | 0.083 | 0.034 | 0 | |
| 6.5 | 0.734 | 0.129 | 0.121 | 0.044 | 0 | |
| 7.5 | 0.501 | 0.123 | 0.119 | 0.030 | 0 | |
| 8.5 | 0.362 | 0.216 | 0.215 | 0.022 | 0 | |
| 9.5 | 0.469 | 0.294 | 0.293 | 0.028 | 0 |
| Centrality | (GeV/) | tot. err. | |
| 2.25 | 0.320 | 0.090 (28.1%) | |
| 2.75 | 0.410 | 0.120 (29.3%) | |
| 3.25 | 0.340 | 0.060 (17.6%) | |
| 3.75 | 0.290 | 0.058 (20.0%) | |
| 0-92% | 4.50 | 0.350 | 0.083 (23.7%) |
| (MB) | 5.50 | 0.350 | 0.072 (20.6%) |
| 6.50 | 0.350 | 0.130 (37.1%) | |
| 7.50 | 0.560 | 0.100 (17.9%) | |
| 8.50 | 0.480 | 0.210 (43.8%) | |
| 9.50 | 0.490 | 0.250 (51.0%) | |
| 2.25 | 0.400 | 0.120 (30.0%) | |
| 2.75 | 0.550 | 0.170 (30.9%) | |
| 3.25 | 0.370 | 0.110 (29.7%) | |
| 3.75 | 0.240 | 0.110 (45.8%) | |
| 4.50 | 0.360 | 0.110 (30.6%) | |
| 0-20% | 5.50 | 0.380 | 0.110 (28.9%) |
| 6.50 | 0.350 | 0.160 (45.7%) | |
| 7.50 | 0.530 | 0.130 (24.5%) | |
| 8.50 | 0.470 | 0.240 (51.1%) | |
| 9.50 | 0.490 | 0.280 (57.1%) | |
| 2.25 | 0.360 | 0.100 (27.8%) | |
| 2.75 | 0.340 | 0.100 (29.4%) | |
| 3.25 | 0.370 | 0.070 (18.9%) | |
| 3.75 | 0.340 | 0.066 (19.4%) | |
| 4.50 | 0.410 | 0.096 (23.4%) | |
| 20-60% | 5.50 | 0.490 | 0.096 (19.6%) |
| 6.50 | 0.420 | 0.160 (38.1%) | |
| 7.50 | 0.430 | 0.098 (22.8%) | |
| 8.50 | 0.380 | 0.170 (44.7%) | |
| 9.50 | 0.400 | 0.200 (50.0%) | |
| 2.25 | 0.312 | 0.094 (30.1%) | |
| 2.75 | 0.383 | 0.110 (28.7%) | |
| 3.25 | 0.404 | 0.081 (20.0%) | |
| 60-92% | 3.75 | 0.438 | 0.093 (21.2%) |
| 4.50 | 0.542 | 0.139 (25.6%) | |
| 5.50 | 0.404 | 0.257 (63.6%) |
References
- (1) See, e.g., G. Sterman et al. [CTEQ Collaboration], Rev. Mod. Phys. 67, 157 (1995).
- (2) W. M. Geist, D. Drijard, A. Putzer, R. Sosnowski and D. Wegener, Phys. Rept. 197, 263 (1990).
- (3) G. Bunce, N. Saito, J. Soffer and W. Vogelsang, Ann. Rev. Nucl. Part. Sci. 50, 525 (2000).
- (4) M. Arneodo, Phys. Rep. 240, 301 (1994);
- (5) N. Armesto, J. Phys. G 32, R367 (2006), hep-ph/0604108.
- (6) J.W. Cronin et al., Phys. Rev. D 11, 3105 (1975); D. Antreasyan et al., Phys. Rev. D 19, 764 (1979).
- (7) See e.g. E. Iancu and R. Venugopalan, in QGP III, Eds. R.C. Hwa and X.N. Wang, World Scientific; hep-ph/0303204.
- (8) B. Z. Kopeliovich, J. Nemchik, E. Predazzi and A. Hayashigaki, Nucl. Phys. A 740, 211 (2004).
- (9) R. C. Hwa and C. B. Yang, Phys. Rev. C 70, 024905 (2004).
- (10) M. Gyulassy and M. Plümer, Phys. Lett. B 243, 432 (1990); X.N. Wang, M. Gyulassy, Phys. Rev. Lett. 68, 1480 (1992).
- (11) R. Baier, Y. L. Dokshitzer, A. H. Mueller, S. Peigné and D. Schiff, Nucl. Phys. B 484, 265 (1997); R. Baier, D. Schiff, B.G. Zakharov, Ann. Rev. Nucl. Part. Sci. 50, 37 (2000).
- (12) M. Gyulassy, P. Lévai and I. Vitev, Phys. Rev. Lett. 85, 5535 (2000); Nucl. Phys. B 594, 371 (2001).
- (13) U. A. Wiedemann, Nucl. Phys. B 588, 30 (2000); C. A. Salgado and U. A. Wiedemann, Phys. Rev. D 68, 014008 (2003).
- (14) S. S. Adler et al. [PHENIX Collaboration] Phys. Rev. Lett. 91, 241803 (2003).
- (15) S. S. Adler et al. [PHENIX Collaboration], Phys. Rev. Lett. 93, 202002 (2004); Phys. Rev. Lett. 95, 202001 (2005)
- (16) S. S. Adler et al. [PHENIX Collaboration], Phys. Rev. Lett. 91, 072303 (2003).
- (17) S. S. Adler et al. [PHENIX Collaboration], nucl-ex/0610036.
- (18) K. Adcox et. al[PHENIX Collaboration], Phys. Rev. Lett. 88, 022301 (2002). nucl-ex/0109003
- (19) S. S. Adler et al. [PHENIX Collaboration], Phys. Rev. Lett. 91, 072301 (2003);
- (20) S. S. Adler et al. [PHENIX Collaboration], Phys. Rev. Lett. 96, 202301 (2006).
- (21) S. S. Adler et al. [PHENIX Collaboration], Phys. Rev. C submitted; nucl-ex/0611xxx (PPG054).
- (22) S. Albino, B. A. Kniehl and G. Kramer, Nucl. Phys. B 725, 181 (2005).
- (23) B. Jäger, A. Schäfer, M. Stratmann and W. Vogelsang, Phys. Rev. D 67, 054005 (2003); B. Jäger, M. Stratmann, S. Kretzer and W. Vogelsang, Phys. Rev. Lett. 92, 121803 (2004); A. Mukherjee, M. Stratmann and W. Vogelsang, Phys. Rev. D 72, 034011 (2005).
- (24) C. Bourrely and J. Soffer, Eur. Phys. J. C 36 (2004) 371.
- (25) M. Anselmino, M. Boglione, U. D’Alesio, E. Leader and F. Murgia, Phys. Rev. D 71, 014002 (2005)
- (26) K. J. Eskola, V. J. Kolhinen and C. A. Salgado, Eur. Phys. J. C 9, 61 (1999).
- (27) D. de Florian and R. Sassot, Phys. Rev. D 69, 074028 (2004).
- (28) B. Z. Kopeliovich, Phys. Rev. C 68, 044906 (2003).
- (29) R. Vogt, Phys. Rev. C 70, 064902 (2004).
- (30) A. Accardi and M. Gyulassy, J. Phys. G 30, S969 (2004); Phys. Lett. B 586, 244 (2004)
- (31) E. Cattaruzza and D. Treleani, Phys. Rev. D 69, 094006 (2004).
- (32) G. G. Barnaföldi, G. Papp, P. Lévai and G. Fai, J. Phys. G 30, S1125 (2004).
- (33) J. L. Albacete, N. Armesto, A. Kovner, C. A. Salgado and U. A. Wiedemann, Phys. Rev. Lett. 92, 082001 (2004).
- (34) E. Iancu, K. Itakura and D. N. Triantafyllopoulos, Nucl. Phys. A 742, 182 (2004)
- (35) J. Jalilian-Marian and Y. V. Kovchegov, Prog. Part. Nucl. Phys. 56, 104 (2006).
- (36) See e.g. D. d’Enterria, Proceeds. “QCD at Work 2005”, AIP Conf. Proc. 806, 252 (2006).
- (37) I. Vitev I and M. Gyulassy, Phys. Rev. Lett. 89, 252301 (2002); and I. Vitev I, J. Phys. G 30, S791 (2004).
- (38) K. J. Eskola, H. Honkanen, C. A. Salgado and U. A. Wiedemann, Nucl. Phys. A 747, 511 (2005).
- (39) A. Dainese, C. Loizides and G. Paic, Eur. Phys. J. C 38, 461 (2005);
- (40) R. C. Hwa and C. B. Yang, Phys. Rev. C 67, 034902 (2003); R. Fries, B. Müller, C. Nonaka and S. A. Bass, Phys. Rev. Lett. 90, 202303 (2003); V. Greco, C. M. Ko, P. Lévai, Phys. Rev. Lett. 90, 202302 (2003).
- (41) S. S. Adler et al. [PHENIX Collaboration], Phys. Rev. C 69, 034910 (2004).
- (42) C. Kourkoumelis et al. [AFS Collaboration],Phys. Lett. B 84, 271 (1979); and Phys. Lett. B 84, 277 (1979).
- (43) F. Abe et al. [CDF Collaboration], Phys. Rev. D 48, 2998 (1993).
- (44) F. Ellinghaus and J. Seele [PHENIX Collaboration], RIKEN Accel. Prog. Rep. 39 (2006)
- (45) J. Adams et al. [STAR Collaboration], Phys. Rev. Lett. 91, 172302 (2003).
- (46) K. Adcox et al. [PHENIX Collaboration], Phys. Rev. Lett. 88 (2002) 192303, S. S. Adler et al. [PHENIX Collaboration], Phys. Rev. C 72, 024901 (2005), S. S. Adler et al. [PHENIX Collaboration], nucl-ex/0510047; A. Adare et al. [PHENIX Collaboration], nucl-ex/0611xxx (PPG066).
- (47) A. Toia [PHENIX Collaboration], Proceeds. QM’05, nucl-ex/0510006.
- (48) S. S. Adler et al., [PHENIX Collaboration], Phys. Rev. Lett. 94, 232301 (2005).
- (49) S. S. Adler et al. [PHENIX Collaboration], Phys. Rev. D 71, 071102 (2005); S. S. Adler et al., [PHENIX Collaboration], submitted to Phys. Rev. Lett. , hep-ex/0609031.
- (50) H. Hahn et al., Nucl. Instrum. Methods A 499, 245 (2003).
- (51) K. Adcox et al. [PHENIX Collaboration], Nucl. Instrum. Methods A 499, (2003) 469.
- (52) L. Aphecetche et al. [PHENIX Collaboration], Nucl. Instrum. Methods A 499, 521 (2003).
- (53) K. Adcox et al., [PHENIX Collaboration], Nucl. Instrum. Methods A 499, 489 (2003).
- (54) K. Adcox et al., Nucl. Instrum. Methods A 497, 263 (2003).
- (55) M. Allen et al. [PHENIX Collaboration], Nucl. Instrum. Methods A 499, 549 (2003).
- (56) C. Adler et al., Nucl. Instrum. Methods A 470, 488 (2001).
- (57) S. Eidelman et al. [Particle Data Group], Phys. Lett. B 592, 1 (2004).
- (58) M. Aizawa et al., Nucl. Instrum. Methods A 499, 508 (2003).
- (59) S. S. Adler et al. [PHENIX Collaboration], Phys. Rev. Lett. 94, 082302 (2005).
- (60) K. Adcox et al. [PHENIX Collaboration], Phys. Rev. Lett. 86, 3500 (2001).
- (61) S. White, AIP Conf. Proc. 792, 527 (2005).
- (62) S. S. Adler et al. [PHENIX Collaboration], Phys. Rev. Lett. 96, 012304 (2006).
- (63) F. Carminati et al., GEANT 3.21: Detector Description and Simulation Tool, CERN Program Library Long Writeup W5013, 1993.
- (64) T. Sjöstrand, Computer Physics Commun. 82 (1994) 74.
- (65) C. Alff et al., Phys. Rev. Lett. 9, 325, (1962)
- (66) J. S. Danburg et al., Phys. Rev. D 2, 2564 (1970);
- (67) S.Giovanella [KLOE Collaboration], hep-ex/0505074.
- (68) G. D. Lafferty and T. R. Wyatt, Nucl. Instrum. Meth. A 355, 541 (1995).
- (69) V. Guzey, M. Strikman and W. Vogelsang, Phys. Lett. B 603, 173 (2004).
- (70) S. S. Adler et al. [PHENIX Collaboration], Phys. Rev. C 73, 054903 (2006).
- (71) L.E. Gordon and W. Vogelsang, Phys. Rev. D 48, 3136 (1993); Phys. Rev. D 50, 1901 (1994); also P. Aurenche et al., Phys. Lett. B 140, 87 (1984); and Nucl. Phys. B 297, 661 (1988).
- (72) T. Sjöstrand, P. Eden, C. Friberg, L. Lonnblad, G. Miu, S. Mrenna and E. Norrbin, Comput. Phys. Commun. 135, 238 (2001).
- (73) D. d’Enterria, J. Phys. G 31, S491 (2005).
- (74) B. Andersson, G. Gustafson, G. Ingelman and T. Sjöstrand, Phys. Rept. 97, 31 (1983).
- (75) B. Andersson, The Lund Model (Cambridge University Press, 1998)
- (76) T. Sjöstrand, L. Lonnblad, S. Mrenna and P. Skands, “PYTHIA 6.3: Physics and manual”, hep-ph/0308153.
- (77) M. Bourquin and J.-M. Gaillard, Nucl. Phys. B 114, 334 (1976).
- (78) PPG045 [PHENIX Collaboration], Phys. Rev. C to be submitted.
- (79) G. J. Donaldson et al., Phys. Rev. Lett. 40, 684 (1978) .
- (80) M. Bonesini et al. [WA70 Collaboration], Z. Phys. C 42, 527 (1989).
- (81) J. Antille et al. [UA6 Collaboration], Phys. Lett. B 194, 568 (1987).
- (82) M. Aguilar-Benitez et al. [NA27 Collaboration], Z. Phys. C 50, 405 (1991).
- (83) E. Amaldi et al., Nucl. Phys. B 158, 1 (1979).
- (84) L. Apanasevich et al. [Fermilab E706 Collaboration], Phys. Rev. D 68, 052001 (2003).
- (85) T. Akesson et al. [AFS Collaboration], Phys. Lett. B 158, 282 (1985).
- (86) T. Akesson et al. [AFS Collaboration], Phys. Lett. B 178, 447 (1986).
- (87) T. Akesson et al. [AFS Collaboration], Z. Phys. C 18, 5 (1983).
- (88) M. Banner et al. [UA2 Collaboration], Z. Phys. C 27, 329 (1985).
- (89) J. Povlis et al. [Fermilab E629 Collaboration], Phys. Rev. Lett. 51, 967 (1983).
- (90) S. W. Delchamps, FERMILAB-THESIS-1985-35
- (91) G. Agakishiev et al. [TAPS/CERES Collaboration], Eur. Phys. J. C 4, 249 (1998).
- (92) V. Tikhomirov [HELIOS Collaboration], HADRON 95, Proceeds. 6th Int. Conf. on Hadron Spectroscopy, Manchester, England, 10-14 Jul 1995 (World. Scientific Publishing, 1995)
- (93) G. Alverson et al. [Fermilab E706 Collaboration], Phys. Rev. D 48, 5 (1993).
- (94) L. Apanasevich et al. [Fermilab E706 Collaboration], Phys. Rev. D 69, 032003 (2004).
- (95) R. Averbeck et al. [TAPS Collaboration], Z. Phys. A 359, 65 (1997).
- (96) R. Averbeck, R. Holzmann, V. Metag and R. S. Simon, Phys. Rev. C 67, 024903 (2003).
- (97) M. M. Aggarwal et al. [WA98 Collaboration], nucl-ex/0006007.
- (98) R. Albrecht et al. [WA80 Collaboration.], Phys. Lett. B 361, 14 (1995).
- (99) R. Hagedorn Riv. Nuovo Cim. 6N10, 1 (1984).
- (100) K. Adcox et al. [PHENIX Collaboration], Nucl. Phys. A 757, 184 (2005)
- (101) R. Witt [STAR Collaboration], nucl-ex/0403021.
- (102) T. Peitzmann, nucl-th/0511022.
- (103) D. Buskulic et al. [ALEPH Collaboration], Phys. Lett. B 292, 210 (1992).
- (104) R. Barate et al. [ALEPH Collaboration], Z. Phys. C 74, 451 (1997).
- (105) R. Barate et al. [ALEPH Collaboration], Phys. Rept. 294, 1 (1998).
- (106) R. Barate et al. [ALEPH Collaboration], Eur. Phys. J. C 16, 613 (2000).
- (107) A. Heister et al. [ALEPH Collaboration], Phys. Lett. B 528, 19 (2002)
- (108) W. Adam et al. [DELPHI Collaboration], Z. Phys. C 69, 561 (1996).
- (109) B. Adeva et al. [L3 Collaboration], Phys. Lett. B 259, 199 (1991).
- (110) O. Adriani et al. [L3 Collaboration], Phys. Lett. B 286, 403 (1992).
- (111) M. Acciarri et al. [L3 Collaboration], Phys. Lett. B 328, 223 (1994).
- (112) K. Ackerstaff et al. [OPAL Collaboration], Eur. Phys. J. C 5, 411 (1998)
- (113) G. Abbiendi et al. [OPAL Collaboration], Eur. Phys. J. C 17, 373 (2000)
- (114) G. Wormser et al., Phys. Rev. Lett. 61, 1057 (1988).
- (115) S. Abachi et al. [HRS Collaboration], Phys. Lett. B 205, 111 (1988).
- (116) W. Bartel et al. [JADE Collaboration], Phys. Lett. B 130, 454 (1983).
- (117) W. Bartel et al. [JADE Collaboration], Z. Phys. C 28, 343 (1985).
- (118) D. Pitzl et al. [JADE Collaboration], Z. Phys. C 46, 1 (1990) [Erratum-ibid. C 47, 676 (1990)].
- (119) H. J. Behrend et al. [CELLO Collaboration], Z. Phys. C 47, 1 (1990).
- (120) C. Peterson and T. F. Walsh, Phys. Lett. B 91, 455 (1980).
- (121) P. Ball, J. M. Frere and M. Tytgat, Phys. Lett. B 365, 367 (1996).
- (122) H. Fritzsch, Phys. Lett. B 415, 83 (1997).
- (123) J. Binnewies, B.A. Kniehl, and G. Kramer, Phys. Rev. D 52, 4947 (1995).
- (124) B. A. Kniehl, G. Kramer and B. Pötter, Nucl. Phys. B 582, 514 (2000)
- (125) S. Kretzer, Phys. Rev. D 62, 054001 (2000).
- (126) L. Bourhis, M. Fontannaz, J. P. Guillet and M. Werlen, Eur. Phys. J. C 19, 89 (2001).
- (127) M. Greco and S. Rolli, Z. Phys. C 60, 169 (1993); M. Greco, S. Rolli and A. Vicini, Z. Phys. C 65, 277 (1995); S. Rolli, hep-ph/9607480.
- (128) D. Indumathi, H. S. Mani and A. Rastogi, Phys. Rev. D 58, 094014 (1998). Note that in the second case, the FF is not explicitly given but, within the framework, could be derived from the FF parameters for other octet mesons.
- (129) S. S. Adler [PHENIX Collaboration], Phys. Rev. D 74, 072002 (2006).
- (130) S. Kretzer, Acta Phys. Polon. B 36, 179 (2005).