Prior to “Quark Matter 2006” predictions within retarded jet absorption scenario at RHIC
Abstract
Predictions for some experimental physical observables in nucleus-nucleus collisions at RHIC energies are presented. I utilize the previous suggestion that the retarded, by time about 2-3 fm/c, jet absorption in opaque core is a natural explanation of many experimental data. This assumption is applied only to the particles with high transverse momentum above 4 GeV/c resulting from parton fragmentation. I calculate nuclear modification factor , in- and out of the reaction plane, azimuthal anisotropy parameter , jet suppression for the away side jet and its dependence versus the reaction plane orientation. The systems under consideration are Au+Au, Cu+Cu, at 200 GeV and 62 GeV. Most of numbers are predictions prior to the QM2006.
pacs:
25.75.DwAt QM2006 conference we expect that many new experimental data will be shown. I already get few requests from different groups to calculate some experimentally observed parameters. To be fair, I present all these numbers prior to the conference.
In previous papers mypaper ; paper2 I propose a simple model to explain experimental data on the angular dependence of the nuclear modification factor at high transverse momentum in the reaction plane. The model has one free parameter 2 fm to describe the the thickness of the corona area with no absorption and was adjusted to fit the experimental data on AuAu collisions at centrality 50-60. The model nicely describes the dependence for all centrality classes. I extract the second Fourier component amplitude, , for high pt particle azimuthal distribution and found should be at the level of 11-12 purely from the geometry of the collision with particle absorption in the core. At that time I made a prediction for in Cu+Cu collisions at 200 GeV which, as later was found, is in very good agreement with experimental data. Physical interpretation of the parameter could be that it is actually retarded jet absorption caused by the plasma formation time 2 fm/c, or at least non-trivial response of strongly interacting plasma to fast moving color charge.
This value of formation time is true for the dilute corona region where density is small. For more central interaction region it should be smaller, probably changing like mean distance between interaction points or , where is two-dimentional (projected into plane) density of or . Extrapolation of in a such way gives values of the order of 0.7-1 fm/c in the center of collision zone.
As usual, nuclear modification factor is defined as:
| (1) |
where is a number of binary nucleon-nucleon collisions at particular centrality class.
I use a Monte Carlo simulation of nucleus-nucleus collisions based on the Glauber approach with Woods-Saxon density distribution. Assume that jets are produced in accordance with the distribution in the transverse plane. I neglect longitudinal expansion for the first 2-3 fm/c. Let all jets fly in all possible directions (some of them will move from the interaction zone determined by the envelop of Woods-Saxon radii, some will go into this zone) for some time . If after that time jet will be still inside the interaction zone, it will be completely absorbed. If not, jet leaves the zone without interaction. We found from experimental data that this time should be about 2.3 fm/c at 200 GeV and 3.5 fm/c at 62 GeV center of mass beam energy. Absorption can not happen instantly (or in the infinitely thin layer), plus there should be statistical fluctuations. To take these into account I smooth the cut edge: an arbitrary weight function in the form of a Fermi distribution with diffuseness parameter was applied:
| (2) |
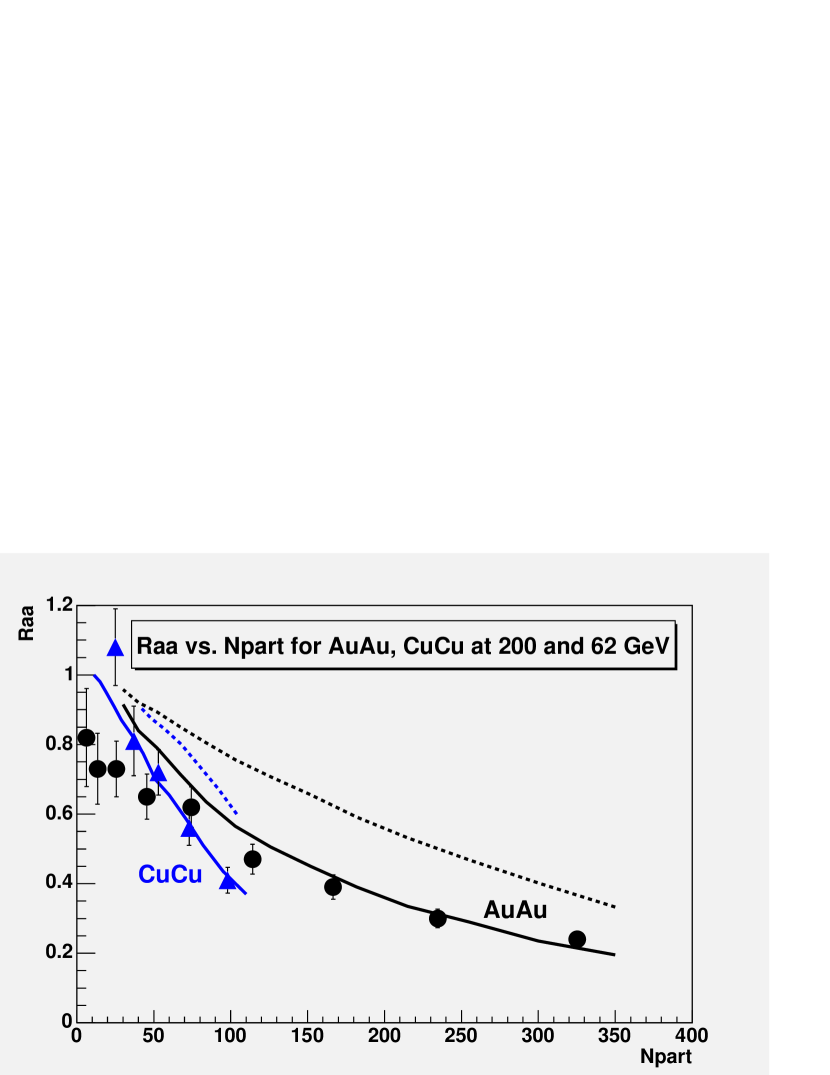
The value of this function changes from 0.1 to 0.9 at l=4.4* around . Parameter varied from 0.01 to 0.5 fm/c. It was found that the results for and do not change much for this parameter range. By default it was chosen to be =0.2 fm/c. The results of calculation for are presented in Fig. 1. All values for and are presented in tables at the bottom of this preprint. It is worth to mention, values of and for mesons and baryons at high should be the same. Obviously, is flat versus if no other physics process is “switched on” at high , except retarded absorption in opaque core considered here.
For di-jets, another parameter, , was introduced in Ref. starIaa . For away side jet is the ratio of particle yield per trigger in the particular momentum range of trigger and associate particles, to the similar yield in p+p collisions. To calculate this value I perform the same procedure like for , except that in addition the location of away side jet after time should be taken into account. Away side jet may not go exactly in opposite relative to the trigger jet direction, but is distributed around 180 degree angle. It introduces another critical parameter for the calculation, which should be taken from the experimentally observed width of the away side jets in azimuthal angle. I use simple Gausse distribution around 180 degrees for the away side jet. Depending on the momentum range of the associate particle, width of the away side jet varies from 0.5 radians for the low momentum range to 0.2 radians at momentum above 5-6 GeV/c.
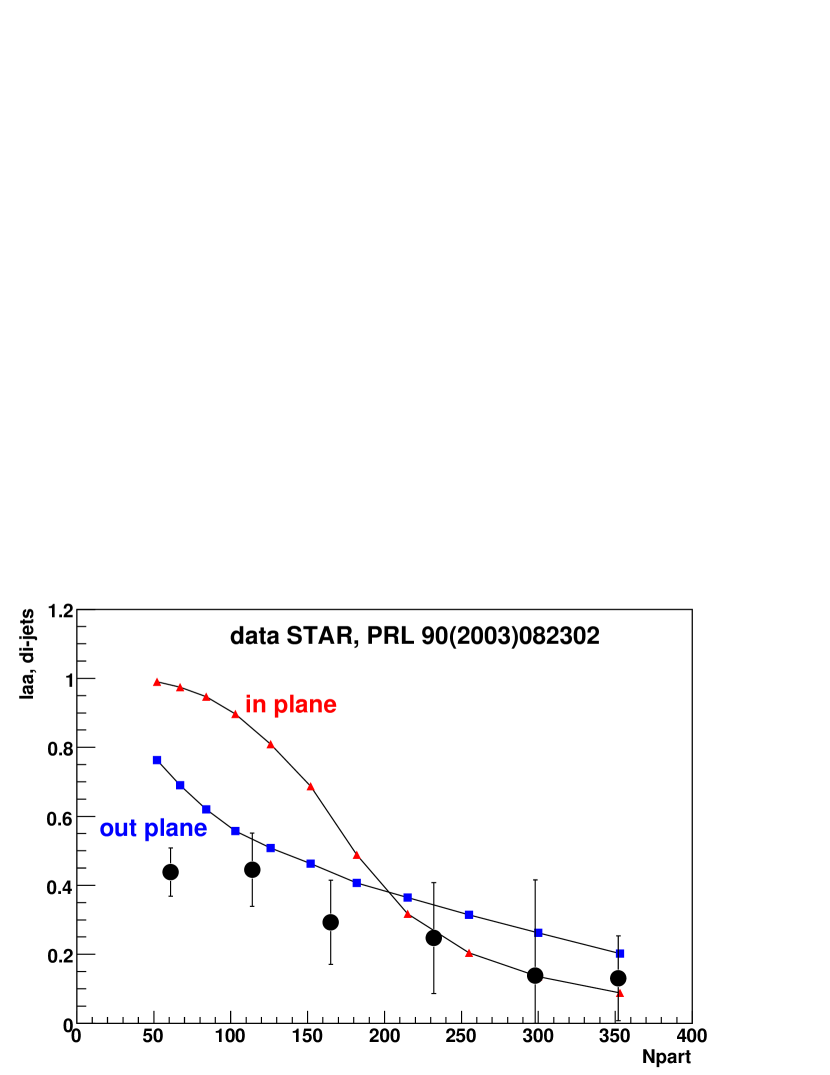
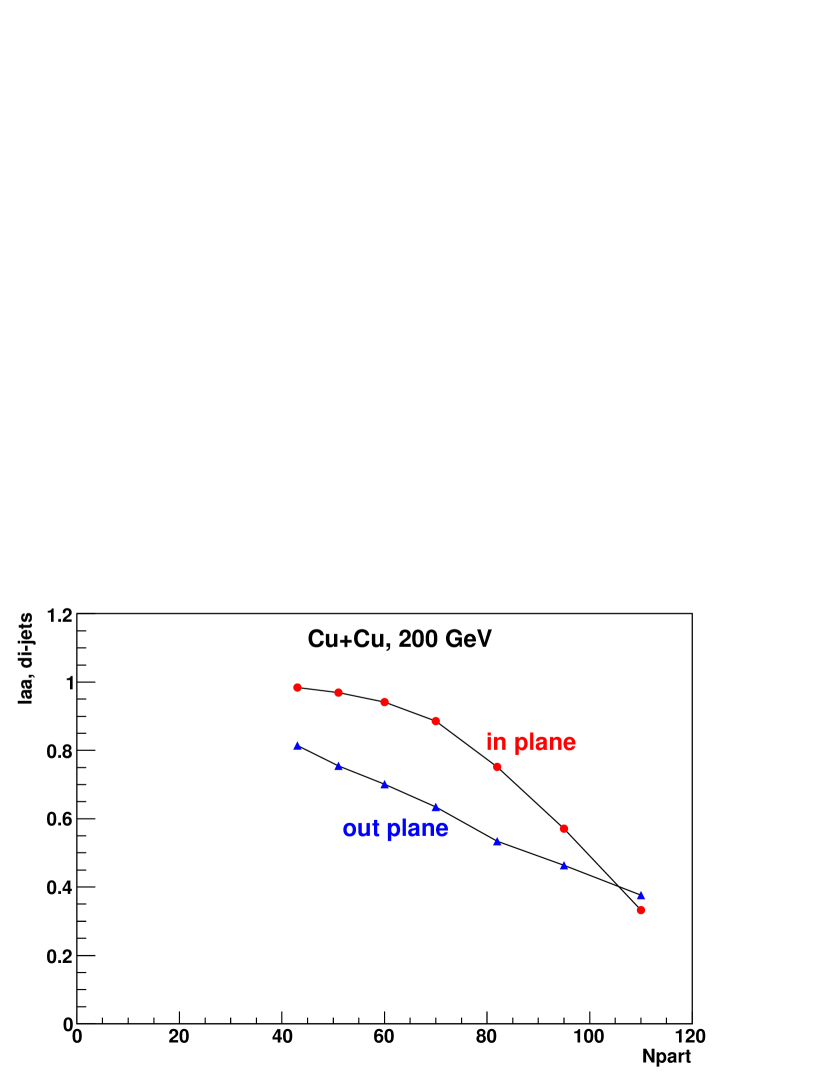
Results of calculation for in- and out of plane for Au+Au collisions at 200 GeV are presented in Fig. 2. One can see the main feature of the surface biased scenario: in the most central events there are more di-jets out of the reaction plane than di-jets in the plane. This is opposite to the reaction plane dependence or to the scenario which assumes only“punch-through” di-jets. In mid-central events the situation is mixed, and in peripheral collisions there are more in-plane di-jets. Wide centrality bin of 20 to 60, commonly used in experiments, corresponds to =125 if number of di-jets is weighted by the number of trigger particles. Resuts for Cu+Cu collisions are shown in Fig. 3.
I want to emphasize that the role of event by event fluctuations should be treated by a better way than I do it here by parameter . It is known that nucleon position fluctuations in the colliding Cu+Cu nuclei can significantly increase the observed in the most central collisions manly . This is why static models, including our model presented here, underestimate in the central Cu+Cu collisions. The same should be true when we consider di-jets in Au+Au or Cu+Cu: local density fluctuations induce positive correlation between surviving probability of the trigger jet and the away side jet. Again, such fluctuations could increase the observed value of , especially in the central collisions.
Few more comments: as I pointed out in the previous paper paper2 , if we see a significant suppression of non-photonic electrons electrons , one can expect values of for such electrons at high to be equal to for high hadrons. Another point: suppression of the away side jets in direct gamma-hadron correlations, , should be equal to the of inclusive hadrons at about gamma energy. Here I ignore the difference in quark and gluon fragmentation functions. The reason, that this may change the result, is that hadrons in the away side jets for the direct gamma-hadron correlations are mostly from quark fragmentation, while inclusive hadrons below 10 Gev/c are dominantly from gluon fragmentation.
All numbers for Au+Au collisions are presented at 200 GeV in Table 1, at 62 GeV in Table 2. Numbers for Cu+Cu collisions at 200 GeV are in Table 3, and at 62 GeV are in Table 4.
References
- (1) V. S. Pantuev, hep-ph/0506095.
- (2) V. S. Pantuev, hep-ph/0604268.
- (3) S. S. Adler et al., [PHENIX Collaboration], Phys. Rev. C69 (2004) 034910.
- (4) M. Shumomura, [PHENIX collaboration], Nucl. Phys. A774 (2006) 457, arXiv:nucl-ex/0510023.
- (5) J. Adams et al., [STAR collaboration], Phys. Rev. Lett. 93 (2004) 252901.
- (6) S. Manly, [PHOBOS collaboration], Nucl. Phys. A774 (2006) 523, arXiv:nucl-ex/0510031.
- (7) S. Butsyk, [PHENIX collaboration], Nucl. Phys. A774 (2006) 669, arXiv:nucl-ex/0510010.
| cent, | R | , | ||||||
|---|---|---|---|---|---|---|---|---|
| 0-5 | 353 | 0.195 | 0.213 | 0.177 | 4.71 | 0.145 | 0.0882 | 0.202 |
| 5-10 | 300 | 0.235 | 0.281 | 0.211 | 7.06 | 0.198 | 0.135 | 0.262 |
| 10-15 | 255 | 0.29 | 0.348 | 0.246 | 8.64 | 0.259 | 0.204 | 0.314 |
| 15-20 | 215 | 0.335 | 0.417 | 0.282 | 9.68 | 0.34 | 0.317 | 0.364 |
| 20-25 | 182 | 0.39 | 0.483 | 0.316 | 10.47 | 0.448 | 0.488 | 0.407 |
| 25-30 | 152 | 0.45 | 0.563 | 0.362 | 10.87 | 0.575 | 0.687 | 0.463 |
| 30-35 | 126 | 0.505 | 0.632 | 0.40 | 11.23 | 0.659 | 0.809 | 0.508 |
| 35-40 | 103 | 0.565 | 0.705 | 0.447 | 11.19 | 0.727 | 0.897 | 0.557 |
| 40-45 | 84 | 0.635 | 0.779 | 0.512 | 10.37 | 0.783 | 0.947 | 0.62 |
| 45-50 | 67 | 0.715 | 0.848 | 0.589 | 9.03 | 0.833 | 0.974 | 0.69 |
| 50-55 | 52 | 0.79 | 0.902 | 0.681 | 7.0 | 0.877 | 0.99 | 0.763 |
| 55-60 | 40 | 0.84 | 0.958 | 0.847 | 5.53 | |||
| cent, | R | , |
| cent, | R | , | |||
| 0-5 | 345 | 0.333 | 0.364 | 0.302 | 4.65 |
| 5-10 | 296 | 0.402 | 0.461 | 0.344 | 7.29 |
| 10-15 | 250 | 0.468 | 0.553 | 0.383 | 9.06 |
| 15-20 | 211 | 0.532 | 0.639 | 0.425 | 10. |
| 20-25 | 178 | 0.591 | 0.719 | 0.462 | 10.9 |
| 25-30 | 149 | 0.656 | 0.801 | 0.512 | 11. |
| 30-35 | 123.8 | 0.707 | 0.861 | 0.553 | 10.9 |
| 35-40 | 102 | 0.756 | 0.911 | 0.601 | 10.3 |
| 40-45 | 82.9 | 0.805 | 0.948 | 0.663 | 8.83 |
| 45-50 | 66.2 | 0.851 | 0.971 | 0.731 | 7.05 |
| 50-55 | 51.9 | 0.895 | 0.984 | 0.805 | 5.01 |
| 55-60 | 40 | 0.922 | 0.99 | 0.854 | 3.69 |
| cent, | R | , |
| cent, | R | , | ||||||
|---|---|---|---|---|---|---|---|---|
| 0-5 | 110 | 0.37 | 0.40 | 0.34 | 3.4 | 0.194 | 0.136 | 0.251 |
| 5-10 | 95 | 0.435 | 0.48 | 0.39 | 5.1 | 0.263 | 0.203 | 0.324 |
| 10-15 | 82 | 0.51 | 0.57 | 0.45 | 6.0 | 0.346 | 0.31 | 0.382 |
| 15-20 | 70.5 | 0.585 | 0.66 | 0.51 | 6.3 | 0.482 | 0.497 | 0.467 |
| 20-25 | 60 | 0.655 | 0.74 | 0.57 | 6.4 | 0.581 | 0.637 | 0.526 |
| 25-30 | 51 | 0.7 | 0.79 | 0.61 | 6.4 | 0.645 | 0.723 | 0.568 |
| 30-35 | 43 | 0.775 | 0.86 | 0.69 | 5.4 | 0.733 | 0.817 | 0.648 |
| 35-40 | 36 | 0.825 | 0.9 | 0.75 | 4.3 | 0.784 | 0.865 | 0.704 |
| 40-45 | 29 | 0.87 | 0.93 | 0.81 | 3.3 | 0.833 | 0.903 | 0.762 |
| 45-50 | 24 | 0.91 | 0.95 | 0.87 | 2.1 | |||
| 50-55 | 19 | 0.95 | 0.97 | 0.93 | 0.9 | |||
| 55-60 | 15 | 0.98 | 0.98 | 0.98 | 0 | |||
| cent, | R | , |
| cent, | R | , | |||
| 0-5 | 104 | 0.598 | 0.638 | 0.559 | 3.28 |
| 5-10 | 92 | 0.672 | 0.737 | 0.607 | 4.82 |
| 10-15 | 80 | 0.736 | 0.817 | 0.656 | 5.48 |
| 15-20 | 68 | 0.8 | 0.888 | 0.712 | 5.48 |
| 20-25 | 57 | 0.845 | 0.931 | 0.759 | 5.08 |
| 25-30 | 48.6 | 0.874 | 0.954 | 0.793 | 4.61 |
| 30-35 | 40.6 | 0.91 | 0.975 | 0.846 | 3.52 |
| 35-40 | 34 | 0.932 | 0.982 | 0.882 | 2.7 |
| 40-45 | 28 | 0.952 | 0.989 | 0.915 | 1.93 |
| cent, | R | , |