(COSY-TOF Collaboration)
Single-Pion Production in Collisions at 0.95 GeV/c (I)
Abstract
The single-pion production reactions , and were measured at a beam momentum of 0.95 GeV/c ( 400 MeV) using the short version of the COSY-TOF spectrometer. The implementation of a central calorimeter provided particle identification, energy determination and neutron detection in addition to time-of-flight and angle measurements. Thus all pion production channels were recorded with 1-4 overconstraints. The total and differential cross sections obtained are compared to previous data and theoretical calculations. Main emphasis is put on the discussion of the channel, where we obtain angular distributions different from previous experimental results, however, partly in good agreement with recent phenomenological and theoretical predictions. In particular we observe very large anisotropies for the angular distributions in the kinematical region of small relative proton momenta revealing there a dominance of proton spinflip transitions associated with - and -partial waves and emphasizing the important role of -waves.
pacs:
13.75.Cs and 25.10.+s and 25.40.Ep and 29.20.Dh1 Introduction
Single-pion production in the collision between two nucleons is thought to be
the simplest inelastic process between two baryons. Therefore it came as a
surprise, when first near-threshold data on the channel hom
revealed its cross section to be larger than predicted kol ; mil ; nis by
nearly one order of magnitude. Meanwhile the near-threshold data base has been
much improved by exclusive measurements at TRIUMF (TINA and MINA) sta ,
SATURNE (SPES0) rap and in
particular at the cooler storage rings CELSIUS (PROMICE/WASA)
bon ; zlo ; bil , COSY (GEM, TOF) bet ; DD and IUCF iucf , at the
latter also with polarized beam and target. However, this data base is still
far from being complete and often simple observables like angular and
invariant-mass distributions of the unpolarized cross section are still
missing. We report in this paper on measurements of such distributions at a
beam momentum of 0.95 GeV/c (corresponding to 397 MeV)
for the reactions , and
. For the latter we give here the total cross
section only, the differential distributions will be discussed in a separate
paper.
2 Experiment
The measurements have been carried out at the Jülich Cooler Synchrotron COSY using the time-of-flight spectrometer TOF at one of its external beam lines. The setup of the TOF detector system is displayed in Fig. 1. At the entrance of the detector system the beam - collimated to a diameter smaller than 2 mm - hits the LH2 target, which has a length of 4 mm, a diameter of 6 mm and 0.9 thick hostaphan foils as entrance and exit windows has . At a distance of 22 mm downstream of the target the two layers of the start detector (each consisting of 0.5 mm thick scintillators cut into 12 wedge-shaped sectors) were placed followed by a two-plane fibre hodoscope (96 x 96 fibers, 2 mm thick each ) at a distance of 165 mm from target, see Fig. 1b. Whereas the start detector mainly supplies the start times for the time-of-flight (TOF) measurements, the fibre hodoscope primarily provides a good angular resolution for the detected particle tracks. In its central part the TOF-stop detector system consists of the so-called Quirl, a 3-layer scintillator system 1081 mm downstream of the target shown in Fig. 1c and described in detail in Ref. dah - and in its peripheral part of the so-called Ring, also a 3-layer scintillator system built in a design analogous to the Quirl, however, with inner and outer radii of 560 and 1540 mm, respectively. Finally behind the Quirl a calorimeter (Fig. 1a,d) was installed for identification of charged particles and of neutrons as well as for measuring the energy of charged particles. The calorimeter, details of which are given in Ref. kress , consists of 84 hexagon-shaped scintillator blocks of length 450 mm, which suffices to stop deuterons, protons and pions of energies up to 400, 300 and 160 MeV, respectively. The energy calibration of the calorimeter was performed by the detection of cosmic muons.
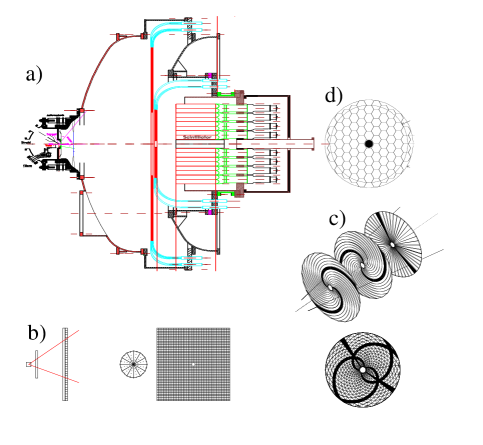
In the experiment the trigger was set to two hits in Quirl and/or Ring associated with two hits in the start detector. From straight-line fits to the hit detector elements tracks of charged particles are reconstructed. They are accepted as good tracks, if they originate in the target and have a hit in each detector element the track passes through. In this way the angular resolution is better than 1∘ both in azimuthal and in polar angles. If there is an isolated hit in the calorimeter with no associated hits in the preceding detector elements, then this hit qualifies as a neutron candidate (further criteria will be discussed below). In this case the angular resolution of the neutron track is given by the size of the hit calorimeter block, i.e. by 7 - 8∘. By construction of the calorimeter a particle will hit one or more calorimeter blocks. The number of blocks hit by a particular particle is given by the track reconstruction. The total energy deposited by this particle in the calorimeter is then just the (calibrated) sum of energies deposited in all blocks belonging to the particular track.
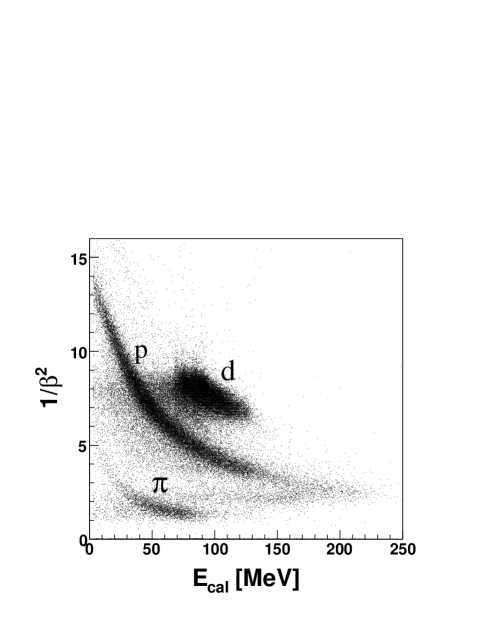
In order to have maximum angular coverage by the detector elements and to minimize the fraction of charged pions decaying in flight before reaching the stop detectors, the short version of the TOF spectrometer was used. In this way a total polar angle coverage of 3 49∘ was achieved with the central calorimeter covering the region 3 28∘. For fast particles the 4% energy resolution of the calorimeter is superior to that from TOF measurements, the resolution of which is reduced by the short path length. However, the TOF resolution is still much better than the resolution of the quirl elements. Hence, for particle identification, instead of plotting versus , the uncorrected particle energy deposited in the calorimeter, we utilize the relation with the particle charge and plot versus , where the particle velocity is derived from the TOF measurement.
Fig. 2 shows the scatterplot for two-track events. The bands for d, p and are well separated. The horizontal shadow region on the left of the deuteron band stems from deuteron breakup in the calorimeter. Note that in Fig. 2 is not yet corrected for energy and particle dependent quenching effects. By applying the quenching correction as well as the correction for energy loss in the preceding detector elements the kinetic energies of the detected particles are deduced.
By identifying and reconstructing the two charged tracks of an event the exit channels , and can be separated. Kinematically the maximum possible laboratory (lab) polar angles are for deuterons and for protons (and neutrons). Hence 88% of the angular coverage for deuterons and 86% of that for protons from single pion production are within the angular acceptance of the calorimeter. For charged pions the angular coverage has been much lower with this setup, since kinematically they can extend up to 180∘. Hence within the angular coverage of Quirl and Ring the angular acceptance for has been 40 only. Nevertheless most of the phase space part necessary for a full coverage of the physics in single pion production has been covered (see below) by these measurements due to the circumstance that the center-of-mass (cm) angular distributions have to be symmetric about 90∘ because of identical collision partners in the incident channel.
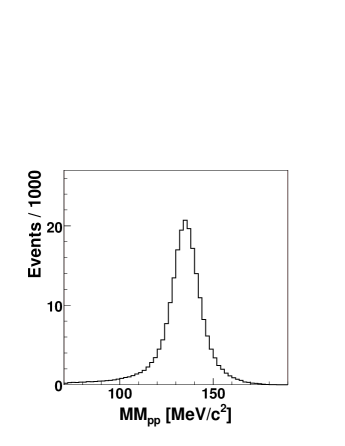
For 25.5∘ the events have been identified by requiring the two charged tracks of the events to be protons identified in the Quirl-calorimeter system and by the condition that their missing mass meets the constraints 100 MeV 180 MeV (Fig. 3). For 28∘ the protons of the channel have been detected in the Ring. Since kinematically they have a small they are easily distinguished from pions hitting the Ring and also from elastically scattered protons. The same applies for the angular region 25.5 28∘, where the protons hit only the edge of the calorimeter and in general no longer stop there. In both cases the proton energy is calculated from the corresponding TOF measured by the Start-Ring and Start-Quirl detector systems, respectively. Thus the full kinematically accessible angular range was covered for this reaction channel with exception of the beam-hole region ( 3∘).
The events have been selected by identifying both deuteron and pion, if both hit the calorimeter or by identifying only the deuteron, if the pion hits the Ring. Corresponding missing mass checks have been applied. In addition, the coplanarity condition is used to further distingiush events from three-body background. That way even the deuteron identification in the calorimeter may be omitted, thus allowing to check how well the deuteron breakup in the calorimeter is under control in the Monte Carlo (MC) simulations. Within uncertainties both ways lead to identical results.
Finally the channel is selected by identifying proton and pion in the calorimeter or only the proton in the calorimeter, when the second charged track is in the Ring. In addition the missing mass has to meet the condition 900 MeV 980 MeV . Also to suppress background from the channel - in particular when the deuteron is broken up and appears as a proton in the calorimeter - the track is required to be non-coplanar, i.e. complementary to the coplanarity condition given above. Further on the neutron 4-momentum is reconstructed from the 4-momenta of proton and pion and it is checked, whether a calorimeter block in the corresponding (, ) region recorded a hit accompanied without any entries recorded in the preceding detector elements of the Quirl. If these conditions are met, a neutron track is assumed. That way and are determined by the location of this calorimeter block. Thus having only the neutron energy undetermined experimentally we end up with 3 kinematic overconstraints for this channel, whereas we have 1 overconstraint for the channel and 4 overconstraints for the channel. Corresponding kinematic fits were applied.
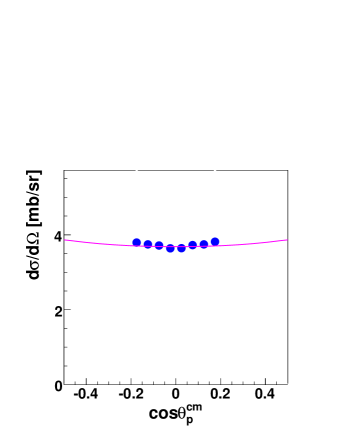
The luminosity of the experiment was determined from the analysis of
elastic scattering. Due to their opening angle of
between both tracks, such two-track events have both hits in the Ring. They
are easily identified by using in addition the coplanarity constraint
. Fig. 4
shows the measured angular distribution in comparison with the prediction from
the SAID database SAID . The data have been efficiency corrected by MC
simulations of the detector setup. Adjustment of the data in absolute height
gives the required luminosity ( and time averaged) and the absolute normalization of the
single-pion production cross sections, respectively, which will be discussed
in the following.
3 Results
Due to the identity of the collision
partners in the entrance channel the angular distributions in the overall
center-of-mass system have to be symmetric about 90 ∘, i.e. the
full information about the reaction channels is contained already in the
intervall . Deviations from this
symmetry in the data indicate systematic uncertainties in the
measurements. Hence we plot - where appropriate - the full angular range, in
order to show the absence of major systematic errors present in our
measurement.
Tab. 1: Total cross sections at 400 MeV for the reactions , and evaluated in this work and compared to previous measurements.
| [mb] | |||
|---|---|---|---|
| 0.74 (2) | 0.47 (2) | 0.100 (7) | |
| 0.72a) | 0.092 (7)b) | ||
| 0.070 (7)c) |
The evaluated total cross sections for the three channels are given in Tab. 1
together with previous results. The uncertainties assigned
are based on systematics for acceptance and efficiency corrections as obtained
by variation of MC simulations for the detector response, where we have varied
the MC input assuming either pure phase space or some reasonable models for
the reaction under consideration. Statistical
uncertainties are negligible compared to the systematic uncertainties.
3.1
Absolute and differential cross sections for this reaction channel are very
well known from previous experiments. Hence we use the analysis of our data
for this channel primarily as a check of the reliability of our measurement
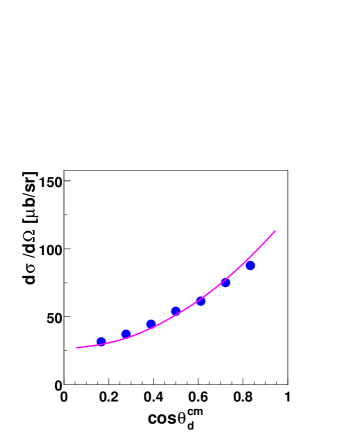
and data analysis. In Fig. 5 our results for the angular distribution
are shown in comparison with the prediction from the SAID data base
SAID . Since in the measurement we cover only angles
90∘ we show in Fig.5 only the appropriate half of the
full angular distribution. Note, however, that due to the symmetry
of the angular distribution around most of the physically
relevant phase space part has been covered in this measurement.
We find good agreement with the SAID data base both in absolute magnitude
and in the shape of the angular distribution. Since the
pions of this channel cover the angular range of both Quirl and Ring, i.e.,
stem from Quirl-Quirl and Quirl-Ring coincidences, the good agreement with
SAID assures that there are no significant problems with correlating the
efficiences of Quirl and Ring.
3.2
This channel has received increasing attention since first measurements in the threshold region iucf at IUCF and later also at CELSIUS bon uncovered the total cross section to be nearly an order of magnitude larger than predicted theoretically kol ; mil ; nis . Very recent close-to-threshold measurements at COSY-TOF revealed the experimental total cross sections to be even larger by roughly 50 DD than previously measured. There it was shown that the pp final state interaction (FSI) has a very strong influence on the reaction dynamics close to threshold with the consequence that a substantial part of the cross section is at small lab angles, which were missed in IUCF and CELSIUS measurements near threshold. At higher energies, 320 MeV 400 MeV, where the influence of the pp FSI decreases more and more, the total cross section data measured at TRIUMF sta , SATURNE rap , COSY-GEM bet and CELSIUS (PROMICE/WASA) bil are in agreement with each other with the exception of a 20 discrepancy at 400 MeV between CELSIUS and TRIUMF results. Our value, see Tab. 1, is in agreement with the CELSIUS result. Recent measurements with polarized beam rap and partly also polarized target hom added much to the detailed knowledge of this reaction from threshold up to 400 MeV.
Despite the wealth of experimental information on this reaction there remain a number of problems, which are not yet sufficiently settled. E.g., the anisotropy of the pion angular distribution in the overall cm system, characterized by the anisotropy parameter , which traditionally sta ; rap is defined by
where denotes the polar angle in the overall cm system, shows a big scatter in the results from different measurements, see, e.g., Fig.11 in Ref.DD for 400 MeV and Fig.6 in Ref.rap for higher incident energies. Note that in Ref.DD the Legendre coefficient for p-waves is plotted according to the ansatz
In this paper we will use eq. (2) analogously also for fitting the experimental proton angular distributions by replacing with , the proton angle in the pp subsystem. The parameters and are related by for . We will use the quantity in the following discussion of the angular distributions.
Near-isotropy is found for 400 MeV with staggering between -0.1 and +0.1 - with a tendency for negative values. The latter would mean that d-wave contributions inducing negative values are already present close to threshold zlo . A clearer trend towards positive values is observed for 400 MeV.
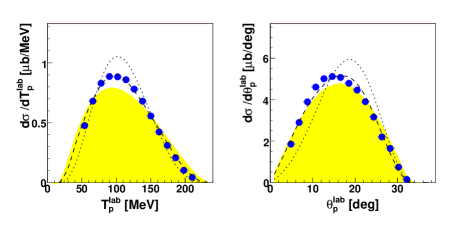
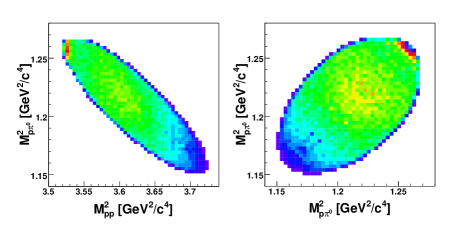
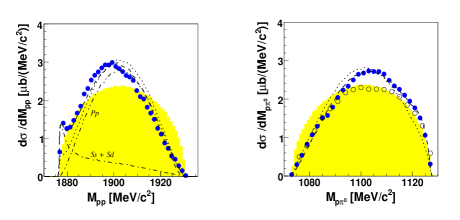
As we will show below, our results for are at variance with previous results and hence need a more detailed consideration. To this end we start the presentation and discussion of our results first with energy and angular distribution of the protons in the lab system as displayed in Fig.6. In this and in the following one-dimensional figures phase space distributions are shown by shaded areas for comparison. We see that the data do not deviate vigorously from the phase space distributions, as we would expect, e.g., if excitation would play a dominant role in this reaction channel. This is also visible in the experimental Dalitz plots of versus and versus displayed in Fig.7. The data cover essentially the full available elliptic phase space areas and yield distributions, which are close to flat with just one pronounced excursion in the region of the FSI. This is reflected also in the projections of the Dalitz plot leading to the spectra of the invariant masses and (Fig.8). The latter exhibits a small spike at the threshold due to FSI, though in total its influence is of minor importance as expected from the small amount of s-wave between the two protons being available at this energy iucf . In the spectrum we compare our data with the ones from CELSIUS as given in Ref.bil . We find agreement between both data sets with the exception of the region around 1100 MeV/, where we obtain a somewhat larger yield.
Now we turn again to the angular distributions, which are shown in Fig.9, on the left for the pions denoted by their cm polar angles and on the right for protons in the subsystem (Jackson frame) denoted by , i.e. we use the same coordinate system scheme as defined in the IUCF publication iucf . Both distributions are close to flat, exhibit, however, a clearly negative anisotropy parameter with for pions and for protons.
4 Discussion of Results
The negative anisotropy parameter observed in this experiment for the angular distribution comes as a surprise, since all previous experiments around 400 MeV gave - or indicated at least - a positive value for the pions, the most serious discrepancy being with the PROMICE/WASA results bil of (note that the values given in bil need to be divided by a factor of 3, in order to comply with our definition of in eq. 1), since this measurement provided the best statistics and phase space coverage of all previous experiments at this energy. Although this work reports negative values for 360 MeV, positive values are found for 400 MeV.
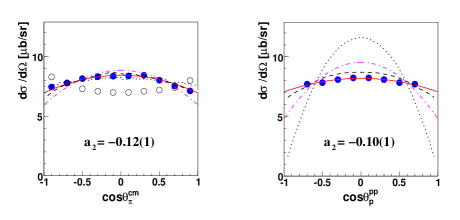
From their analysis of polarization data the authors of Ref. iucf also find some predictions for the unpolarized angular distributions, though with very large uncertainties. For protons they get and for pions . The first one agrees in sign and value with our results, however, their value for the pions has an opposite sign. Nevertheless, since these numbers were obtained only indirectly with very large uncertainties, this is not a point of major concern - in particular since -waves , which as we demonstrate in this paper are vital for a proper understanding of the reaction, are not taken into account in Ref. iucf . We also note that a recent measurement of this reaction at = 400 MeV was carried out at CELSIUS-WASA, too. The results of its analysis also provide a negative parameter for the pion angular distribution kel ; pia . If we restrict our data to the same proton angular range covered in the CELSIUS-WASA experiment, then we find full consistency between both results.
On the theoretical side extensive meson-exchange calculations as well as partial wave analyses were carried out very recently by the Jülich theory group han1 ; dhh ; han2 . Their calculations partly are in good agreement with the polarization data. Interestingly their prediction for proton and pion angular distributions (shown in Fig. 9 by the dash-dotted lines) also results in negative agreement with our results. More advanced calculations based on chiral pertubation theory are in progress. First steps in this direction have already been taken by this group len .
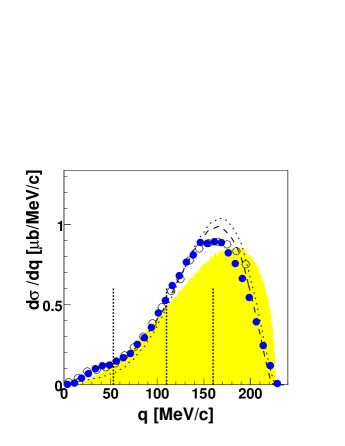
In order to get a better insight into this problem and to compare in more
detail with the CELSIUS results we next consider the angular
distributions in dependence of , defined as half of the relative momentum
between the two protons and given by . In this
definition then denotes the momentum of a proton in the
subsystem. The
distribution obtained from our data is compared in Fig.10 with the one given in
Ref. bil . Whereas good agreement between both results is found for
MeV/c, substantial deviations appear for larger values. In
general large values are associated with large opening angles between the
protons, which in our experiment are fully covered. However,
with the setup at PROMICE/WASA, where protons were detected only for lab
angles smaller than 20∘, the high- region was not covered as
completely as at TOF and substantial extrapolations had to be applied in the
acceptance correction for this part of the CELSIUS data.
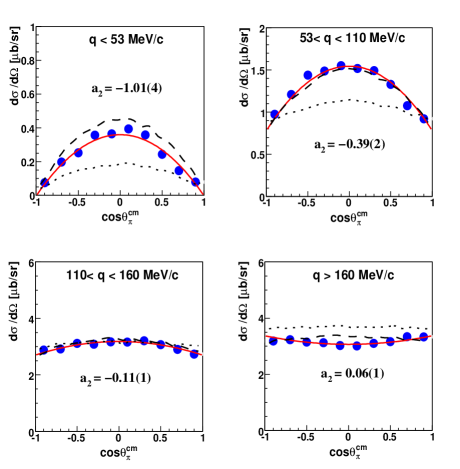
4.1 -dependence of angular distributions
In Figs. 11 and 12 we plot pion and proton angular distributions for the four different regions indicated in Fig. 10. The corresponding anisotropy parameters obtained by fitting eq. (2) to the data are indicated in each of the plots. We see that the pion angular distribution is strongly anisotropic with for the lowest range, where there are also results from Ref. bil - and in fact they also exhibit a very strong anisotropy with . With increasing the pion angular distributions are getting gradually flatter and for large the distribution gets even curved with .
The lowest range ( 53 MeV/c) is particularily interesting. It corresponds to a kinetic energy of the protons in the subsystem of = 3 MeV, a constraint, which has been frequently used to have the subsystem safely selected in a relative -wave state. That way especially simple configurations in the exit channel are selected allowing a deeper insight into basic reaction mechanisms of production. In particular, configurations are selected that way, where , i.e., which have the system in relative p-wave in the intermediate state. In fact, the observed exceptionally large pion anisotropy of equivalent to a pure distribution means that at = 400 MeV the production process associated with -wave protons in the final state happens to be a pure proton spinflip process originating from the transitions and , where capital letters refer to partial waves in the pp system and small letters to partial waves of relative to the pp system (see e.g. Table I in Ref. iucf for a list of contributing partial waves). In fact, this very special situation has been predicted in the phenomenological model of Ref. zlo , which - based on the CELSIUS-WASA measurement at = 310 MeV - gave already a good description of the RCNP data rcnp at = 300, 318.5, 345 and 390 MeV in the 3 MeV range. If we use this model ansatz the cross section is given by
where PS and FSI stand for phase space and FSI factors ( for the latter see eq. (2) of Ref. zlo ). The pion cm momentum and the momentum , which is half the relative momentum between the proton pair, are given here in units of the pion mass. and denote pion - and -wave amplitudes for the transitions and - as defined in Ref. zlo with = -1.2 - whereas = 0 and = 0.98 stand for proton -wave contributions of the transitions , and with , respectively.
If we use eq. (3) together with the parameters , and as determined in Ref. zlo , then we obtain the dotted curves in Figs. 6 and 8 - 12. The agreement of these calculations with our data is striking for the lowest bin (Figs. 11, 12) if renormalized to the same absolute cross section of this bin. Also for the other differential distributions it is partly surprisingly good - with the exception of the proton angular distributions, where the ansatz badly fails. However, the trend in the pion angular distribution is correctly reproduced. We return to this point at the end of this chapter, section (ii).
For the pion angular distribution in the lowest- region a very strong anisotropy with has recently also been observed in COSY-ANKE measurements at = 800 MeV dym . In a very recent work by Niskanen nis1 these anisotropies are explained by a strong energy dependence of the forward cross section due to interfering pion partial waves.
For the proton angular distribution, unfortunately, no data are shown in Ref. bil to compare with (there the proton angular distribution in the overall cm system is shown instead, which is slightly different from the one in the subsystem). In the low- region, i.e. in the region affected most strongly by the FSI, we expect the partial wave between the two protons to dominate. Indeed, we find the angular distribution to be compatible with isotropy within uncertainties. With increasing the distribution gets more and more anisotropic with .
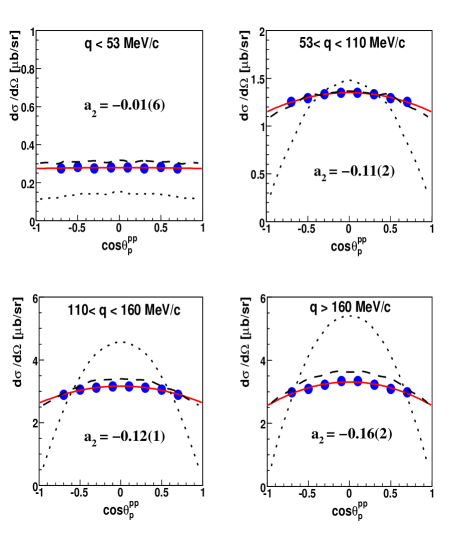
The observed trend in the angular distributions is not unexpected. In the low- region the system has kinematically the least internal freedom and hence no chance to develop much dynamics involving higher partial waves. At the same time the pion has kinematically the largest freedom within the system with the possibility to involve dynamically higher partial waves, which then show up in appreciable anisotropies of the pion angular distributions. At large the situation is reversed and the pions are kinematically bound to low partial waves, i.e. flat angular distributions. The observed anisotropies with negative values both for proton and pion angular distributions in the lower range point to the importance of proton spinflip transitions in this process, which are associated with excitation in the intermediate state as well as with - and -waves in the exit channel. Our results are in support of the conclusions in Ref. zlo that -waves play an important role already close to threshold, obviously favored by the possibilty of exciting the in this manner.
4.2 partial-wave description of data
Finally we come back to the partial-wave ansatz in Ref. zlo , which is a simplified version of the more comprehensive ansatz in Ref. bil and which we have seen to work quite well for the pion angular distributions, however, failing badly for the proton distributions. In order to overcome these shortcomings we modify eq. (3) slightly (and more plausible, if we look at the partial-wave expansions given in Ref. bil ; iucf ) by
where the latter coefficients for the waves are related to the one in eq. (3) and in Ref. zlo by = in combination with . Note that in this ansatz and contributions are taken into account only very rudimentarily in the hope that still their most important parts are covered by the ansatz. Also for the contribution a term has been neglected due to its smallness and in order to keep the ansatz as close as possible to the one of Ref. zlo .
Since the model ansatz of Ref. zlo works already very well for the pion angular distributions, we do not touch the pion - and -wave parts, i.e. leave the correlation = -1.2 , take as a general scale parameter to reproduce the integral cross section and adjust for best reproduction of the proton angular and distributions. As a result we obtain
= -1.2 , = 0, = 0.22 and = -0.34 .
Actually we get a slightly better description having = -0.006. However, since as a squared quantity should not be negative, we set = 0 as was done also in Ref. zlo . The resulting values mean that aside from and contributions the dominant contribution comes from configurations, whereas configurations are of minor importance. The decomposition of the total cross section into interfering and wave contributions on the one hand and contributions on the other hand is shown in Fig. 8 for the invariant mass distribution. We see that the wave part adds significantly to the total cross section and accounts very well for the observed FSI effect in the invariant mass distribution. Note that contributions, which turn out here to be crucial for the understanding of the neagative cuirvature of the pion angular distributions, have not been taken into account in the analysis of Ref. iucf .
Though this ansatz is still very simple compared to the full
partial-wave ansatz as given in Refs. bil ; iucf , it is obviously
sufficient to provide a near quantitative
description of the data both for angular distributions and invariant
masses (dashed lines in Figs. 6, 8 -12). It is not the
aim of this work to provide a perfect partial-wave fit to the data. We rather
put here the main emphasis on revealing the dominating partial waves in this
reaction, which are responsible for the main signatures in the (unpolarized)
differential observables. Compared to Ref. zlo the only
major change is the replacement of the term with its inappropriate
dependence by the and terms, which
provide a more appropriate angular dependence for the protons. This
modification, however, is not
surprising, since the proton angular dependence has actually not been tested
in Ref. zlo . From the successful description of our data as well of
those treated in Ref. zlo we conclude that the ansatz eq. (4) provides
an amazingly successful description of the ( unpolarized) data from threshold up to = 400 MeV.
5 Summary
It has been demonstrated that by addition of the central calorimeter the
COSY-TOF setup is capable of providing a reliable particle identification on
the basis of the E-E technique. In this way the different single pion
production channels were separated. The results for the
channel agree well with previous results. For the channel significant
deviations from previous investigations were obtained for angular
distributions as well as for invariant mass spectra. It has been demonstrated,
that pions and protons exhibit -dependent angular distributions. Hence a
full coverage of the phase space appears to be mandatory for reliable
experimental results on this issue. For the
lower region angular distributions with negative parameter dominate
pointing to the importance of proton spinflip transitions associated with
- and -waves. In
particular,
we observe a pure distribution for 3 MeV,
which derives from a special combination of the spinflip transitions and . Different
from previous experiments this has been the first measurement at
400 MeV covering practically the full reaction phase space. The data thus may
serve as a reliable basis for a comprehensive phase shift analysis of this
reaction.
Acknowledgements.
This work has been supported by BMBF, DFG (Europ. Graduiertenkolleg 683) and COSY-FFE. We acknowledge valuable discussions with Murat Kaskulov, Pia Thorngren-Engblom, Jozef Złomanczuk, Christoph Hanhart and Alexander Sibirtsev.References
- (1) H. O. Meyer et al., Nucl. Phys. A539, 633 (1992)
- (2) D. Koltun and A. Reitan, Phys. Rev. 141, 1413 (1966)
- (3) G. A. Miller and P. U. Sauer, Phys. Rev. C44, R1725 (1991)
- (4) J. A. Niskanen, Phys. Lett. B289, 227 (1992)
- (5) S. Stanislaus et al., Phys. Rev. C44, 2287 (1991)
- (6) G. Rappenecker et al., Nucl. Phys. A590, 763 (1995)
- (7) A. Bondar et al., Phys. Lett. B356, 8 (1995)
- (8) J. Zlomanczuk et al., Phys. Lett. B436, 251 (1998)
- (9) R. Bilger et al., Nucl. Phys. A693, 633 (2001)
- (10) M. Betigeri et al., Phys. Rev. C65, 064001 (2002)
- (11) S. Abd El-Samad et al., Eur. Phys. J. A17, 595 (2003)
- (12) H. O. Meyer et al., Phys. Rev. C63, 064002 (2001) and references therein
- (13) A. Hassan et al., Nucl. Inst. Meth. A425, 403 (1999)
- (14) M. Dahmen et al., Nucl. Inst. Meth. A348, 97 (1994)
-
(15)
J. Kress, PhD thesis Univ. Tübingen 2003,
http://w210.ub.uni-tuebingen.de/dbt/volltexte/2003/939 - (16) R. A. Arndt et al., Phys. Rev. C62, 034005 (2000); SAID data base see also http://said.phys.vt.edu
- (17) S. Keleta, licenciate thesis Univ. Uppsala 2004
- (18) P. Thorngren-Engblom et al., contribution to MESON 2006, Cracow, and to be published
- (19) C. Hanhart, J. Haidenbauer, O. Krehl and J. Speth, Phys. Rev. C61, 064008 (2000)
- (20) P. Deepak, J. Haidenbauer and C. Hanhart, Phys. Rev. C72, 024004 (2005)
- (21) C. Hanhart, Phys. Rep. 397, 155 (2004) and priv. comm.
- (22) V. Lensky et al., Eur. Phys. J. A27, 37 (2006)
- (23) Y. Maeda et al., Newsletter 13, 326 (1997); K. Tamura, Y. Maeda, N. Matsuoka, Nucl. Phys. A663, 457c (2000)
- (24) S. Dymov et al., Phys. Lett. B635, 270 (2005); nucl-ex/0512035
- (25) J. A. Niskanen, nucl-th/0603072