Transverse dynamics of Pb–Pb collisions at 40 GeV/ viewed by strange hadrons
Abstract
The transverse mass spectra of , , and particles produced in Pb–Pb collisions at 40 GeV/ have been studied for a sample of events corresponding to the most central 53% of the inelastic Pb–Pb cross-section. We analyze the distributions in the framework of a parameterized model inspired by hydrodynamics. The dependence of the freeze-out parameters on particle species and event centrality is discussed and comparisons with results at higher energy are shown.
pacs:
12.38.Mh, 25.75.Nq, 25.75.Ld, 25.75.Dw1 Introduction
Ultra-relativistic collisions between heavy ions are used to study the properties of nuclear matter at high energy density. In particular, lattice Quantum Chromo-Dynamics (QCD) calculations predict a state of matter of deconfined quarks and gluons (quark-gluon plasma, QGP) at an energy density exceeding 0.6 GeV/fm3 [1]. For recent reviews of experimental results and theoretical developments see references [2].
Strange particle production has proved to be a powerful tool to study the system formed in heavy ion collisions [3]. If a QGP state is formed, an increased production of and quarks with respect to normal hadronic interactions is expected [4]. The abundance of and quarks would equilibrate in a few fm/, comparable with the plasma lifetime. The result, after statistical hadronization, would be an enhancement of the strange and multi-strange particle abundance in nucleus–nucleus interactions with respect to nucleon-nucleon interactions; the enhancement was also predicted to increase with the number of valence strange quarks [4]. We have reported recently [5] results confirming the WA97 finding [6] that strange particle production in Pb–Pb collisions at 158 GeV/ is enhanced, with the predicted hierarchy as expected in a QGP scenario. The effect amounts to about a factor 20 enhancement for the triply-strange . Preliminary results at 40 GeV/ [7] indicate a similar pattern of the strangeness enhancement to that observed at higher energy. Enhancement of strange meson and baryon production in Pb–Pb collisions has also been reported by the NA49 Collaboration [8, 9, 10].
Ratios of particle abundances are rather well described by thermal models [11]; this is interpreted as strong evidence of local thermalization of the nuclear matter formed in the collision on a time scale shorter than the lifetime of the fireball. Local thermal equilibrium is a prerequisite to allow the description of the evolution of the system using ideal fluid dynamics, provided that the mean free path of the fireball constituents is short enough. Hydro-dynamics or parameterized models inspired by hydro-dynamics have shown to give a successful description of a number of observables, i.e. transverse momentum () and rapidity () distributions, direct and elliptic flow, and two-particle correlation functions (for recent reviews see, e.g., references [12]).
Collective dynamics in the transverse direction is of major interest since it can only arise by the buildup of a pressure gradient which, in turn, would be strongly suggestive of thermal equilibration of the system formed in the collision.
The shapes of the spectra are expected to be determined by an interplay between two effects: the thermal motion of the particles in the fireball and a pressure-driven radial flow, induced by the fireball expansion. To disentangle the two contributions we rely on the blast-wave model [13], which assumes cylindrical symmetry for an expanding fireball in local thermal equilibrium, under different hypotheses on the transverse flow profile. The analysis of transverse expansion in Pb–Pb at 158 GeV/ was presented in reference [14]. In this paper we discuss the study of the transverse mass () spectra for , , hyperons, their anti-particles and measured in Pb–Pb collisions at 40 GeV/.
2 The NA57 set-up
The , , hyperons, their anti-particles and the mesons are identified by reconstructing their weak decays into final states containing only charged particles:
| (1) |
and the corresponding charge conjugates for anti-hyperons. The charged tracks emerging from strange particle decays were reconstructed in a telescope made of an array of silicon detector planes of 5x5 cm2 cross-section placed in an approximately uniform magnetic field of 1.4 Tesla perpendicular to the beam line; the bulk of the detectors was closely packed in an approximately 30 cm long compact part used for pattern recognition. Descriptions of the NA57 apparatus can be found in references [5, 14, 15]. There, however, emphasis is placed on the 158 GeV/ beam momentum set-up. The experimental set-up for Pb-Pb collisions at 40 GeV/ is conceptually similar: the only differences are in the telescope inclination and detector positions which have been chosen in order to optimize at the lower energy the acceptance and reconstruction efficiency of strange particles produced at mid-rapidity. A sketch of the silicon telescope as installed on the NA57 optical bench is shown in figure 1.
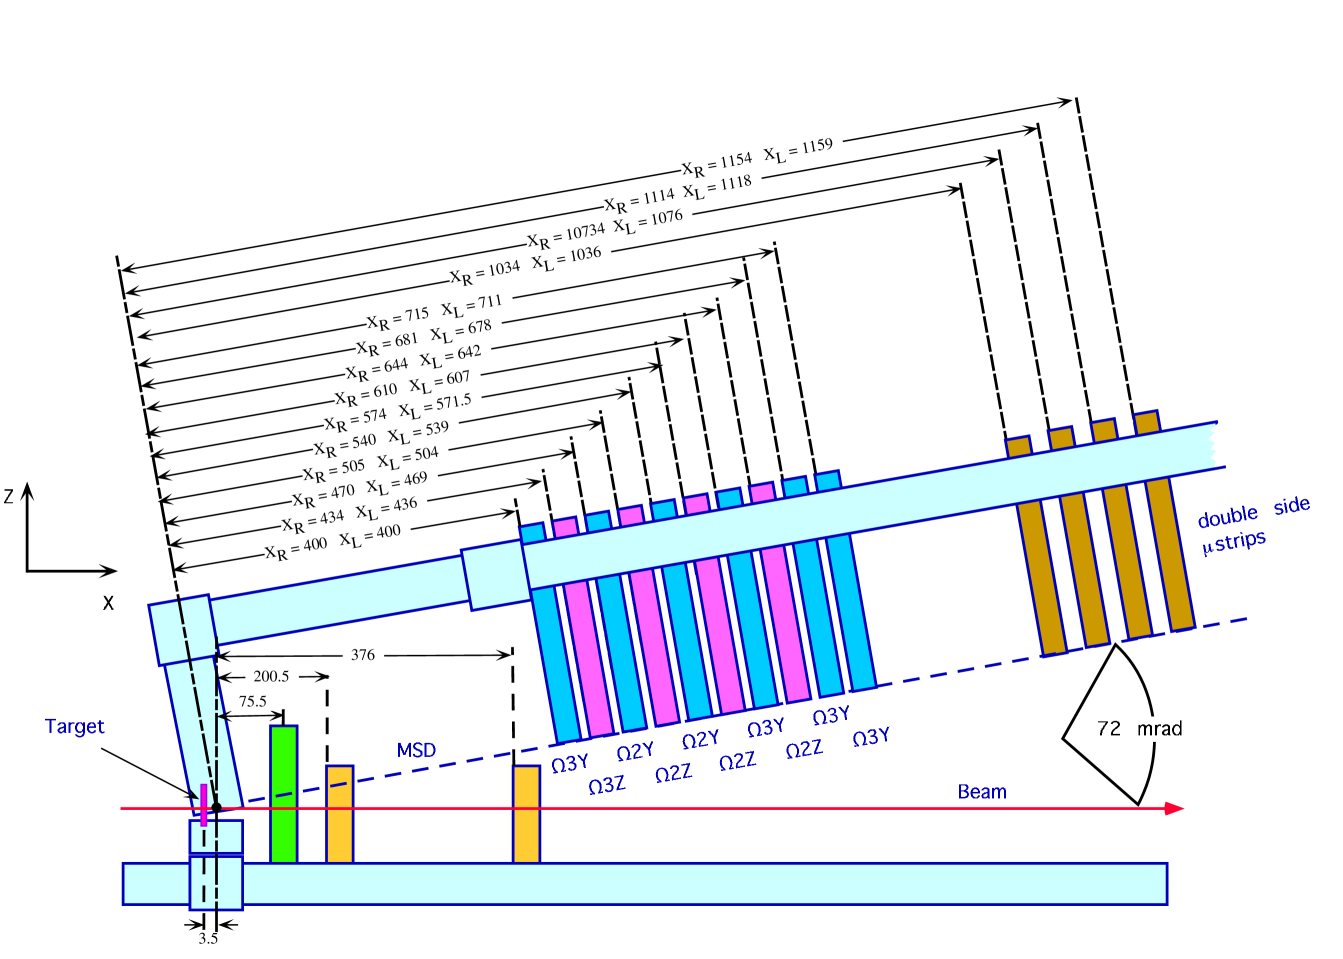
An inclination angle of mrad with respect to the beam line and a distance of the first pixel plane from the target equal to cm were set in order to accept particles produced in about half a unit of rapidity around central rapidity at medium transverse momentum.
An array of scintillation counters (Petals), placed 7.9 cm downstream of the target, provided a fast signal to trigger on the centrality of the collisions. The Petals covered the pseudo-rapidity region and their thresholds could be set so as to accept events with track multiplicities above an adjustable limit. This was tuned so that the triggered event sample corresponds to approximately the most central 56% of the Pb–Pb inelastic cross-section. The thickness of the Pb target was 1% of an interaction length.
The centrality of the Pb-Pb collisions is determined (off-line) by analyzing the charged particle multiplicity measured by two stations of micro-strip silicon detectors (MSD) which sample the pseudo-rapidity intervals and .
3 Data sample and analysis
The results presented in this paper are based on the analysis of the full data sample collected in Pb–Pb collisions at 40 GeV/, consisting of 240 M events. The selected sample used for the analysis corresponds to the most central 53% of the inelastic Pb–Pb cross-section. The data sample has been divided into five centrality classes (0,1,2,3 and 4, class 4 being the most central) according to the value of the charged particle multiplicity measured by the MSD. The procedure for the measurement of the multiplicity distribution and the determination of the collision centrality for each class is described in reference [16]. The fractions of the inelastic cross-section for the five classes, calculated assuming an inelastic Pb–Pb cross-section of 7.26 barn, are the same as those defined at higher beam momentum (158 GeV/) and they are given in table 1.
| Class | |||||
|---|---|---|---|---|---|
| (%) | 40 to 53 | 23 to 40 | 11 to 23 | 4.5 to 11 | 0 to 4.5 |
The strange particle signals are extracted with the same procedure used at 158 GeV/ [5, 14] by applying similar geometric and kinematic constraints. The invariant mass spectra of , , and combinations after all analysis cuts are shown in figure 2.
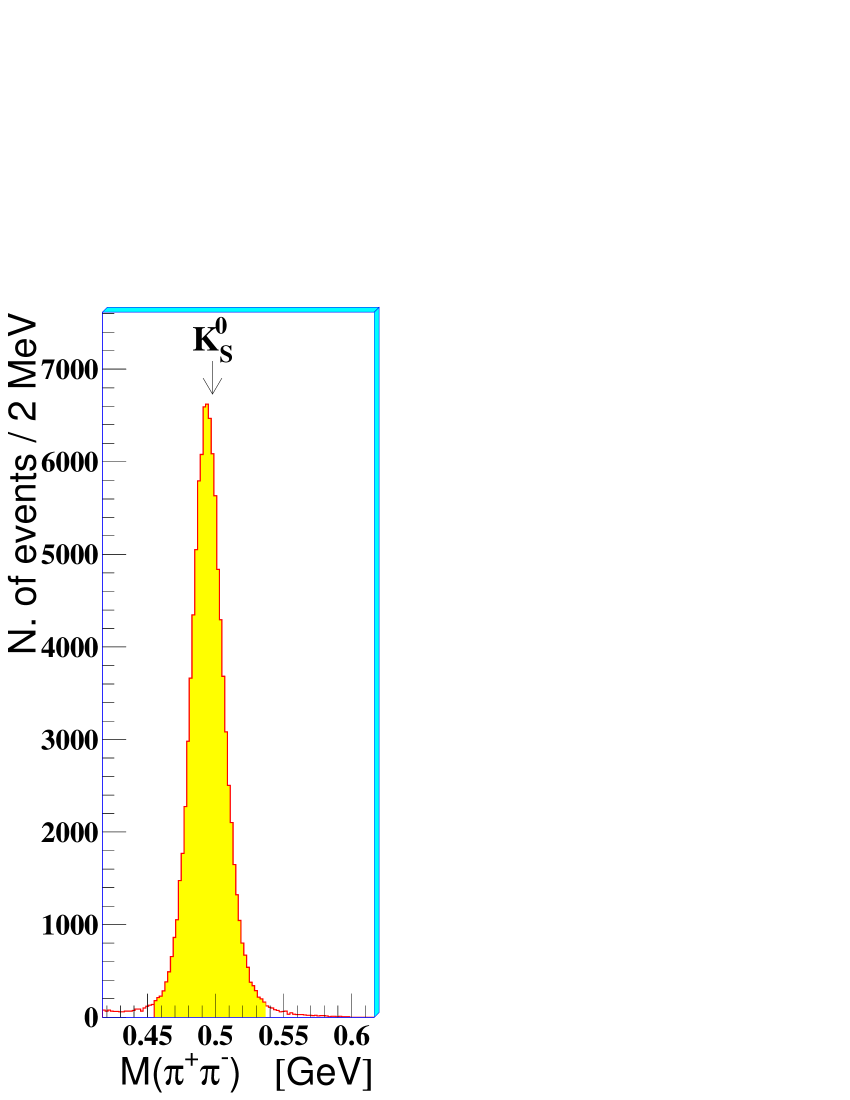
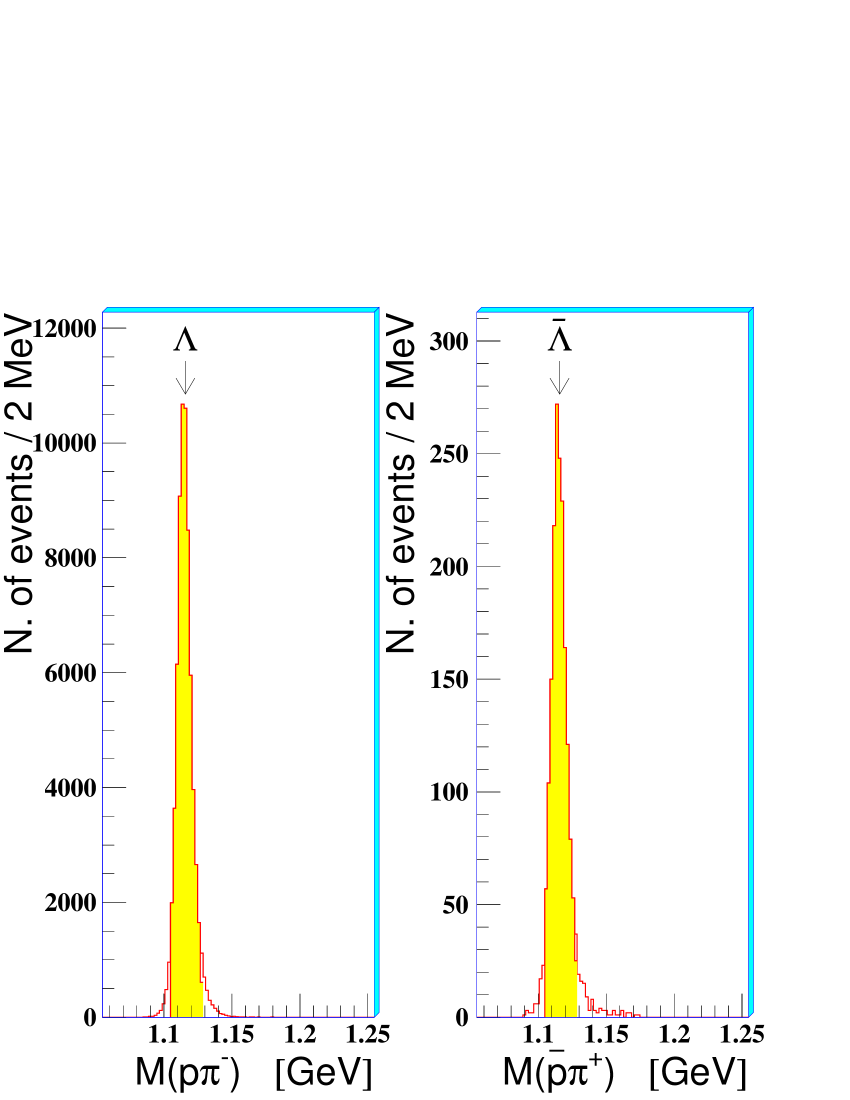
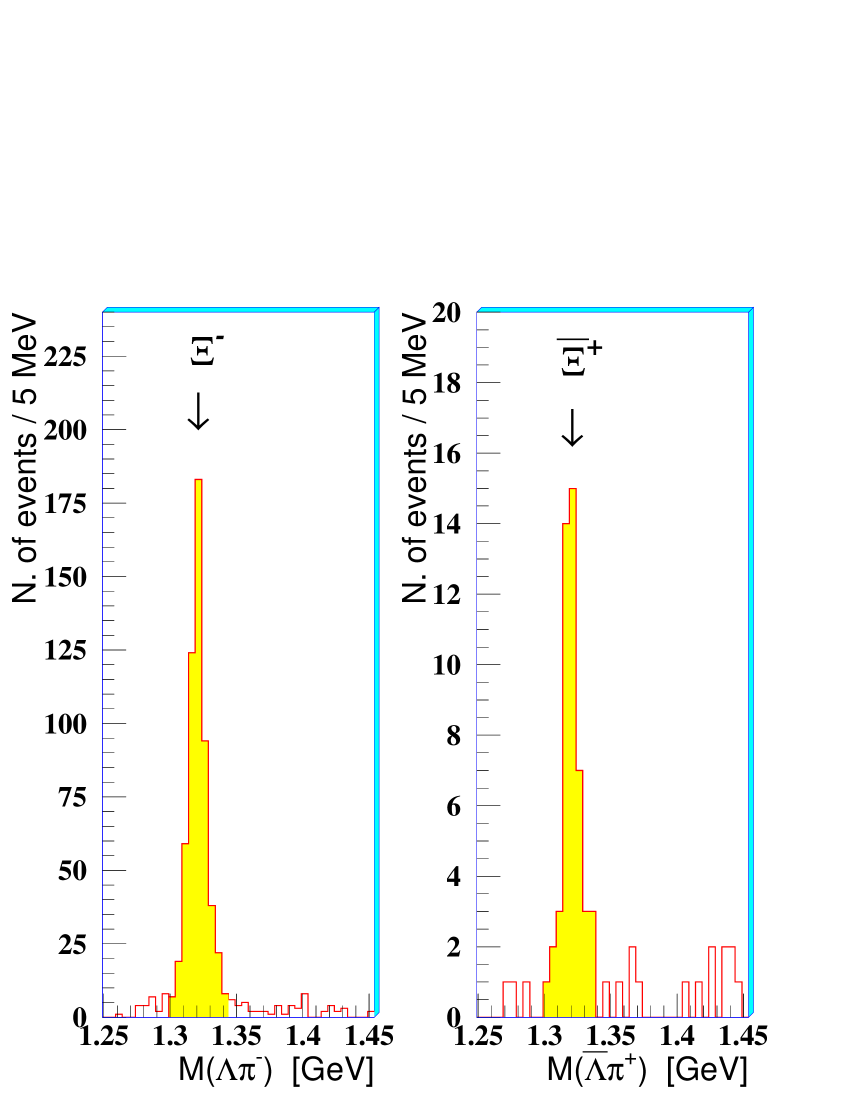
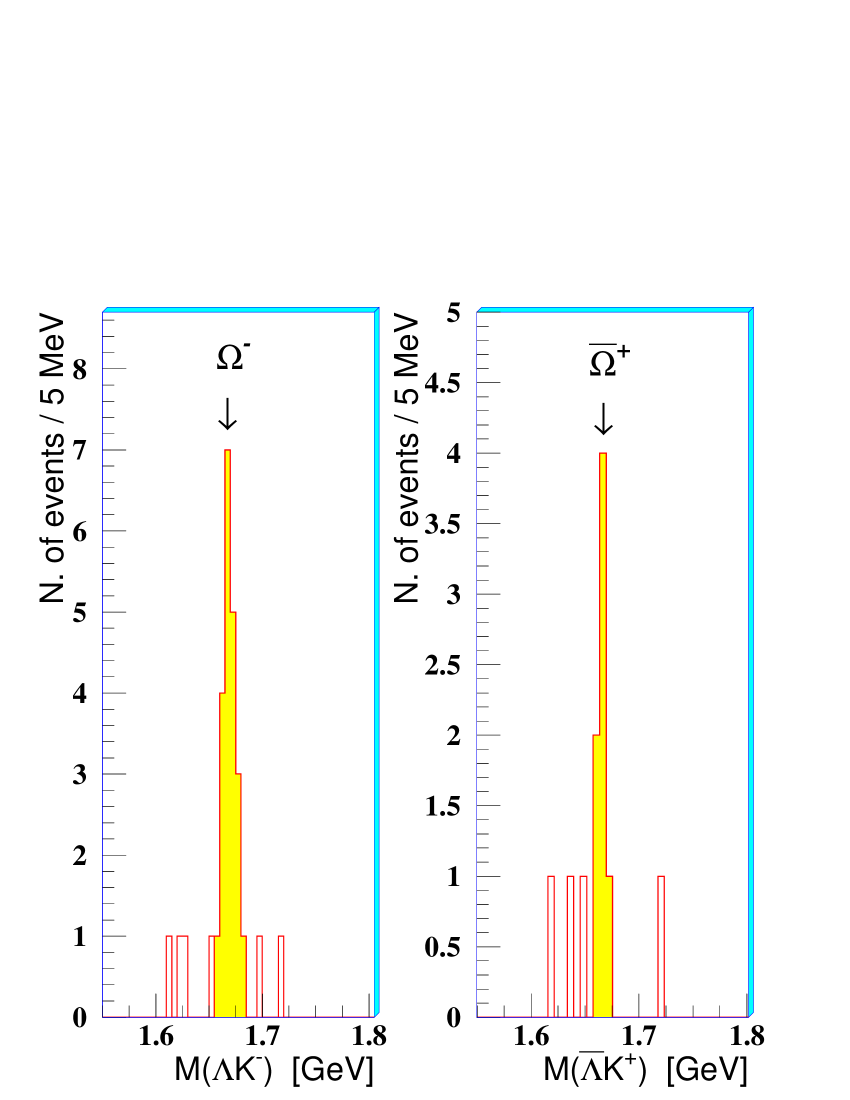
The quality of the signals is comparable to that at 158 GeV/ [5, 14], with the hyperon mass peaks at the nominal PDG values [17] and FWHMs of about 15 MeV/. The invariant mass peak has a FWHM of 25 MeV/ and its maximum is shifted down by 4 MeV/ with respect to the nominal value. This effect has been accounted for in the calculation of the corrections for acceptance and reconstruction inefficiencies. The selected particles have been chosen in the invariant mass intervals corresponding to the shaded areas of figure 2.
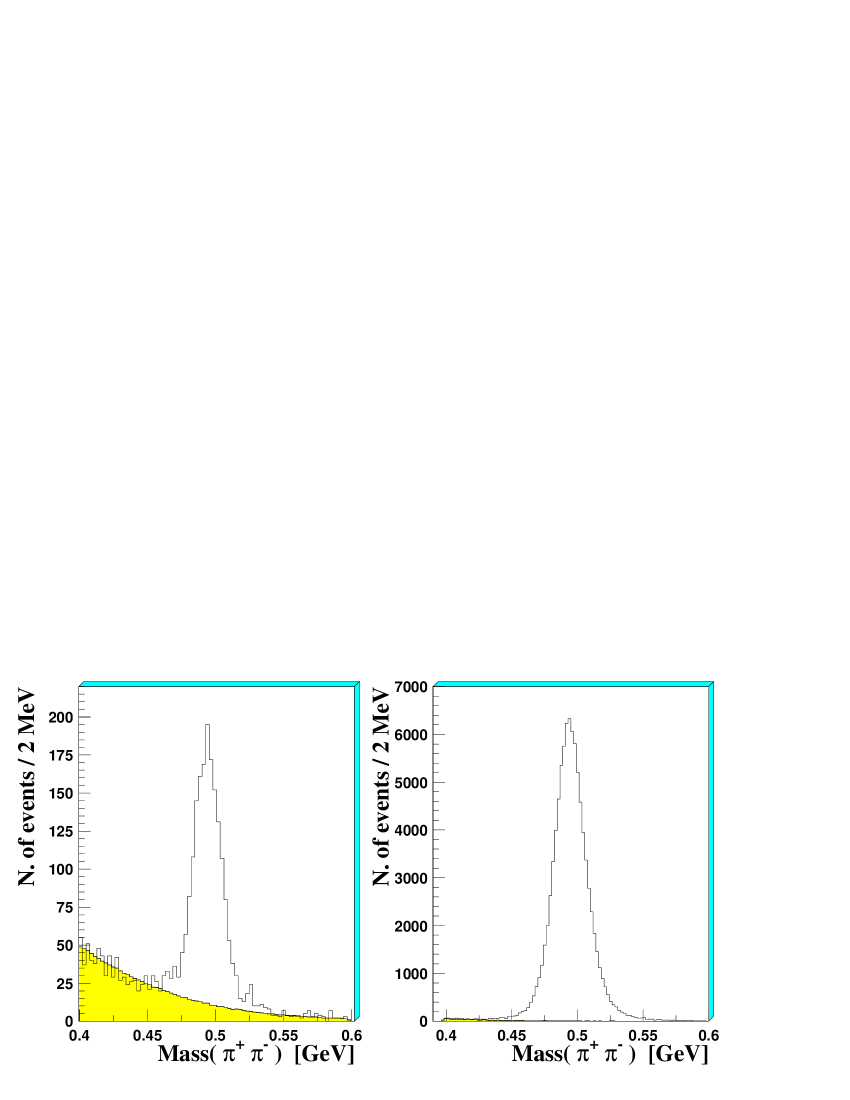
The amount of residual combinatorial background has been evaluated using the event-mixing technique [14, 18]. As an example, figure 3 shows the invariant mass distribution for real and mixed events before (left) and after (right) the application of the analysis cuts.
For the cascade hyperons, the residual background has been evaluated to be about 4% for and less than 10% for and +; for the singly-strange particles, it has been estimated to be 1%, 0.8% and 2% for , and , respectively.
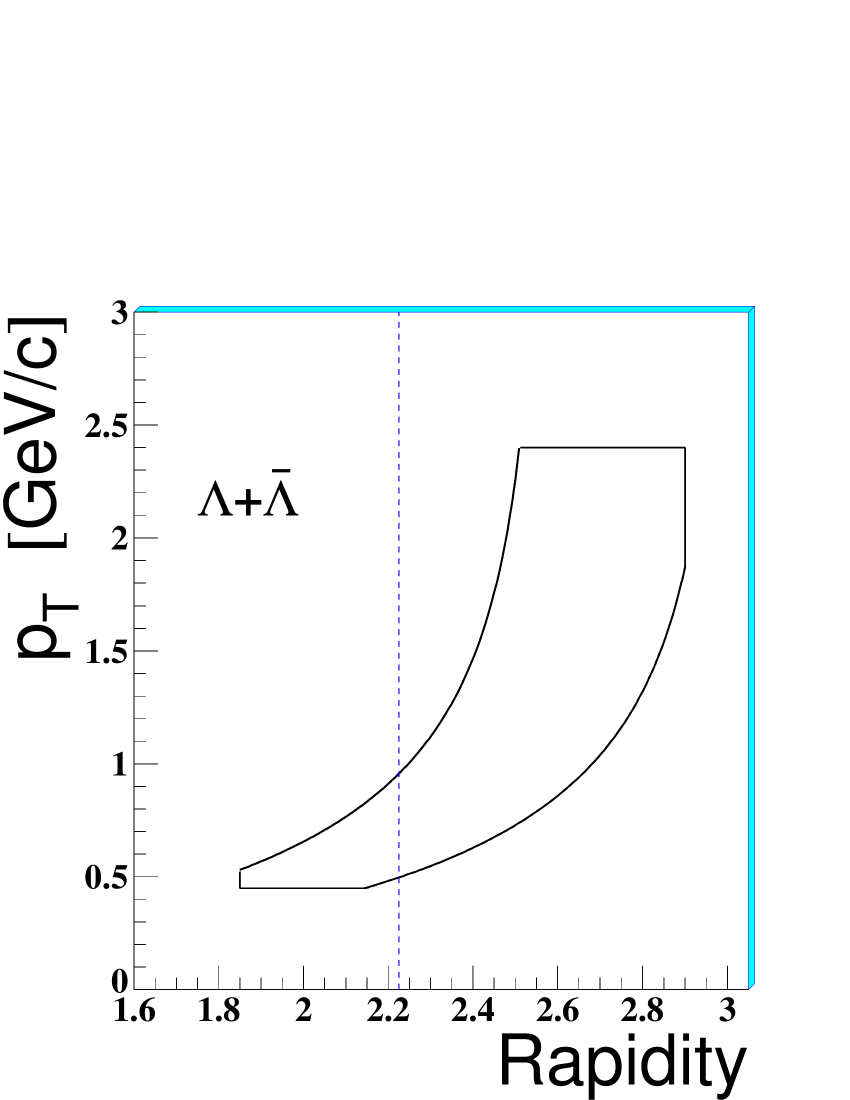
The acceptance regions in the transverse momentum () versus rapidity () plane are shown in figure 4. The limits of these windows have been defined in order to exclude from the final sample the strange particles whose lines of flight are very close to the borders of the telescope, where the systematic errors are more difficult to evaluate.


Each reconstructed particle is assigned a weight to correct for acceptance and reconstruction inefficiencies. The computational algorithm of the event weight is the same used at higher energy [5, 14]: a number of Monte Carlo events are generated — each event consisting of one simulated particle, with the and of the real particle and random azimuthal and internal decay angles, merged with a real event of similar telescope hit multiplicity as the original event — and they are reconstructed with the same analysis tools as for real events; the final weight is the ratio of the number of generated particles to the number of those reconstructed and retained by the selection criteria. This individual correction procedure has been applied to all the reconstructed , and particles. For the much more abundant and candidates, the individual weights have been computed for a subsample only. These amount to 1/20 and 1/15 of the total sample, respectively, and they have been extracted uniformly over the full data taking period. The statistics of particles collected and individually corrected is given in table 2.
| + | ||||||
|---|---|---|---|---|---|---|
| total | 97000 | 82500 | 2100 | 439 | 39 | 28 |
| 1/20 | 1/15 | 1 | 1 | 1 | 1 |
The correction procedure has been extensively checked by comparing real and Monte Carlo distributions for several parameters — in particular those used for particle selection, such as the distance of closest approach in space between the two decay particles, the position of the decay vertices, the impact parameters of the particles111 The impact parameter is approximated as the distance from the primary vertex of the intersection of the measured particle trajectory with a plane transverse to the beam line passing through the target position. , etc. — for different data taking periods and magnetic field orientations (up and down).
In order to further check the stability of the results (i.e. the distributions) the selection criteria have also been varied, either by changing their limiting values or by excluding them one at a time. As a result of these studies we can estimate the contribution of the selection and correction procedure to the systematic errors on the slope of the distributions to be about 12% for and 8% for all other particles.
The experimental procedure for the determination of the distribution is described in detail in reference [14], where the results at 158 GeV/ are discussed. The measured distribution of the double differential invariant cross-section has been assumed to factorize into a and an dependent part:
| (2) |
This assumption has been verified by considering the () distributions for different slices in rapidity (transverse mass).
The shape of the rapidity distribution, i.e. in equation 2, has been found to be well described within our limited acceptance by a constant for all particles except for and , where a Gaussian provides a better description. We have reported a similar finding in Pb–Pb collisions at 158 GeV/ beam momentum [19].
The hypotheses on the factorization of the double differential invariant cross-section (equation 2) and on the shape of the rapidity distributions () can introduce a systematic bias on the slope of the distributions which has been estimated not to exceed 5%.
An additional source of systematic errors comes from the residual combinatorial background, which can have a different distribution than the signal. This error is found to be negligible for and , and about 1.5%, 2%, 4% and 7% for , , and , respectively.
4 Exponential fits of the transverse mass spectra
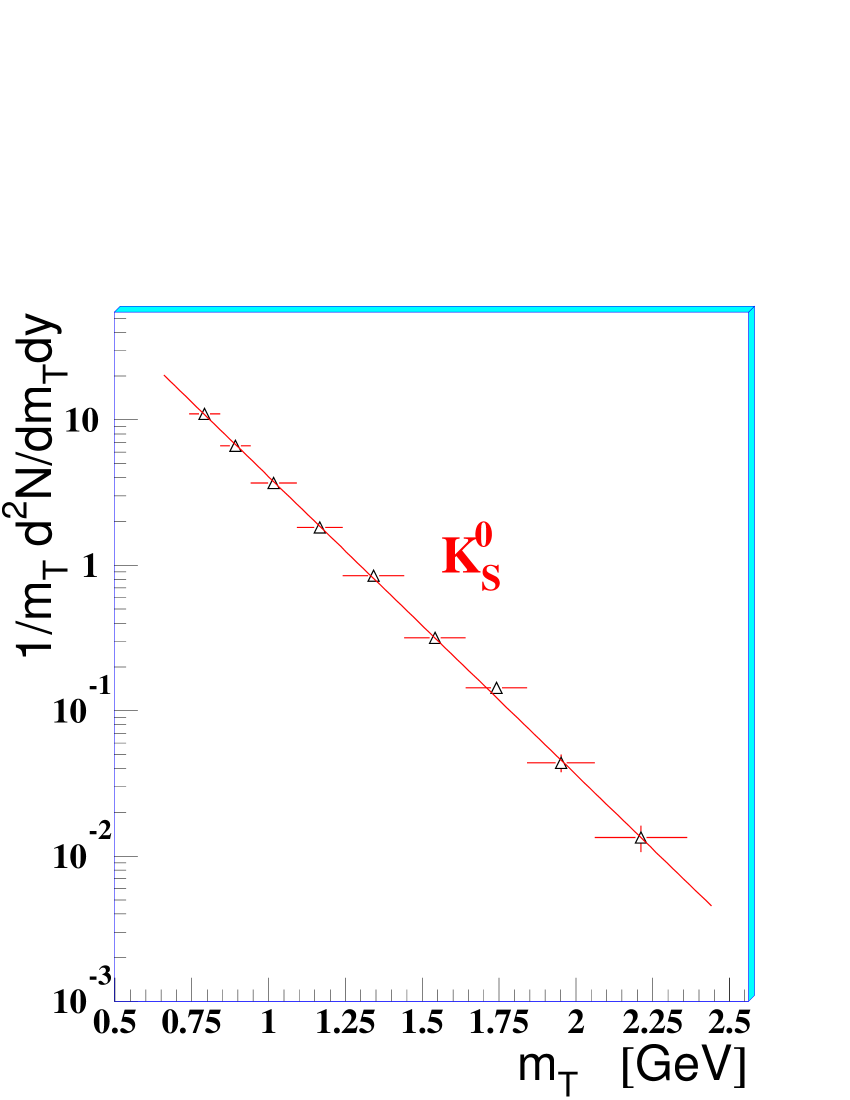
The inverse slope parameter (“apparent temperature”) has been extracted by means of a maximum likelihood fit of the measured double differential invariant cross-section to the formula
| (3) |
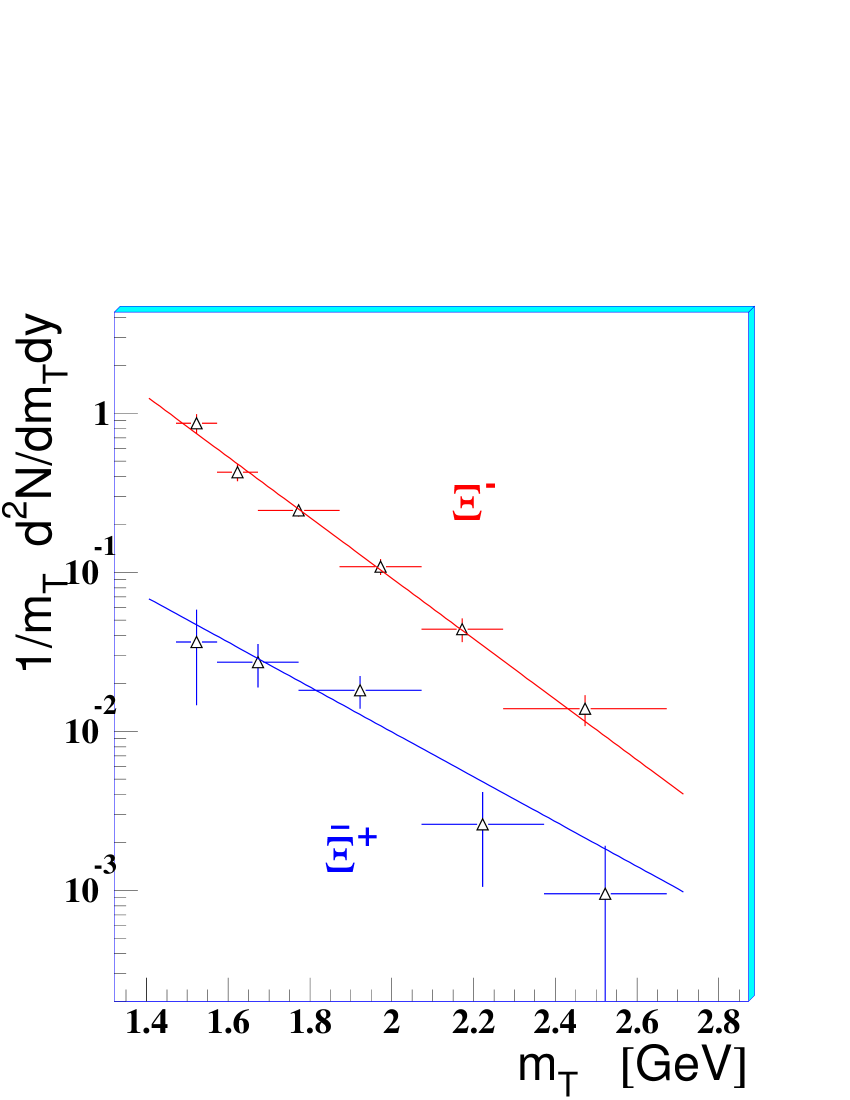
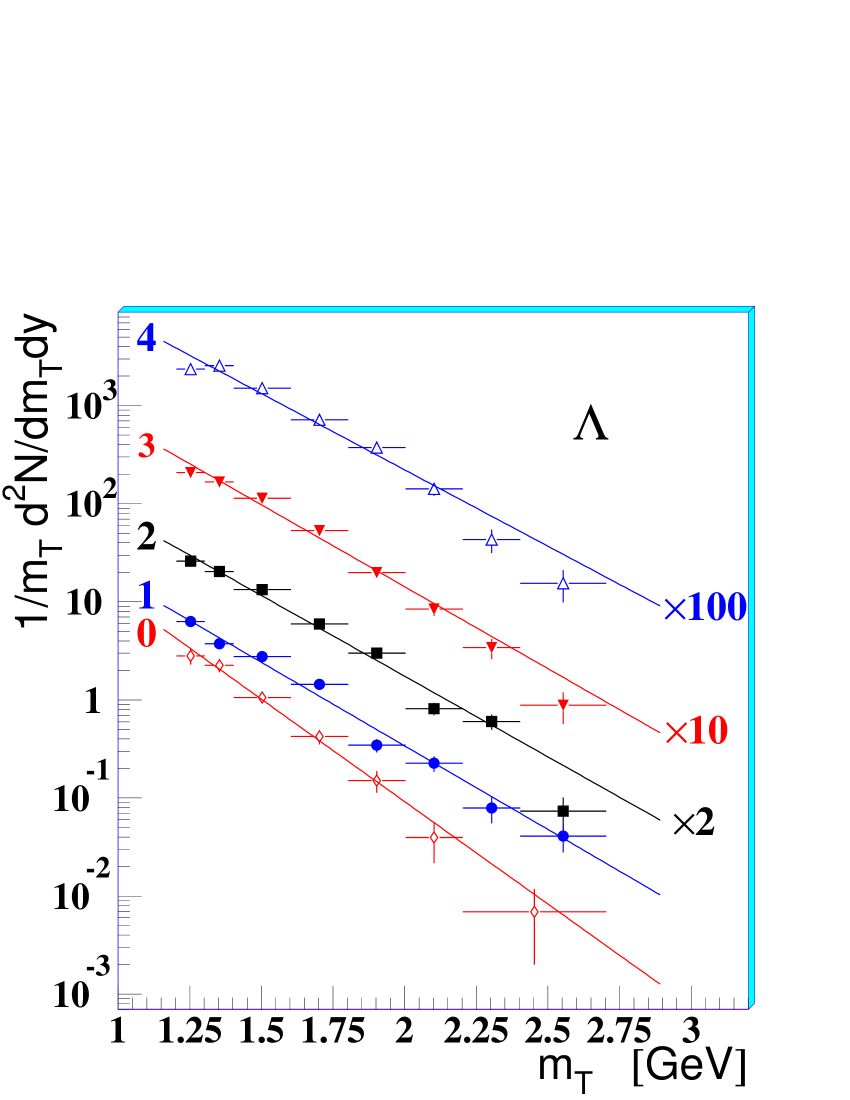
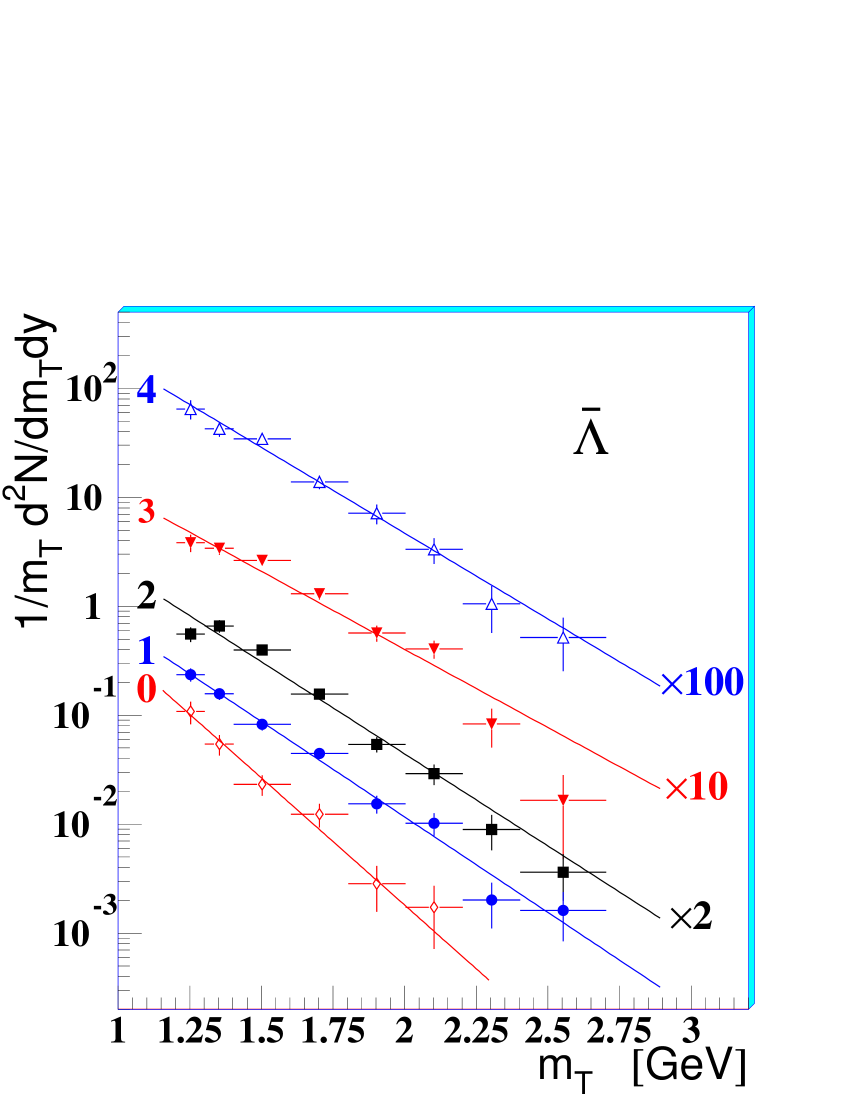
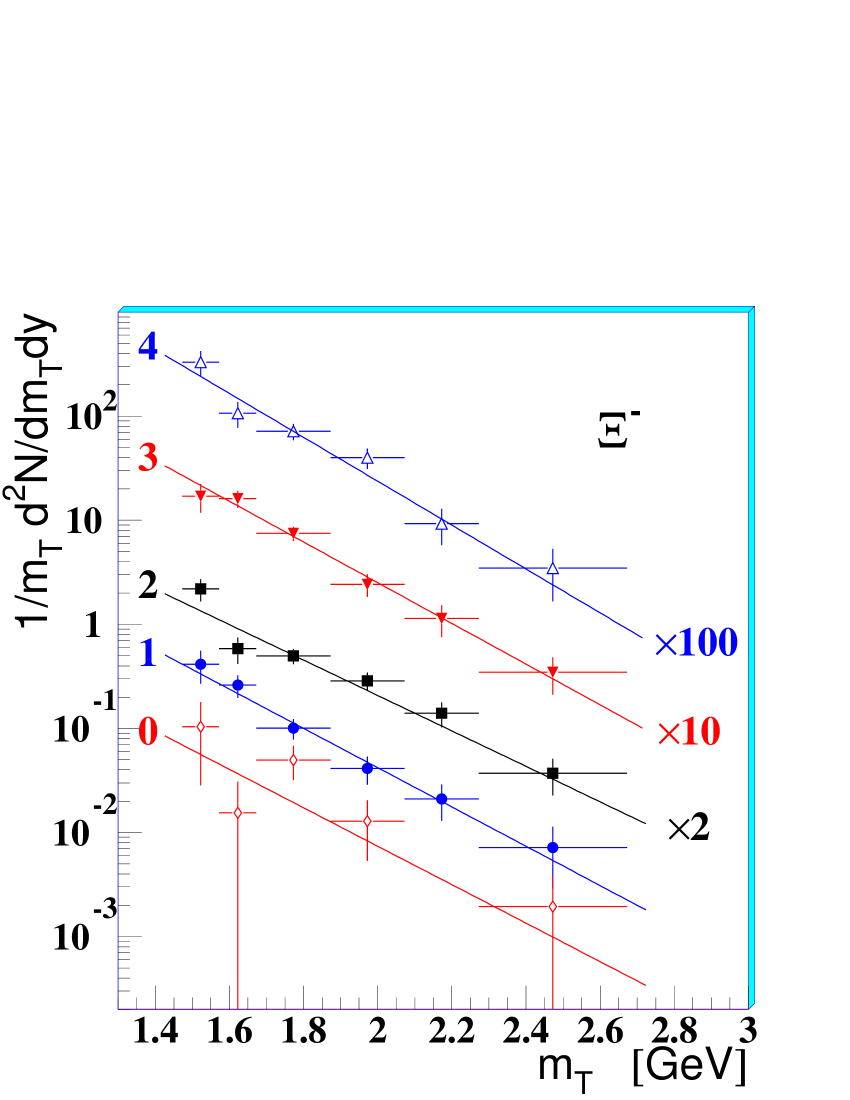
The apparent temperature is interpreted as due to the thermal motion coupled with a collective transverse flow of the fireball components [13]. The differential invariant cross-section distributions are shown in figure 5 as a function of for the most central 53% of the inelastic Pb–Pb cross-section with the likelihood fit results superimposed. The values of the inverse slope parameters are given in table 3. The quoted systematic errors are obtained by propagating the partial contributions due to i) the selection and correction procedure, ii) the hypothesis on the parameterization of the double differential cross-section and iii) the residual combinatorial background.
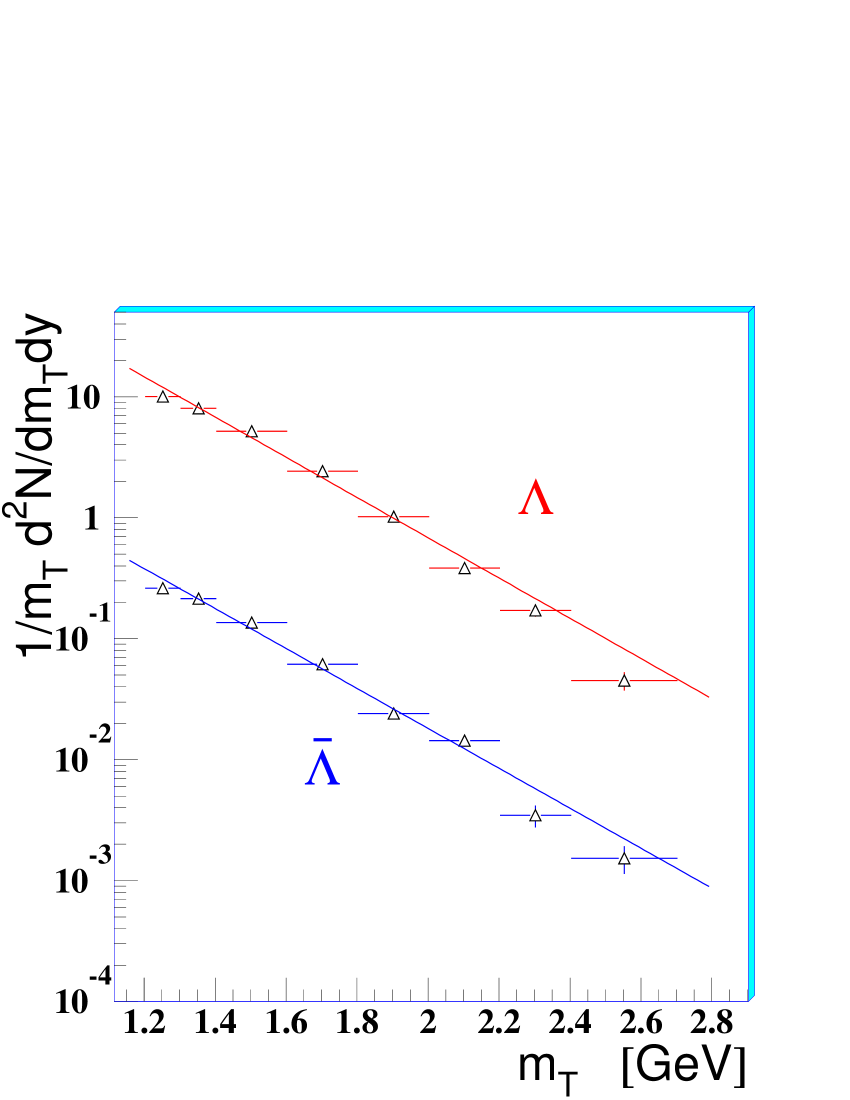

The and distributions have very similar inverse slopes, agreeing within 2%222The systematic errors do not play a role in such a comparison since they essentially cancel out in the ratio of the spectra. The only different contribution which can be envisaged arises from the different residual background. This has been estimated to affect by less than 1.5% the inverse slope of the , as mentioned before.. A similar baryon–anti-baryon symmetry was reported at top SPS energy for central and semi-central Pb–Pb collisions for and [14]. The similarity of baryon and anti-baryon slopes is interpreted as suggestive that strange baryons and anti-baryons would be produced and evolve in the collision dynamics by similar mechanisms. Based on the and results presented above, a similar conclusion can be extended to the 40 GeV/ collisions. The large statistical errors associated to the distribution prevent any such conclusion for this multi-strange baryon.
In the hydro-dynamical view, the apparent temperature depends on 333In this view, the graphical interpretation of would be the inverse of the tangent to the invariant distribution. See reference [14] for a detailed discussion.. At a given value, it can be calculated according to the formula [13]:
| (4) |
With some approximations, this expression simplifies for two asymptotic cases: at low , i.e. , it provides [13, 20], where is the freeze-out temperature and is the average transverse flow velocity; at high , i.e. , the apparent temperature is simply blue-shifted by the collective dynamics, independently of the particle mass [13]:
| (5) |
Therefore, the apparent temperature actually depends on the range where the distribution has been fitted to an exponential function. Nevertheless, provided that the spectra are measured at intermediate over similar ranges, the inverse slopes should follow a hierarchy with the rest mass of the particles. The apparent temperature of the hyperon is found to be smaller than those of the and particles, and of the same order as that of the meson. A similar “violation” of the mass hierarchy was reported for the triply-strange particle by the WA97 [21], NA57 [14] and NA49 [22] experiments at 158 GeV/, and was interpreted [23] as an indication of an earlier decoupling of that particle from the expanding fireball. In the next section we shall discuss in more details the possibility of a similar effect for the at 40 GeV/.
Figure 6 shows a comparison of the inverse slopes measured at the two energies plotted as a function of the particle rest mass.
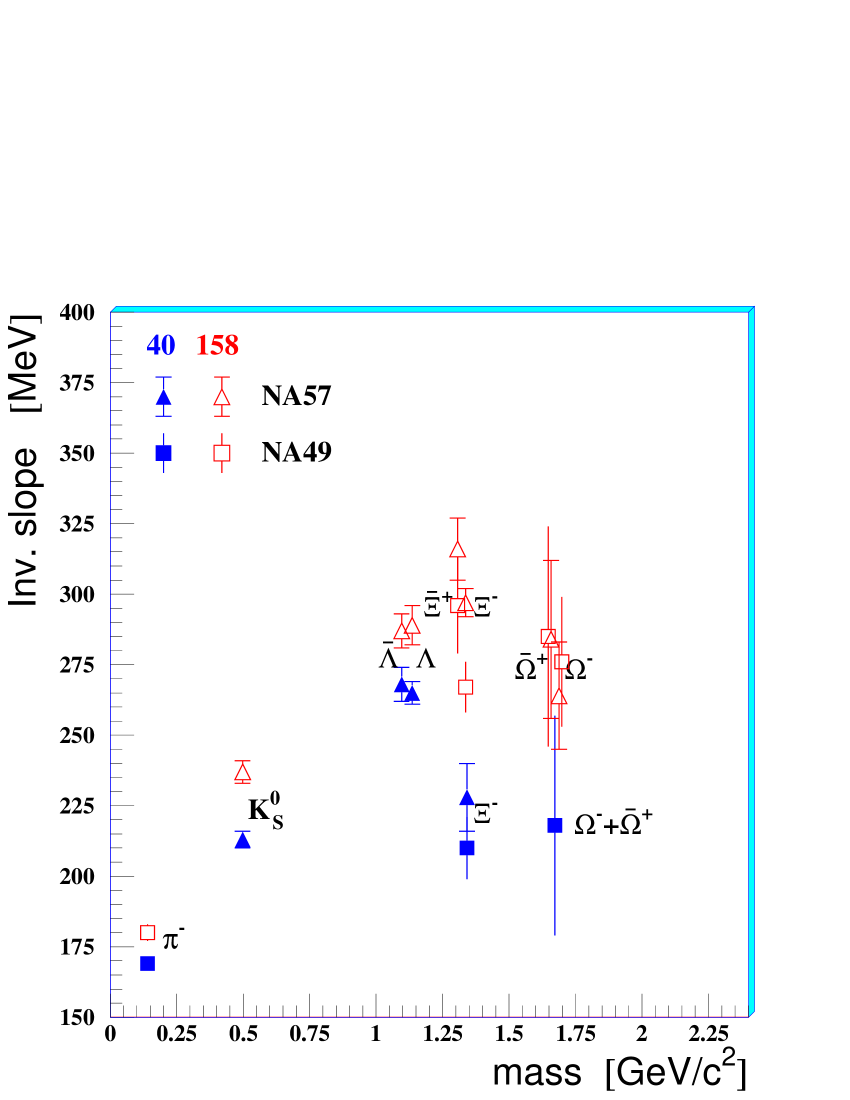
The inverse slopes are lower at lower energy by about 7% for non-strange and singly-strange particles and about 20% for the multi-strange ones.
4.1 Centrality dependence
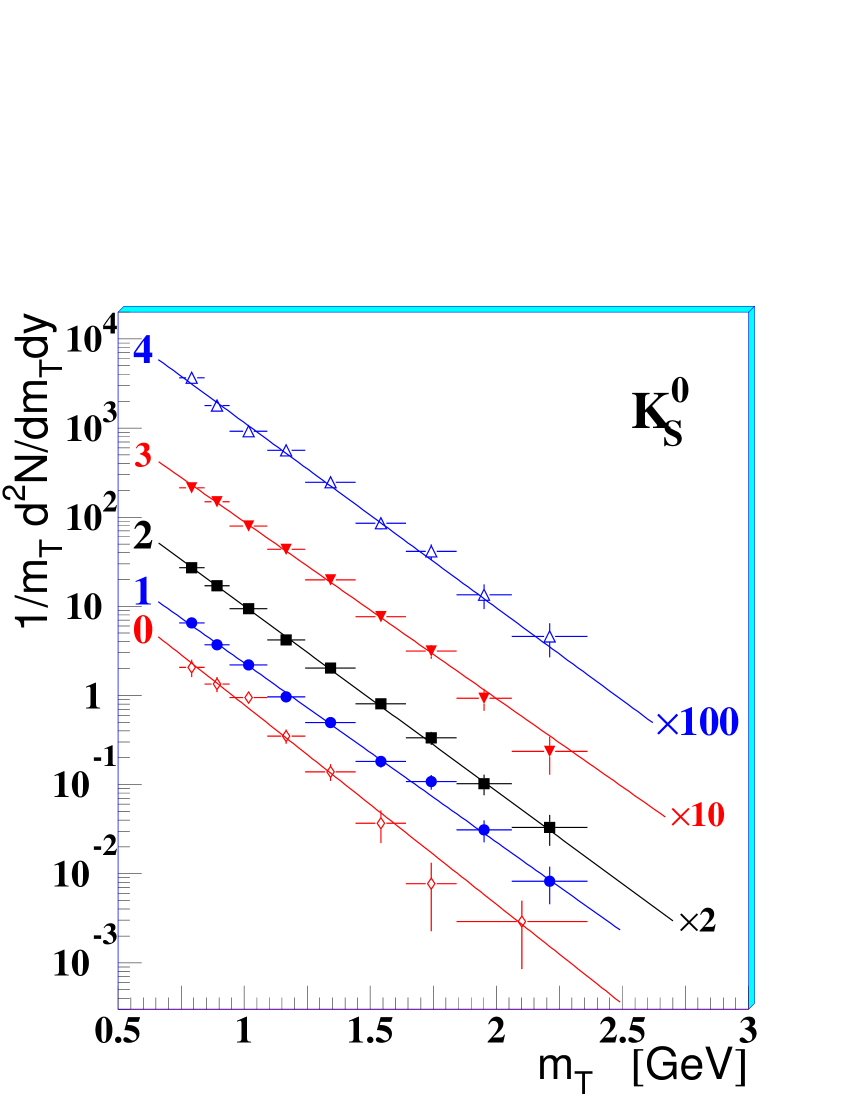
The transverse mass spectra measured in the individual centrality classes of table 1 are shown in figure 7 for , , and . For the rarer and hyperons, the collected statistics do not allow to study the centrality dependence. Maximum likelihood exponential fits are superimposed to the spectra, as in figure 5.
The inverse slope parameters are given in table 4 as a function of centrality.
| 0 | 1 | 2 | 3 | 4 | |
|---|---|---|---|---|---|
An increase of the apparent temperature when going from class 0 to class 1 is observed for the singly-strange particles. Then, from class 1 to 4, the inverse slopes of these particles remain approximately constant. The baryon–anti-baryon symmetry in the shape of the spectra discussed above for the hyperon is preserved also as a function of centrality.
No centrality dependence is observed within the errors for the hyperon. Remarkably, the apparent temperature of the hyperon is below those of and and compatible with that of the light meson for all centrality classes apart for class 0 where the mass hierarchy appears to be reestablished.
5 Blast-wave description of the spectra
In this section we employ the statistical hadronization model of reference [13], which has provided a good description of the 158 GeV/ results [14, 19], to study the strange particle spectra discussed above. The model assumes that particles decouple from a system in local thermal equilibrium with a temperature , and which expands both longitudinally and in the transverse direction; the longitudinal expansion is taken to be boost-invariant and the transverse expansion is defined in terms of a transverse velocity profile. In this model the differential cross-section for particle has the form:
| (6) |
where is a transverse boost, and are modified Bessel functions, is the transverse geometric radius of the source at freeze-out and is a normalization constant. The transverse velocity profile has been parameterized as
| (7) |
The numerical value of does not influence the shape of the spectra but just the absolute normalization (i.e. the constant ). The parameters which can be extracted from the fit of equation 6 to the experimental spectra are thus the thermal freeze-out temperature and the surface transverse flow velocity . Assuming a uniform particle density, the latter can be related to the average transverse flow velocity using the expression .
Equation 6, which is obtained by integrating the Cooper–Frye invariant distribution function [26] over the rapidity of fluid elements () up to a maximum longitudinal flow [13], is a good approximation of a full hydro-dynamical calculation for small rapidity windows about mid-rapidity. When such a hypothesis is not fulfilled, a numerical integration should be performed which, however, requires a priori knowledge of the maximum longitudinal flow444The can be derived from a fit to the distributions as shown, e.g., in reference [19].. The smaller the values of the longitudinal flow, the larger the deviations from equation 6. In order to estimate the maximum bias introduced by this approximation, we have performed the integration by assuming that the longitudinal flow has the same strength as the transverse one, whereas the collective expansion is expected to be stronger in the longitudinal direction due to the incomplete stopping of the incoming nucleons. Both freeze-out parameters and are found to be smaller by 2% when the full integration is performed.
5.1 Global fit with different profiles
The result of the global fit of equation 6 with a linear profile hypothesis (i.e. with the exponent in equation 7) to the data points of all measured strange particle spectra is shown in figure 8 (left panel) for the event sample corresponding to the most central 53% of the inelastic Pb–Pb cross-section; the fit yields the following values for the two parameters and :
with . A large contribution to the comes from the spectra: the possibility of an early freeze-out of multi-strange particles is discussed below.
The and parameters are statistically anti-correlated, as can be seen from the confidence level contour shown in figure 8 (right panel). The systematic errors on and are instead correlated.

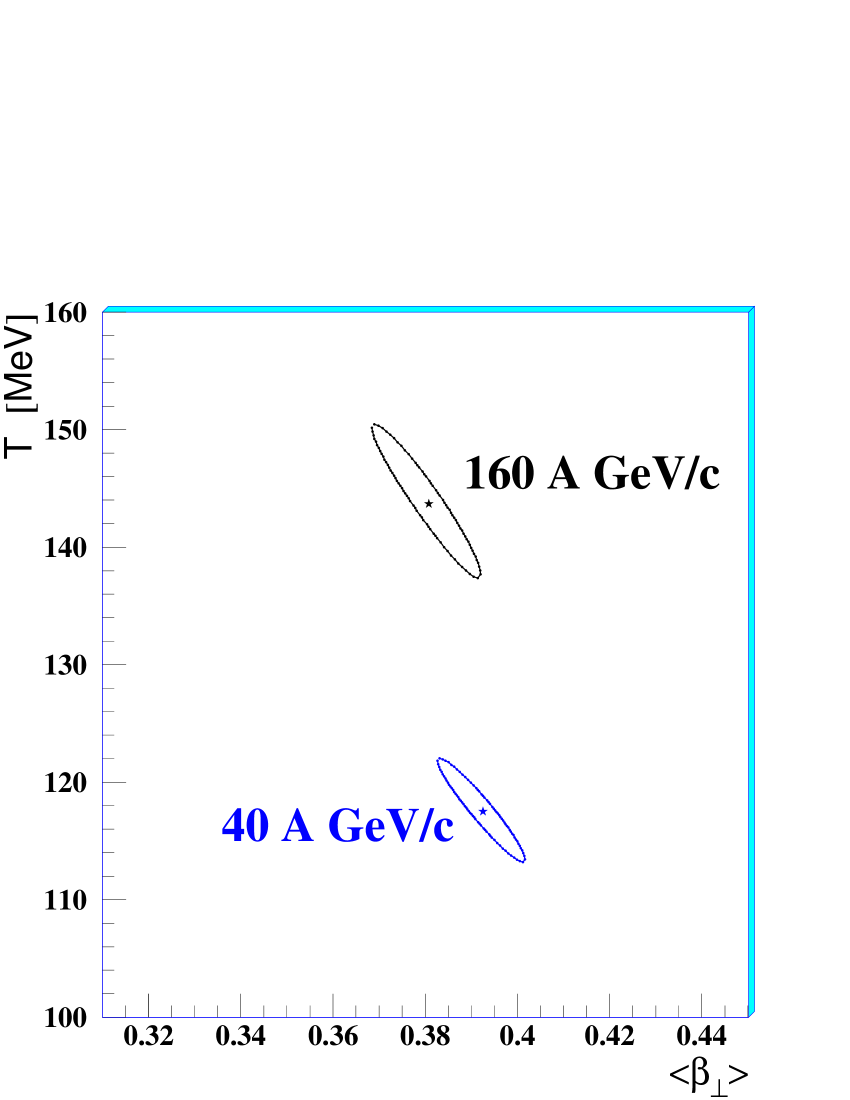
Right: contour plots in the – plane at the 1 confidence level as compared to the result at 158 GeV/ [14] in the same centrality range.
The results of the fits with different profile hypotheses are given in table 5.
| (MeV) | ||||
|---|---|---|---|---|
Contrary to the 158 GeV/ case [14], where the use of the three profiles =0, 1/2 and 1 results in equally well described spectra555The profile was instead disfavoured by data. with similar values of the freeze-out temperature and of the average transverse flow velocity, at this energy the quality of the fit is best with and gradually worsens as the exponent is increased. Since the case is unphysical, the choice , which has also been suggested to be a good approximation of the full hydro-dynamical calculation [27], appears to be favoured. However, for the sake of comparison with the higher energy results, in the following a linear () radial dependence of the transverse flow velocity is used.
5.2 Particles with/without quarks in common with the nucleon.
Since the particles which share valence quarks with the nucleons may have a different behaviour from which do not, we have performed separate fits for the particles of the two groups. Results of separate blast-wave fits are given in table 6.
| particles | (MeV) | ||
|---|---|---|---|
| , , | |||
| , , , |
The freeze-out conditions for the two groups of particles are compatible within 2. Since the interaction cross-sections for the particles of the two groups are expected to be very different, this finding would suggest limited importance of final state interactions (i.e. a rapid thermal freeze-out) and similar production mechanisms for the two groups. A similar conclusion has also been drawn at 158 GeV/ [14], where the freeze-out parameters for the two groups agree within 1.
5.3 Earlier freeze-out of multi-strange particles ?
At higher energies it has been argued that multi-strange baryons may undergo an earlier freeze-out than other particles: at top SPS energy this scenario has been suggested based on the spectra measurements of the WA97 [21], NA57 [14] and NA49 [22] Collaborations. At RHIC, results from the STAR Collaboration [28] suggest that the particles freezes out earlier than , K, p and .
The 1 contours of the separate blast-wave fits for singly and multiply-strange particles are shown in the left-hand panel of figure 9.
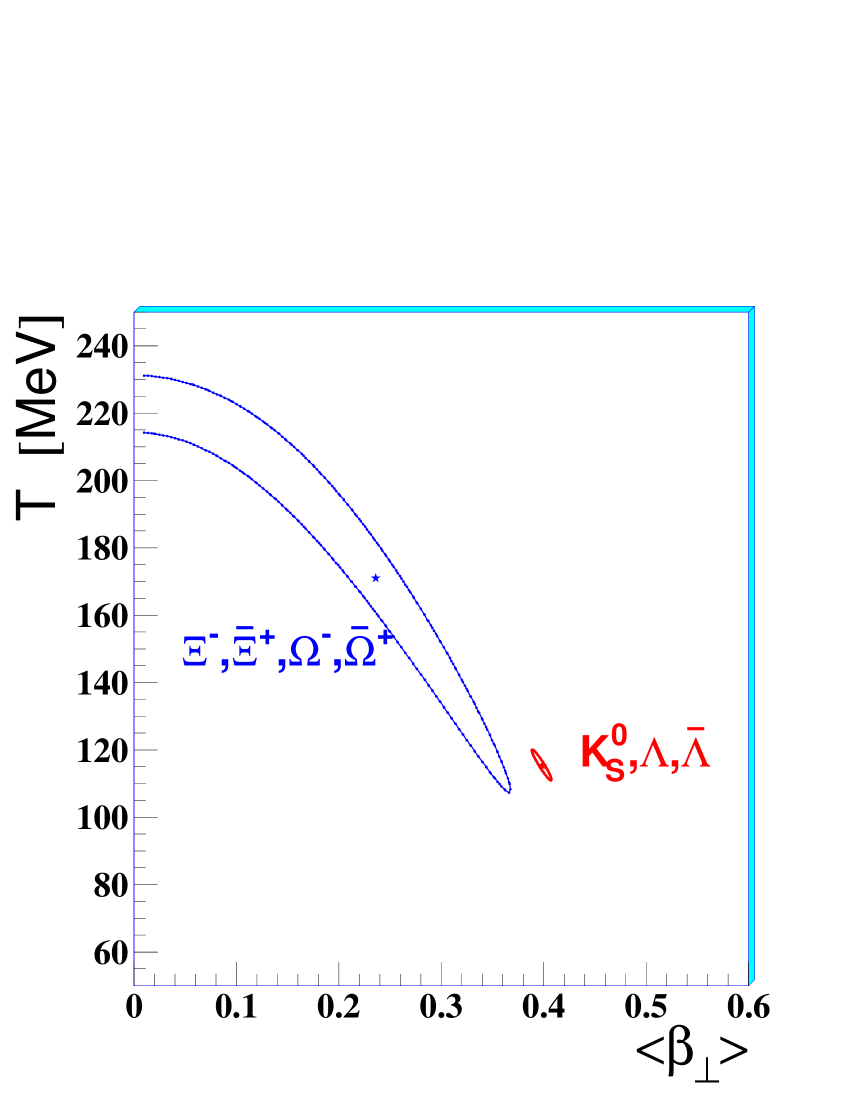
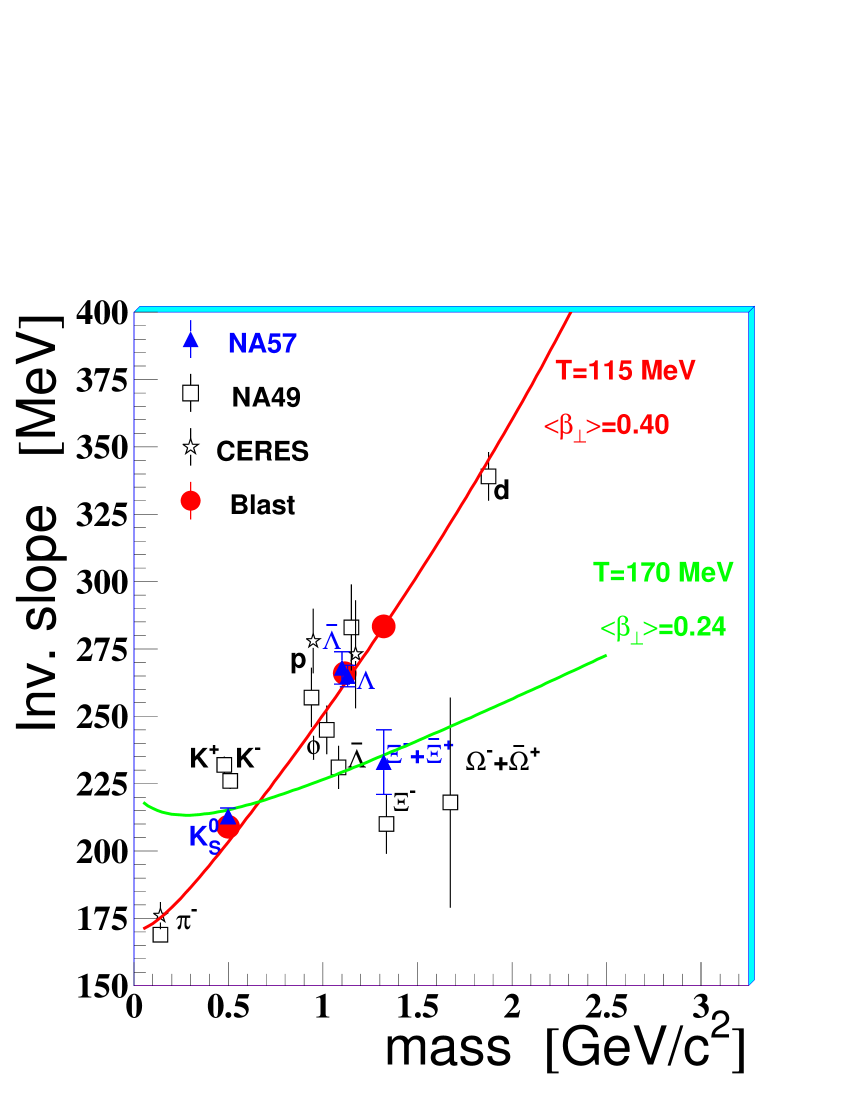
The plot seems to indicate that the hyperon, which statistically dominates the multiply-strange particle fit, may have a different thermal freeze-out behaviour from , and . However, due to the low statistics, it is not possible to extract significant values for both freeze-out parameters from the spectrum alone. The possibility of a deviation for the hyperon from the freeze-out systematics extracted from the combined fit to the , and spectra can be better inferred from the integrated information of the spectrum, i.e. from its inverse slope. In figure 9 (right panel) we plot a compilation of data666 The NA49 results are taken from the following references: , and from [8]; and deuteron from [29]; and from [9]; from [30]; from [24] and from [22]. The CERES inverse slopes, which are taken from reference [31], are shown for negative hadrons, net proton and . on the inverse slopes measured in Pb–Pb collisions at 40 GeV/, superimposed to the blast-wave model results. The full lines represent the inverse slope one would obtain by fitting an exponential to a “blast–like” distribution (i.e. to equation 6) for a generic particle of mass , in the common range GeV/, for two different freeze-out conditions. The first corresponds to the parameters of the best fit to the singly-strange particles ( MeV , ), the second to those of the multiply-strange ones ( MeV, ). Since the inverse slope is a function of the range where the fit is performed, we have also computed the blast-wave inverse slopes of , and spectra in the ranges of NA57 (closed circles). The measured values of the inverse slope of the multi-strange baryons appear to deviate significantly from the trend of the other strange particles.
5.4 Centrality dependence
The hydro-dynamical description of observables related to collective dynamics, e.g. the elliptic flow, is strongly influenced by the freeze-out temperature. It is therefore important to determine how the thermal freeze-out conditions may change with respect to the initial collision geometry.
The centrality dependence of the freeze-out parameters at 158 GeV/ beam momentum can be summarized as follows: the more central the collisions the larger the transverse collective flow and the lower the final thermal freeze-out temperature [14], the dependence being more pronounced for the flow. A similar behaviour was reported at RHIC by the PHENIX [32], STAR [28] and BRAHMS [33] Collaborations. Higher freeze-out temperatures for more peripheral collisions may be interpreted as the result of earlier decoupling of the expanding system.
In figure 10 we show the confidence level contours for each of the five centrality classes defined in table 1.
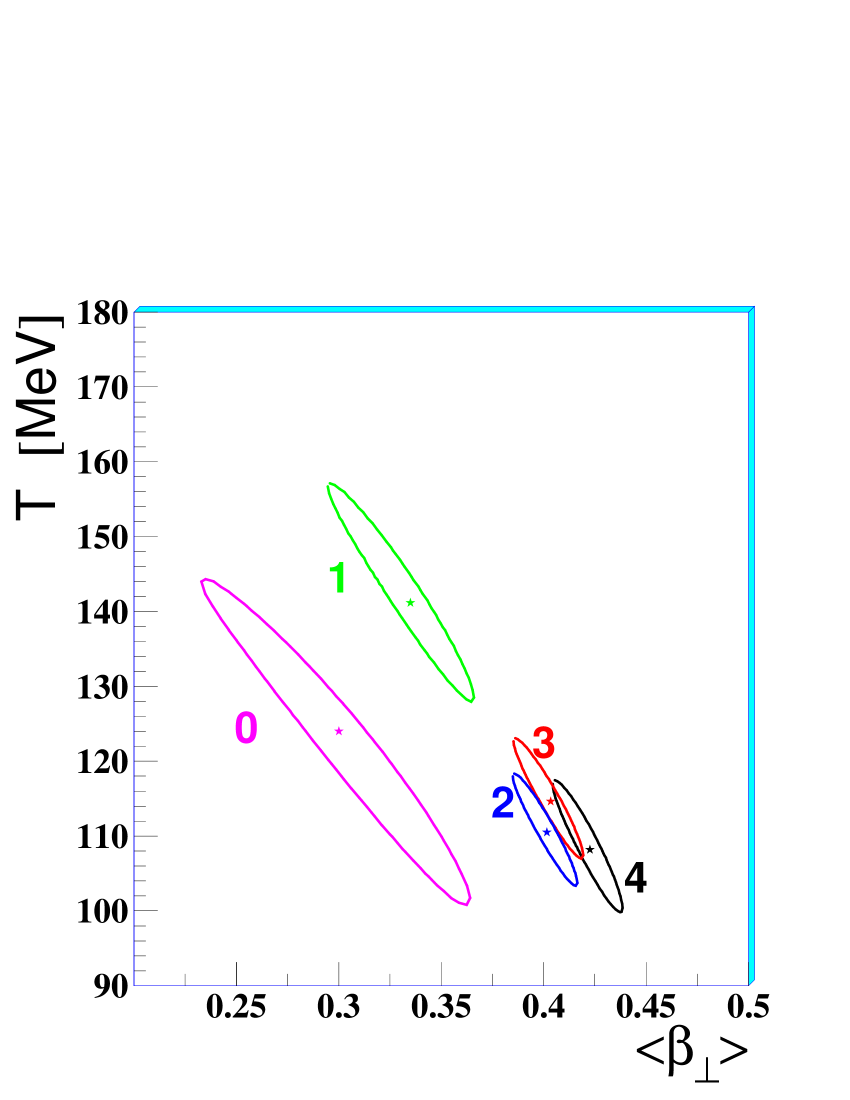
With decreasing collision centrality the transverse flow velocity decreases steadily, as also observed at higher energies. The freeze-out temperature is roughly constant within the errors at the value MeV for the three most central classes (i.e. for the most central 23% of the inleastic Pb–Pb cross-section).
6 Conclusions
We have analyzed the transverse mass spectra of , , hyperons, their anti-particles and mesons in Pb–Pb collisions at 40 GeV/ beam momentum over a centrality range corresponding to the most central 53% of the Pb–Pb inelastic cross-section.
The inverse slopes of these particles are found to be lower than those measured at 158 GeV/ beam momentum. As a function of centrality, the inverse slopes of the singly-strange particles increase significantly when going from the most peripheral class to the next one; for the more central classes, a weak increase with centrality cannot be excluded for and . The inverse slope of the is compatible with being constant over the whole centrality range. and hyperons have not been studied as a function of the centrality due to the limited statistics.
Particle and anti-particle inverse slopes are compatible within the errors; in particular, the inverse slopes of and hyperons are the same within 5% over the covered centrality range, thus suggesting that strange baryons and anti-baryons may be produced and evolve in the collision dynamics by similar mechanisms.
The inverse slope of the hyperons significantly deviates from the general trend of values increasing with the particle rest mass, as observed for non-strange and singly-strange particles.
The analysis of the transverse mass spectra in the framework of the blast-wave model suggests that after a central collision the system expands with an average transverse flow velocity of about 40% of the speed of light and then it freezes out when the temperature is of the order of 110 MeV. The measured transverse flow velocity is compatible with that measured at 158 GeV/ but the freeze-out temperature is lower at low energy. The inverse slope of the hyperon deviates from the value predicted by the blast-wave model tuned on singly-strange particles (, and ). Finally, the results on the centrality dependence of the expansion dynamics indicate that with increasing centrality the transverse flow velocity increases steadily and the freeze-out temperature decreases when going from class 1 (23–40%) to the more central classes.
References
References
- [1] Karsch F 2002 Lect. Notes Phys. 583 209
- [2] Ritter H G and Wang X-N (ed) 2004 J. Phys. G: Nucl. Phys.30 S633-S1430 (Proc. Quark Matter 2004) Lévai P and Csörgo T (ed) 2006 Nucl. Phys.A in press (Proc. Quark Matter 2005)
- [3] Rafelski 2004 J. Phys. G: Nucl. Phys.30 S1-S28
- [4] Rafelski J and Müller B 1982 Phys. Rev. Lett.48 1066 Rafelski J and Müller B 1986 Phys. Rev. Lett.56 2334 Koch P, Müller B and Rafelski J 1986 Phys. Rep. 142 167 Rafelski J 1991 Phys. Lett.B 262 333
- [5] Antinori F et al. 2006 J. Phys. G: Nucl. Phys.32 427-441
- [6] Andersen E et al. 1999 Phys. Lett.B 449 401 Antinori F et al1999 Nucl. Phys.A 661 130c
- [7] Bruno G E et al. 2004 J. Phys. G: Nucl. Phys.30 S717-S724
- [8] Afanasiev S V et al. 2002 Phys. Rev.C 66 054902
- [9] Antic T et al2004 Phys. Rev. Lett.93 022302
- [10] Alt C et al2005 Phys. Rev. Lett.94 052301
- [11] Andronic A, Braun-Munzinger P and Stachel J 2006 Nucl. Phys.A 772 in press, nucl-th/0511071 Becattini F, M. Gaździcki M, Keranen A, Manninen J and Stock R 2004 Phys. Rev.C 69 024905 Becattini F, Manninen J and Gaździcki 2006 Phys. Rev.C 73 044905 Letessier J and Rafelski J 2005 submitted to Phys. Rev.C, nucl-th/0504028 Broniowski W, Florkowski W and Michalec M 2002 Acta Phys. Pol. B 33 761, nucl-th/0106009 Broniowski W and Florkowski W 2002 Phys. Rev.C 65 064905, nucl-th/0112043
- [12] Hirano T 2004 J. Phys. G: Nucl. Phys.30 S845-S851 Torrieri G and Rafelski J J. Phys. G: Nucl. Phys.30 S557-S564 Heinz U W 2005 J. Phys. G: Nucl. Phys.31 S717-S724 Csernai L P, Molnár E, Nyíri Á and Tamosiunas K 2005 J. Phys. G: Nucl. Phys.31 S951-S957 Steinberg P A 2005 Nucl. Phys.A 752 423c-432c
- [13] Schnedermann E, Sollfrank J and Heinz U 1993 Phys. Rev.C 48 2462 Schnedermann E, Sollfrank J and Heinz U 1994 Phys. Rev.C 50 1675
- [14] Antinori F et al. 2004 J. Phys. G: Nucl. Phys.30 823-840
- [15] Manzari V et al. 1999 J. Phys. G: Nucl. Phys.25 473 Manzari V et al. 1999 Nucl. Phys.A 661 761c
- [16] Antinori F et al. 2005 J. Phys. G: Nucl. Phys.31 321-335
- [17] Eidelman S et al2004 Review of Particle Properties Phys. Lett.B 592 1
- [18] Bruno G E et al. 2002 in QCD and High Energy Hadronic Interactions edited by Trân Thanh Vân 405-410 (Proc. Rencontres de Moriond); Preprint hep-ex/0207047
- [19] Antinori F et al. 2005 J. Phys. G: Nucl. Phys. 31 1345-1357
- [20] Lee K S, Heinz U and Schnedermann E 1990 Z. Phys.C 48 525 Csörgo T and Lorstad B 1996 Phys. Rev.C 54 1390
- [21] Antinori F et al. 2000 Eur. Phys. J. C 14 633
- [22] Alt C et al. 2005 Phys. Rev. Lett.94 192301
- [23] van Hecke H, Sorge H and Xu N 1998 Phys. Rev. Lett.81 5764
- [24] Afanasiev S V et al. 2002 Phys. Lett.B 538 275-281
- [25] Meurer C et al. 2004 J. Phys. G: Nucl. Phys.30 S1325-S1328
- [26] Cooper F and Frye G 1974 Phys. Rev.D 10 186
- [27] Wiedemann U A 2003 Private communication
- [28] Adams J. et al. 2004 Phys. Rev. Lett.92 182301
- [29] Anticic T et al. 2004 Phys. Rev.C 69 024902
- [30] Friese V et al. 2005 J. Phys. G: Nucl. Phys.31 S911-S918 and private communication
- [31] Schmitz W et al. 2002 J. Phys. G: Nucl. Phys.28 1861-1868
- [32] Adcox K et al 2004 Phys. Rev.C 69 024904
- [33] Arsene I et al 2005 Phys. Rev.C 72 014908